

Abstract
In 2012, the World Health Organization adopted a resolution on maternal, infant and young child nutrition that included a global target to reduce by 40% the number of stunted under‐five children by 2025. The target was based on analyses of time series data from 148 countries and national success stories in tackling undernutrition. The global target translates to a 3.9% reduction per year and implies decreasing the number of stunted children from 171 million in 2010 to about 100 million in 2025. However, at current rates of progress, there will be 127 million stunted children by 2025, that is, 27 million more than the target or a reduction of only 26%. The translation of the global target into national targets needs to consider nutrition profiles, risk factor trends, demographic changes, experience with developing and implementing nutrition policies, and health system development. This paper presents a methodology to set individual country targets, without precluding the use of others. Any method applied will be influenced by country‐specific population growth rates. A key question is what countries should do to meet the target. Nutrition interventions alone are almost certainly insufficient, hence the importance of ongoing efforts to foster nutrition‐sensitive development and encourage development of evidence‐based, multisectoral plans to address stunting at national scale, combining direct nutrition interventions with strategies concerning health, family planning, water and sanitation, and other factors that affect the risk of stunting. In addition, an accountability framework needs to be developed and surveillance systems strengthened to monitor the achievement of commitments and targets.
Keywords: stunting, malnutrition, growth, infant nutrition, child health
Introduction
In May 2012, the World Health Organization (WHO) adopted a resolution on maternal, infant and young child nutrition that included six global targets to reduce the high burden of disease associated with malnutrition, particularly during the critical period from conception to 24 months of age. The first target addresses the scourge of stunting and aims to reduce by 40% the number of stunted children under 5 years of age in 2025 (WHO 2012).
There are good reasons why stunting has recently gained international attention. First, it affects large numbers of children globally (United Nations Children's Fund, World Health Organization & The World Bank 2012). Second, it has severe short‐ and long‐term health consequences. Evidence demonstrates that stunting in early life is associated with adverse functional consequences including poor cognition and educational performance, low adult wages, lost productivity and, when accompanied by excessive weight gain later in childhood, increased risk of nutrition‐related chronic diseases (Victora et al. 2008). Third, there is international agreement on its definition (i.e. percentage of children with height‐for‐age below minus two standard deviations from the median of the WHO Child Growth Standards) and a robust standard that defines normal human growth which is applicable everywhere, regardless of ethnicity, socio‐economic status and type of feeding (WHO Multicentre Growth Reference Study Group 2006; de Onis et al. 2012). Fourth, there is agreement on a critical window – from conception to the first 2 years of life – within which linear growth is most sensitive to environmentally modifiable factors related to feeding, infections and psychosocial care (Victora et al. 2010; Black et al. 2013). Fifth, it is a cross‐cutting problem calling for a multisectoral response (Casanovas et al. 2013; Ruel et al. 2013). Action to reduce stunting requires improvements in food and nutrition security, education, WASH (water, sanitation and hygiene interventions), health, poverty reduction and the status of women (Stewart et al. 2013).
This paper summarises the rationale for the global target on stunting, describes stunting trends from 1990 until 2025, presents a methodology to adapt the global target at the national level, and reviews what can be done to reduce stunting.
Key messages
In 2012, the World Health Organization adopted a resolution on maternal, infant and young child nutrition including a global target to reduce by 40% the number of stunted under‐five children by 2025.
The global target translates to a 3.9% reduction per year to decrease the number of stunted children from 171 million in 2010 to about 100 million in 2025. However, at current progress rates, there will be 127 million stunted children by 2025 – a reduction of only 26%.
Translation of the global target into national targets needs to consider nutrition profiles, risk factor trends, demographic changes, experience with developing and implementing nutrition policies, and degree of health system development.
Nutrition interventions must be complemented by nutrition‐sensitive development and evidence‐based multisectoral plans to address stunting at national scale.
An accountability framework will need to be developed and surveillance systems strengthened to monitor commitments and the achievement of targets.
Background to the WHO global nutrition targets
In May 2010, the World Health Assembly requested the Director‐General to develop a comprehensive plan on infant and young child nutrition as a critical component of a global multisectoral nutrition framework (resolution WHA63.23). In January 2011, the WHO Executive Board recommended, inter alia, revising the plan's title to include maternal nutrition and giving greater attention to the double burden of undernutrition and overweight.
In 2011, five regional consultations (in Africa, the Americas, South‐East Asia, Eastern Mediterranean and Western Pacific) were held to obtain inputs from Member States and concerned stakeholders on the proposed plan's outline. During these consultations, a number of Member States requested that global targets be developed for conditions which are responsible for a large proportion of the burden of nutrition‐related morbidity and mortality from conception to the first 2 years of life.
In January 2012, the Executive Board considered the report on ‘Maternal, infant and young child nutrition: draft comprehensive implementation plan’ and requested further global consultation regarding the targets via a Web‐based process open to all Member States and multilateral organisations. In May 2012, the Sixty‐Fifth World Health Assembly endorsed the Comprehensive Implementation Plan (2012–2025) on Maternal, Infant and Young Child Nutrition, which included global targets on six nutrition indicators: stunting, anaemia, low birthweight, overweight, breastfeeding and wasting (WHO 2012).
The criteria used in selecting indicators included their epidemiological and public health relevance; availability of effective and feasible evidence‐based public health interventions; evidence that targets can be achieved in all countries regardless of income level; consistency with targets included in existing policy frameworks; existence of surveillance systems or data collection instruments and the potential for establishing baselines and monitoring changes over time; and national capacity for monitoring proposed target indicators.
Stunting in children fulfilled all the foregoing criteria and was included as the first global nutrition target, which complements Millennium Development Goal 1 on reducing the prevalence of underweight children. Stunting is also one of the key indicators recommended by both the Countdown to 2015 for Maternal, Newborn and Child Survival (WHO 2010) and the Commission on Information and Accountability for Women's and Children's Health (WHO 2011).
How the target for reducing global stunting was established
The global target is to reduce the total number of stunted children under 5 by 40% by 2025. Using the 2010 global estimate of 171 million stunted children as a baseline (26.7% prevalence) (de Onis et al. 2011) and the projected world population growth by 2025 (United Nations, Department of Economic and Social Affairs, UN Population Division 2009), an average annual relative reduction rate (AARR) of 3.9% between 2012 and 2025 will be required to meet the global target and reduce the number of stunted children to 102.6 million (i.e. approximately 100 million). An analysis of 110 countries with at least two stunting prevalence estimates between 1995 and 2010 (based on 430 data points) showed that global stunting dropped at the rate of 1.8% per year. During this period, 20% of the countries reduced stunting at a rate of 3.9% or higher. Details on how to calculate the AARR are found elsewhere (Bartlett 1993; UNICEF Division of Policy and Practice, Statistics and Monitoring Section 2007).
Africa shows rising numbers of stunted children due to population increase and an almost stagnant prevalence of stunting over the past two decades. There have been some African countries with substantial reductions in stunting, e.g. Ethiopia reduced the stunting rate from 57% to 44% between 2000 and 2011, Ghana from 34% to 29% between 1993 and 2008, and Mauritania from 55% in 1990 to 22% in 2012 (http://www.who.int/nutgrowthdb). However, overall, in this region little improvement is anticipated in the coming years if recent trends continue (United Nations Children's Fund, World Health Organization & The World Bank 2012) (Fig. 1). In contrast, Asia showed a substantial decrease in stunting between 1990 and 2010, nearly halving the number of stunted children – from 190 million to 100 million (Fig. 1). This corresponds to an overall reduction in stunting of 20.7% between 1990 and 2010, i.e. a 43% relative reduction in 20 years, or 2.8% per year. In areas of Bangladesh where the integrated management of childhood illness (IMCI) approach was implemented, stunting rates in children aged 24–59 months dropped from 63.1% to 50.4% between 2000 and 2007 (i.e. a 13% absolute reduction, or an average relative reduction of 3.2% per year in 7 years) (Arifeen et al. 2009).
Figure 1.
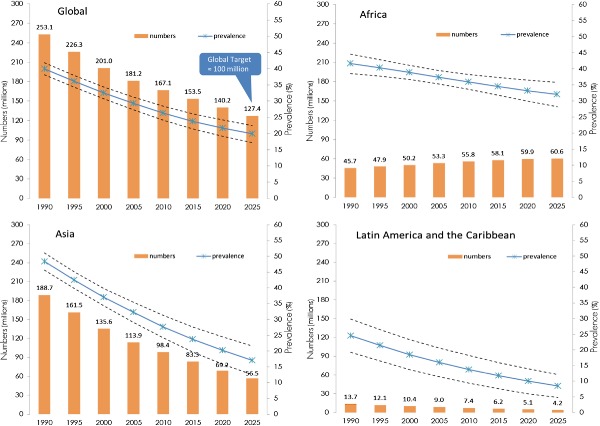
Trends in child stunting – prevalence and numbers – by UN region (1990–2025).
A remarkable reduction in stunting has also been documented in some regions of South America. For example, in the Northeast Region of Brazil the prevalence of stunting in children under 5 decreased from 34% in 1986 to 6% in 2006 (i.e. a 28% absolute reduction of stunting, or an average relative reduction of 8.7% per year in 20 years) (Lima et al. 2010). The four primary reasons for this dramatic decline were: (1) increased purchasing power of low‐income families; (2) improved educational levels of mothers; (3) expanded public water supplies and sewage systems; and (4) virtually universal basic health care, including prenatal care (Lima et al. 2010). The Brazilian experience shows that the scourge of chronic malnutrition can be reduced if income among the poor rises simultaneously with increased access to schools, clean water, sanitation and basic health care (Monteiro et al. 2009; Victora et al. 2011). Similarly, in Mexico stunting decreased from 27% to 16% over the period 1988–2006 (i.e. an 11% absolute reduction or an average relative reduction of 2.9% per year in 18 years) due to better targeting and enhanced coverage of a conditional cash‐transfer program and increased access to health care facilities (Rivera 2009; Rivera et al. 2009). The latest 2010–2011 national survey of Mexico reports 13.6% stunting, continuing the decreasing trend (http://www.who.int/nutgrowthdb).
Forecasting trends in stunting – 1990–2025
The global target was based on an analysis published in 2011 (de Onis et al. 2011), which estimated that in 2010 there were 171 million stunted under‐five children, 167 million of whom lived in developing countries. Based on 576 nationally representative surveys from 148 countries, including surveys from as early as 1966, childhood stunting was estimated to have decreased globally from 39.7% in 1990 to 26.7% in 2010. In September 2012, UNICEF, WHO and the World Bank jointly released child malnutrition estimates for stunting, underweight, wasting and overweight (United Nations Children's Fund, World Health Organization & The World Bank 2012). This analysis used pooled data from the WHO Global Database on Child Growth and Malnutrition (de Onis & Blössner 2003; http://www.who.int/nutgrowthdb) and the global database of anthropometry maintained by UNICEF (http://www.childinfo.org/malnutrition_nutritional_status.php). The joint data set included 639 nationally representative surveys from 142 countries available until July 2012. This analysis, contrary to the earlier one, excluded surveys prior to 1985, thereby changing the anchor of fitted trends, and used the 2010 revision of UN population estimates (United Nations, Department of Economic and Social Affairs, Population Division 2011). Population estimates are updated every 2 years, and population size has a direct impact on stunting trends and point estimates. Despite using a larger number of surveys, excluding those prior to 1985, and applying updated population estimates, the 2012 UNICEF/WHO/WB joint estimates are similar to those that WHO published in 2011. This is largely due to the fact that both analyses used the same methodology – a linear mixed‐effect modelling approach (de Onis et al. 2004) – for deriving trends. This paper presents trend forecasts from 1990 to 2025 for stunting (Fig. 1, Table 1) based on the last analyses conducted in 2012 (United Nations Children's Fund, World Health Organization & The World Bank 2012).
Table 1.
Prevalence and numbers of stunted* children under 5 years by UN region – 1990–2025
| UN regions and sub‐regions | 1990 | 2011 | 2025 | |||
|---|---|---|---|---|---|---|
| % | Millions | % | Millions | % | Millions | |
| Africa | 41.6 | 45.7 | 35.6 | 56.3 | 32.0 | 60.6 |
| 38.5–44.6 | 42.3–49.0 | 33.3–38.0 | 52.5–60.0 | 28.2–35.8 | 53.4–67.8 | |
| Eastern | 50.6 | 18.0 | 42.1 | 22.8 | 36.7 | 24.9 |
| 44.2–57.0 | 15.7–20.3 | 38.9–45.4 | 21.0–24.6 | 32.4–41.1 | 22.0–27.9 | |
| Middle | 47.2 | 6.4 | 35.0 | 7.8 | 27.8 | 7.3 |
| 36.4–58.2 | 5.0–7.9 | 29.1–41.4 | 6.5–9.2 | 16.5–42.8 | 4.4–11.3 | |
| Northern | 28.6 | 6.3 | 21.0 | 5.0 | 16.9 | 4.0 |
| 22.3–35.8 | 4.9–7.9 | 14.6–29.4 | 3.5–7.0 | 9.9–27.4 | 2.3–6.4 | |
| Southern | 36.2 | 2.2 | 30.8 | 1.8 | 27.5 | 1.5 |
| 32.9–39.7 | 2.0–2.4 | 25.2–37.0 | 1.5–2.2 | 20.8–35.3 | 1.2–2.0 | |
| Western | 39.1 | 12.8 | 36.4 | 18.9 | 34.6 | 22.9 |
| 35.4–42.9 | 11.5–14.0 | 31.7–41.2 | 16.5–21.5 | 27.1–42.9 | 17.9–28.4 | |
| Asia † | 48.4 | 188.7 | 26.8 | 95.8 | 17.1 | 56.5 |
| 45.6–51.1 | 178.1–199.3 | 23.2–30.5 | 82.8–108.8 | 12.6–21.6 | 41.6–71.4 | |
| Eastern † | 36.8 | 47.9 | 8.5 | 7.5 | 2.7 | 2.0 |
| 34.9–38.6 | 45.5–50.3 | 7.9–9.2 | 7.0–8.1 | 2.5–2.9 | 1.8–2.1 | |
| South‐central | 59.3 | 107.5 | 36.4 | 68.8 | 23.5 | 42.3 |
| 54.4–64.0 | 98.6–116.1 | 30.1–43.2 | 57.0–81.7 | 16.5–32.4 | 29.7–58.3 | |
| South‐eastern | 47.3 | 27.0 | 27.4 | 14.6 | 17.5 | 8.7 |
| 38.1–56.6 | 21.7–32.3 | 21.8–33.7 | 11.6–18.0 | 11.7–25.3 | 5.8–12.6 | |
| Western | 29.2 | 6.3 | 18.0 | 4.8 | 12.6 | 3.5 |
| 22.7–36.6 | 4.9–7.9 | 10.4–29.5 | 2.8–7.9 | 5.4–26.7 | 1.5–7.4 | |
| Latin America and Caribbean | 24.6 | 13.7 | 13.4 | 7.1 | 8.5 | 4.2 |
| 19.3–29.9 | 10.8–16.7 | 9.0–17.7 | 4.8–9.4 | 4.8–12.2 | 2.4–6.1 | |
| Caribbean | 16.5 | 0.7 | 6.7 | 0.2 | 3.5 | 0.1 |
| 9.4–27.2 | 0.4–1.1 | 3.1–13.7 | 0.1–0.5 | 1.5–8.3 | 0–0.3 | |
| Central America | 34.0 | 5.4 | 18.6 | 3.0 | 11.8 | 1.8 |
| 23.9–45.8 | 3.8–7.2 | 11.6–28.5 | 1.9–4.6 | 6.8–19.5 | 1.0–3.0 | |
| South America | 21.4 | 7.7 | 11.5 | 3.9 | 7.4 | 2.3 |
| 15.5–28.8 | 5.6–10.4 | 6.9–18.6 | 2.3–6.2 | 3.6–14.5 | 1.1–4.6 | |
| Oceania ‡ | 40.4 | 0.4 | 35.5 | 0.5 | 32.4 | 0.5 |
| 26.8–55.7 | 0.3–0.5 | 16.0–61.4 | 0.2–0.8 | 7.7–73.4 | 0.1–1.1 | |
| Developing countries | 44.6 | 248.4 | 28.0 | 159.7 | 21.3 | 121.8 |
| 42.6–46.7 | 237.0–259.9 | 25.6–30.4 | 145.9–173.4 | 18.4–24.2 | 105.1–138.5 | |
| Developed countries | 6.1 | 4.7 | 7.2 | 5.1 | 8.1 | 5.7 |
| 3.3–11.0 | 2.5–8.5 | 4.1–12.6 | 2.9–8.9 | 4.5–14.2 | 3.2–9.9 | |
| Global | 39.9 | 253.1 | 25.7 | 164.8 | 19.9 | 127.4 |
| 38.1–41.8 | 241.4–264.9 | 23.5–27.9 | 150.8–178.8 | 17.2–22.5 | 110.5–144.4 | |
*Height‐for‐age below −2 SD from the WHO Child Growth Standards. †Excluding Japan. ‡Excluding Australia and New Zealand.
In 2011, there were an estimated 165 million under‐five stunted children, a 35% decrease from an estimated 253 million in 1990 (Table 1). Globally, the prevalence decreased from an estimated 40% in 1990 to 26% in 2011. At regional level, there was very little decline in Africa (from 42% to 36%) compared to Asia (from 48% to 27%). At present, Eastern and Western Africa and South‐central Asia have the highest prevalence estimates among UN sub‐regions (42% in East Africa and 36% in both West Africa and South‐central Asia). The largest number of children affected by stunting, 69 million, live in South‐central Asia (Table 1). Oceania, which has a very high rate of stunting (36% in 2011), nonetheless contributes little in numbers affected due to its relatively small population.
The global target calls for reducing the number of stunted children from 171 million in 2010 to just over 100 million by 2025. However, based on the present rate of decline and the latest UN population estimates, the expected stunting prevalence in 2025 will be 20%, or 127 million, which is approximately 27 million children above the global target (Fig. 1). Only small improvements are anticipated in Africa, with prevalence decreasing from 36% in 2010 to 32% in 2025, and total numbers of stunted children increasing from 56 to 61 million. The pessimistic projection for stunting reduction in Africa assumes all factors contributing to stunting will remain the same as in the previous 20 years, e.g. disease burden, food security, infant and young child feeding practices, poverty, economic growth, female literacy, WASH, investment in nutrition, but it is not known if the trends and prospects for all these factors are equally gloomy going forwards. For Asia, a substantial decrease in stunting prevalence is forecast from 28% in 2010 to 17% in 2025, resulting in an estimated 57 million stunted children in 2025, or 44% of the world's anticipated burden of 127 million by 2025.
Setting country‐specific stunting targets
For operational purposes, the global target for stunting needs to be translated into context‐specific national targets, taking into consideration present levels and trends of stunting (Fig. 2), risk factor trends, demographic changes, experience with developing and implementing nutrition policies, degree of health system development and previous experience with interventions. Establishing national targets will help in developing national policies and programs and calculating the level of resources required for their implementation.
Figure 2.
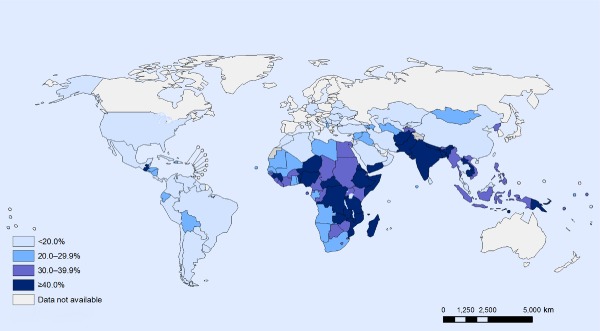
Stunting among children under 5: latest national prevalence estimates.
Various methods can be used to develop individual country targets to achieve the global stunting target. A simple approach could be to fix the AARR at 3.9% over the 13 years (2012–2025) for each country. Using this method, the total reduction in the number of stunted children is approximately 57 million (a relative reduction of 37%) for the 34 countries with the highest burden of stunting (i.e. countries with stunting ≥ 20% accounting for 90% of the global number of stunted children) (Table 2). China is excluded from the table as its prevalence of stunting was only 10% according to their last national estimate in 2010, but with 7.7 million stunted children represents 4.6% of the global burden for 2010 and would rank fifth in Table 2 after India, Nigeria, Pakistan and Indonesia.
Table 2.
Average annual relative reduction rate of stunting fixed at 3.9% (global average) from baseline to 2025 applied to the 34 high‐burden countries
| High‐burden country* | Survey year | Baseline stunting rate † (%) | 2012 under 5‐year population ‡ (‘000s) | 2012 numbers of stunted children (‘000s) | 2025 under 5‐year population ‡ (‘000s) | 2025 projected stunting rate § (%) | 2025 projected numbers of stunted children (‘000s) | Reduction in numbers of stunted children (‘000s and %) |
|---|---|---|---|---|---|---|---|---|
| Afghanistan | 2004 | 59.3 | 5 816.8 | 3 449.4 | 7 214.2 | 35.4 | 2 550.6 | 898.8 (26.1) |
| Angola | 2007 | 29.2 | 3 433.1 | 1 002.5 | 4 021.1 | 17.4 | 700.1 | 302.4 (30.2) |
| Bangladesh | 2011 | 41.4 | 14 310.4 | 5 924.5 | 13 166.8 | 24.7 | 3 250.0 | 2 674.5 (45.1) |
| Burkina Faso | 2010 | 35.1 | 3 129.5 | 1 098.4 | 4 137.2 | 20.9 | 865.8 | 232.6 (21.2) |
| Cameroon | 2011 | 32.5 | 3 140.9 | 1 020.8 | 3 455.8 | 19.4 | 669.6 | 351.1 (34.4) |
| Chad | 2010 | 38.8 | 2 083.6 | 808.4 | 2 551.8 | 23.1 | 590.3 | 218.1 (27) |
| Côte d'Ivoire | 2007 | 39 | 3 024.9 | 1 179.7 | 3 532.8 | 23.3 | 821.5 | 358.3 (30.4) |
| Democratic Republic of the Congo | 2010 | 43.4 | 12 227.3 | 5 306.7 | 14 446.4 | 25.9 | 3 738.1 | 1 568.5 (29.6) |
| Egypt | 2008 | 30.7 | 9 151.0 | 2 809.4 | 8 798.0 | 18.3 | 1 610.4 | 1 199 (42.7) |
| Ethiopia | 2010–11 | 44.2 | 11 940.1 | 5 277.5 | 12 307.1 | 26.4 | 3 243.3 | 2 034.3 (38.5) |
| Ghana | 2008 | 28.6 | 3 631.6 | 1 038.6 | 4 009.0 | 17.1 | 683.6 | 355 (34.2) |
| Guatemala | 2008–09 | 48 | 2 225.6 | 1 068.3 | 2 631.1 | 28.6 | 753.0 | 315.3 (29.5) |
| India | 2005–06 | 47.9 | 128 556.7 | 61 578.6 | 122 197.4 | 28.6 | 34 898.1 | 26 680.6 (43.3) |
| Indonesia | 2010 | 39.2 | 21 013.8 | 8 237.4 | 18 815.5 | 23.4 | 4 397.5 | 3 839.9 (46.6) |
| Iraq | 2006 | 27.5 | 5 387.2 | 1 481.5 | 6 770.2 | 16.4 | 1 110.0 | 371.4 (25.1) |
| Kenya | 2008–09 | 35.2 | 6 967.1 | 2 452.4 | 8 369.6 | 21.0 | 1 756.5 | 695.9 (28.4) |
| Madagascar | 2008–09 | 49.2 | 3 449.6 | 1 697.2 | 4 467.2 | 29.3 | 1 310.4 | 386.8 (22.8) |
| Malawi | 2010 | 47.8 | 2 935.6 | 1 403.2 | 4 276.6 | 28.5 | 1 218.8 | 184.4 (13.1) |
| Mali | 2010 | 27.8 | 3 063.1 | 851.6 | 3 906.2 | 16.6 | 647.4 | 204.1 (24) |
| Mozambique | 2011 | 42.6 | 3 907.1 | 1 664.4 | 4 694.6 | 25.4 | 1 192.4 | 472 (28.4) |
| Myanmar | 2009–10 | 35.1 | 3 970.5 | 1 393.6 | 3 583.2 | 20.9 | 749.9 | 643.8 (46.2) |
| Nepal | 2011 | 40.5 | 3 442.0 | 1 394.0 | 3 485.5 | 24.1 | 841.6 | 552.4 (39.6) |
| Niger | 2006 | 54.8 | 3 296.4 | 1 806.5 | 4 833.8 | 32.7 | 1 579.3 | 227.1 (12.6) |
| Nigeria | 2008 | 41 | 27 805.4 | 11 400.2 | 35 130.0 | 24.4 | 8 587.5 | 2 812.7 (24.7) |
| Pakistan | 2011 | 43 | 22 295.7 | 9 587.1 | 21 803.1 | 25.6 | 5 589.7 | 3 997.4 (41.7) |
| Philippines | 2008 | 32.3 | 11 205.5 | 3 619.4 | 12 232.4 | 19.3 | 2 355.7 | 1 263.7 (34.9) |
| Rwanda | 2010–11 | 44.3 | 1 976.5 | 875.6 | 2 275.6 | 26.4 | 601.0 | 274.5 (31.4) |
| South Africa | 2008 | 23.9 | 4 964.7 | 1 186.6 | 4 631.7 | 14.2 | 660.0 | 526.6 (44.4) |
| Sudan | 2006 | 37.9 | 6 565.2 | 2 488.2 | 7 653.4 | 22.6 | 1 729.4 | 758.8 (30.5) |
| Uganda | 2011 | 33.7 | 6 795.5 | 2 290.1 | 8 769.9 | 20.1 | 1 762.1 | 528 (23.1) |
| United Republic of Tanzania | 2009–10 | 42.5 | 8 520.8 | 3 621.3 | 11 813.3 | 25.3 | 2 993.4 | 628 (17.3) |
| Vietnam | 2010–11 | 23.3 | 7 180.7 | 1 673.1 | 5 840.9 | 13.9 | 811.4 | 861.7 (51.5) |
| Yemen | 2003 | 57.7 | 4 295.8 | 2 478.7 | 5 182.5 | 34.4 | 1 782.9 | 695.8 (28.1) |
| Zambia | 2007 | 45.8 | 2 615.8 | 1 198.0 | 3 921.3 | 27.3 | 1 070.8 | 127.3 (10.6) |
*The 34 countries with latest national estimate ≥20% and population affected covering 90% of total stunted in 2010, listed in alphabetical order. †Baseline stunting rate refers to the latest national survey available at the World Health Organization Global Database on Child Growth and Malnutrition (http://www.who.int/nutgrowthdb/en/). ‡Source: United Nations, Department of Economic and Social Affairs, Population Division (2011). World Population Prospects: the 2010 Revision. CD‐ROM Edition. §Pt+n = Pt * (1‐AARR)n, where AARR = 3.9%, t = 2012 and n = 13 years.
An alternative and preferred approach follows a methodology similar to that used for setting the global target. The required country‐specific AARRs are calculated for the 34 high‐burden countries to individually meet the 40% reduction in numbers by 2025, with resulting values ranging from 2.3% to 6.8% (Table 3). A 5% ceiling is set (i.e. the AARR is capped at 5% whenever the required AARR is above that level) to avoid having to aim for unrealistically high reduction rates. Applying this approach to the 34 high‐burden group of countries, a reduction of about 59 million stunted children (a 38% relative reduction) is projected by 2025.
Table 3.
Average annual relative reduction rate (AARR) required to achieve the 40% reduction stunting target by 2025 applied to the 34 high‐burden countries
| High‐burden country* | Survey year | Baseline stunting rate † (%) | 2012 under 5‐year population ‡ (‘000s) | 2012 numbers of stunted children (‘000s) | 2025 under 5‐year population ‡ (‘000s) | Required AARR § (%) | Required AARRcapp ¶ (%) | 2025 projected stunting rate** (%) | 2025 projected numbers of stunted children †† (‘000s) | Reduction in numbers of stunted children †† (‘000s and %) |
|---|---|---|---|---|---|---|---|---|---|---|
| Afghanistan | 2004 | 59.3 | 5 816.8 | 3 449.4 | 7 214.2 | 5.4 | 5.0 | 30.4 | 2 196.1 | 1 253.3 (36.3) |
| Angola | 2007 | 29.2 | 3 433.1 | 1 002.5 | 4 021.1 | 5.0 | 5.0 | 15.0 | 602.7 | 399.7 (39.9) |
| Bangladesh | 2011 | 41.4 | 14 310.4 | 5 924.5 | 13 166.8 | 3.2 | 3.2 | 27.0 | 3 554.7 | 2 369.8 (40.0) |
| Burkina Faso | 2010 | 35.1 | 3 129.5 | 1 098.4 | 4 137.2 | 5.9 | 5.0 | 18.0 | 745.5 | 353 (32.1) |
| Cameroon | 2011 | 32.5 | 3 140.9 | 1 020.8 | 3 455.8 | 4.6 | 4.6 | 17.7 | 612.5 | 408.3 (40.0) |
| Chad | 2010 | 38.8 | 2 083.6 | 808.4 | 2 551.8 | 5.3 | 5.0 | 19.9 | 508.3 | 300.2 (37.1) |
| Côte d'Ivoire | 2007 | 39.0 | 3 024.9 | 1 179.7 | 3 532.8 | 5.0 | 5.0 | 20.0 | 707.8 | 471.9 (40.0) |
| Democratic Republic of the Congo | 2010 | 43.4 | 12 227.3 | 5 306.7 | 14 446.4 | 5.1 | 5.0 | 22.3 | 3 218.5 | 2 088.1 (39.3) |
| Egypt | 2008 | 30.7 | 9 151.0 | 2 809.4 | 8 798.0 | 3.6 | 3.6 | 19.2 | 1 685.6 | 1 123.7 (40.0) |
| Ethiopia | 2010–11 | 44.2 | 11 940.1 | 5 277.5 | 12 307.1 | 4.1 | 4.1 | 25.7 | 3 166.5 | 2 111 (40.0) |
| Ghana | 2008 | 28.6 | 3 631.6 | 1 038.6 | 4 009.0 | 4.6 | 4.6 | 15.5 | 623.2 | 415.5 (40.0) |
| Guatemala | 2008–09 | 48.0 | 2 225.6 | 1 068.3 | 2 631.1 | 5.1 | 5.0 | 24.6 | 648.3 | 420 (39.3) |
| India | 2005–06 | 47.9 | 128 556.7 | 61 578.6 | 122 197.4 | 3.5 | 3.5 | 30.2 | 36 947.2 | 24 631.5 (40.0) |
| Indonesia | 2010 | 39.2 | 21 013.8 | 8 237.4 | 18 815.5 | 3.0 | 3.0 | 26.3 | 4 942.5 | 3 295 (40.0) |
| Iraq | 2006 | 27.5 | 5 387.2 | 1 481.5 | 6 770.2 | 5.5 | 5.0 | 14.1 | 955.7 | 525.7 (35.5) |
| Kenya | 2008–09 | 35.2 | 6 967.1 | 2 452.4 | 8 369.6 | 5.2 | 5.0 | 18.1 | 1 512.4 | 940.1 (38.3) |
| Madagascar | 2008–09 | 49.2 | 3 449.6 | 1 697.2 | 4 467.2 | 5.7 | 5.0 | 25.3 | 1 128.2 | 568.9 (33.5) |
| Malawi | 2010 | 47.8 | 2 935.6 | 1 403.2 | 4 276.6 | 6.6 | 5.0 | 24.5 | 1 049.4 | 353.9 (25.2) |
| Mali | 2010 | 27.8 | 3 063.1 | 851.6 | 3 906.2 | 5.6 | 5.0 | 14.3 | 557.5 | 294.1 (34.5) |
| Mozambique | 2011 | 42.6 | 3 907.1 | 1 664.4 | 4 694.6 | 5.2 | 5.0 | 21.9 | 1 026.6 | 637.8 (38.3) |
| Myanmar | 2009–10 | 35.1 | 3 970.5 | 1 393.6 | 3 583.2 | 3.1 | 3.1 | 23.3 | 836.2 | 557.5 (40.0) |
| Nepal | 2011 | 40.5 | 3 442.0 | 1 394.0 | 3 485.5 | 3.9 | 3.9 | 24.0 | 836.4 | 557.6 (40.0) |
| Niger | 2006 | 54.8 | 3 296.4 | 1 806.5 | 4 833.8 | 6.6 | 5.0 | 28.1 | 1 359.8 | 446.6 (24.7) |
| Nigeria | 2008 | 41.0 | 27 805.4 | 11 400.2 | 35 130.0 | 5.6 | 5.0 | 21.0 | 7 393.8 | 4 006.4 (35.1) |
| Pakistan | 2011 | 43.0 | 22 295.7 | 9 587.1 | 21 803.1 | 3.7 | 3.7 | 26.4 | 5 752.3 | 3 834.9 (40.0) |
| Philippines | 2008 | 32.3 | 11 205.5 | 3 619.4 | 12 232.4 | 4.5 | 4.5 | 17.8 | 2 171.6 | 1 447.8 (40.0) |
| Rwanda | 2010–11 | 44.3 | 1 976.5 | 875.6 | 2 275.6 | 4.9 | 4.9 | 23.1 | 525.3 | 350.2 (40.0) |
| South Africa | 2008 | 23.9 | 4 964.7 | 1 186.6 | 4 631.7 | 3.3 | 3.3 | 15.4 | 711.9 | 474.6 (40.0) |
| Sudan | 2006 | 37.9 | 6 565.2 | 2 488.2 | 7 653.4 | 5.0 | 5.0 | 19.5 | 1 492.9 | 995.3 (40.0) |
| Uganda | 2011 | 33.7 | 6 795.5 | 2 290.1 | 8 769.9 | 5.7 | 5.0 | 17.3 | 1 517.2 | 772.9 (33.8) |
| United Republic of Tanzania | 2009–10 | 42.5 | 8 520.8 | 3 621.3 | 11 813.3 | 6.2 | 5.0 | 21.8 | 2 577.3 | 1 044 (28.8) |
| Vietnam | 2010–11 | 23.3 | 7 180.7 | 1 673.1 | 5 840.9 | 2.3 | 2.3 | 17.2 | 1 003.9 | 669.2 (40.0) |
| Yemen | 2003 | 57.7 | 4 295.8 | 2 478.7 | 5 182.5 | 5.2 | 5.0 | 29.6 | 1 535.1 | 943.6 (38.1) |
| Zambia | 2007 | 45.8 | 2 615.8 | 1 198.0 | 3 921.3 | 6.8 | 5.0 | 23.5 | 921.9 | 276.1 (23.0) |
*The 34 countries with latest national estimate ≥20% and population affected covering 90% of total stunted in 2010, listed in alphabetical order. †Baseline stunting rate refers to the latest national survey available at the World Health Organization Global Database on Child Growth and Malnutrition (http://www.who.int/nutgrowthdb/en/). ‡Source: United Nations, Department of Economic and Social Affairs, Population Division (2011). World Population Prospects: the 2010 Revision. CD‐ROM Edition. §AARR = 1– (Pt+n/Pt)(1/n), where t = 2012 and n = 13 years; ¶Capped using the ceiling of 5% whenever higher than that (AARRcapp); **Pt+n = Pt * (1‐AARRcapp)n; ††Derived based on AARRcapp.
Although the total reduction in numbers of stunted children from the two approaches is very similar, in the first approach the country‐specific relative reduction varies from 10.6% to 51.5% (Table 2), while in the second approach 16 countries achieve the 40% reduction target, 14 reach a reduction of 32–39.9%, and the remaining 4 countries 23–29% (Table 3).
The effort required to achieve the target is largely influenced by current trends in stunting and estimated population growth. For example, in Zambia, the under‐five population is forecast to increase from 2.6 to 3.9 million between 2012 and 2025, resulting in a required AARR of 6.8% to achieve the 40% reduction target. However, capping the AARR at 5%, the reduction in numbers of stunted children falls to only 23%. This is mainly due to the increase in the under‐five population over the 13‐year period (Table 3). On the other hand, India's under‐five population is forecast to decrease from 129 to 122 million between 2012 and 2025, resulting in a required AARR of 3.5% to achieve the target, which is below the global average of 3.9% (Table 3). However, India's current trend of stunting (based on six surveys conducted between 1989 and 2006) indicates a current AARR of 1.7%, which is largely insufficient to achieve the target. If the required AARR to reach the target (i.e. 3.5%) is met, the prevalence of stunting rate will decrease to about 30% compared to the latest estimate of 47.9% (national survey 2006), resulting in 10 million children prevented from being stunted. Nigeria's under‐five population, in turn, is estimated to increase from 28 to 35 million between 2012 and 2025 and the required AARR to achieve the target is 5.5% (Table 3). When this AARR is capped at 5%, and considering the current trend (AARR 0.8% between 1990 and 2008), the number of children that will be prevented from being stunted in Nigeria is presently estimated to be around 5.5 million by 2025.
These kinds of calculations are being carried out by the international community and global movements such as Scaling Up Nutrition (SUN; http://scalingupnutrition.org/) to assess potential scenarios, and the European Commission and WHO have jointly developed a tool (available on request) to help plan interventions to reduce stunting. It is important to be aware of the uncertainty inherent to these forecasting exercises. The aforementioned examples and the country‐specific data presented in Tables 2 and 3 will be affected by updates of stunting rates and under‐five population estimates. Nevertheless, the data presented provide a base to monitor progress towards meeting the stunting target.
Important to note, there are several countries with very high rates of stunting (i.e. above 40%) that are not considered high‐burden countries because of their small populations. For example, Benin had a stunting rate of 44.7% in 2006 and preliminary results from the 2012 survey report a 44.6% rate, indicating stagnation over the past 6 years. Likewise, Sierra Leone has an increasing trend of stunting (from 37.4% in 2008 to 44.9% in 2010) (http://www.who.int/nutgrowthdb). These countries should not be left out of global efforts.
What can be done to reduce stunting? Impact of nutrition interventions
It is widely recognised that the ‘window of opportunity’ for reducing stunting is the ∼1000 days from conception until 2 years of age (Victora et al. 2010; http://www.thousanddays.org). Assuring adequate maternal nutrition prior to conception is also likely to be important (Prentice et al. 2013; Bhutta et al. 2013a). In this section, we present an overview of the evidence regarding efficacy and effectiveness of prenatal and post‐natal nutrition interventions, and discuss the need for integrated/combined approaches.
Prenatal nutrition interventions
Stunting often begins in utero, although the proportion that occurs prior to vs. after birth is not well understood and will likely vary across populations. For example, in Malawi it is estimated that ∼20% of the 10‐cm deficit in height (compared to WHO Child Growth Standards) at 3 years of age is already present at birth (Dewey & Huffman 2009). This may be an underestimate of the influence of prenatal factors, however, as some of the stunting that occurs after birth may have been ‘programmed’ in utero (Martorell & Zongrone 2012). In a study in Indonesia (Schmidt et al. 2002), newborn length was a stronger determinant of height‐for‐age at 12 months than any other factor examined.
Numerous trials have examined the effect on birth outcomes of prenatal multiple micronutrient (MMN) supplementation, and results have been summarised in two recent meta‐analyses (Fall et al. 2009; Ramakrishnan et al. 2012). In the first meta‐analysis (Fall et al. 2009), while there was a small but significant increase in mean birthweight (+22 g), the difference in birth length (+0.06 cm) was not significant. Birth length is much more difficult to measure accurately than birthweight, which may affect the ability to detect significant effects of such interventions. Overall, there was an 11–17% reduction in the incidence of low birthweight (<2500 g). In that meta‐analysis, the positive effect of prenatal micronutrient supplementation was evident only in mothers with higher body mass index (BMI), not in underweight mothers. In the second meta‐analysis (Ramakrishnan et al. 2012), the increase in mean birthweight (+53 g) was also significant and somewhat greater than in the earlier meta‐analysis; data on birth length were not presented. There was a 14% reduction in low birthweight. In both meta‐analyses, the effect of MMN supplementation may have been underestimated because in most cases the control group received iron and folic acid tablets, which may also have had an impact on fetal growth (Imdad & Bhutta 2012a).
The long‐term effects of prenatal MMN supplementation on child height have rarely been evaluated. In Burkina Faso, Roberfroid et al. (2012) found a 27% reduction in post‐natal stunting following prenatal MMN supplementation; this effect was significant during infancy but no longer significant at 30 months of age. In China, Wang et al. (2012) reported no effect on stunting at 30 months of age of prenatal MMN vs. iron/folic acid. In rural Nepal (Stewart et al. 2009), there was no long‐term impact of prenatal MMN supplementation on child growth; but after adjusting for birth length, children of mothers who received iron + folic acid + zinc during pregnancy were found to be taller (+0.64 cm) and leaner at 6–8 years of age than children of mothers who received only vitamin A during pregnancy. It is unclear why these effects were not seen in the MMN group.
Balanced protein‐energy supplementation of pregnant women is another intervention strategy that has been evaluated in several populations. In a meta‐analysis published in 2003 (Kramer & Kakuma 2003), there was a significant effect on mean birthweight (+38 g) but not birth length (+0.1 cm). In an updated meta‐analysis in 2012 (Imdad & Bhutta 2012b), the increase in mean birthweight was somewhat larger (+73 g); data on birth length were not reported. There was a 32% reduction in low birthweight. In both of these meta‐analyses, in contrast to the situation with prenatal MMN supplementation, the effect of protein‐energy supplementation on birthweight was greater in undernourished women.
One of the studies included in the 2012 meta‐analysis (Imdad & Bhutta 2012b) was a trial comparing a fortified lipid‐based nutrient supplement (LNS) with MMN tablets, both given prenatally (n = 1296) (Huybregts et al. 2009). The LNS provided 373 kcal/day and similar micronutrients as contained in the MMN tablets. While the difference in birthweight between groups was not significant (+31 g, P = 0.2), birth length was significantly greater in the LNS group (+0.46 cm, P = 0.001). The same research group previously showed that MMN (vs. the control) increased birth length by 0.36 cm (Roberfroid et al. 2008); thus, the total predicted impact of LNS vs. control would be 0.46 + 0.36 = 0.82 cm. The effect on birth length of LNS vs. MMN was greater in higher risk mothers (those with BMI < 18.5 kg m–2 and those with anaemia at baseline).
The impact of nutrition education and counselling during pregnancy on birthweight and other pregnancy outcomes was recently evaluated (Girard & Olude 2012). In a meta‐analysis of 13 studies, there was an increase in mean birthweight (+105 g), but this was significant only when nutrition education/counselling was coupled with nutrition support in the form of food supplements, micronutrient supplements or nutrition safety net interventions. The authors did not report on birth length.
Post‐natal nutrition interventions
The post‐natal ‘window of opportunity’ can be divided into two key periods, 0–5.9 months, when exclusive breastfeeding is recommended, and 6–23.9 months, when interventions to improve complementary feeding are usually implemented.
Exclusive breastfeeding 0–6 months
There are many different and complementary approaches to increasing the rate of exclusive breastfeeding during the first 6 months post‐partum [e.g. implementation of the 10 steps to successful breastfeeding, professional support/counselling, peer support, mass media (UNICEF 2012)], so it is difficult to evaluate the impact of such interventions as a whole. In general, exclusive breastfeeding has a significant impact on infant morbidity and survival, but there is little evidence to date of an impact on stunting based on randomised trials to promote exclusive breastfeeding (Bhutta et al. 2008; Black et al. 2013). An impact on stunting is plausible given the high concentration of growth‐promoting substances in human milk. However, a significant effect may be difficult to detect unless the study population has a high rate of infection during the first 6 months post‐partum, when promotion of exclusive breastfeeding may reduce infection and thus be more likely to promote linear growth than in populations where such infections are less common. Some observational studies support this linkage (e.g. Engebretsen et al. 2008), but it is difficult to rule out reverse causation (i.e. that sicker infants are more likely to be supplemented with non‐breast milk fluids or foods). Thus, at present there is insufficient evidence to evaluate this question.
Complementary feeding interventions
Overall, complementary feeding interventions have strong potential for a major impact on stunting, but the evidence to date is mixed (Bhutta et al. 2013a). One important consideration is the need to avoid strategies that may inadvertently decrease breast milk intake, such as providing excessive amounts of complementary foods or recommending too frequent meals, both of which may reduce the child's intake of breast milk (Dewey & Adu‐Afarwuah 2008).
There are several approaches to improve complementary feeding (Dewey & Adu‐Afarwuah 2008). The impact of the major strategies is briefly summarised below.
Education about complementary feeding
Educational interventions to improve complementary feeding practices are often effective at changing behaviours, but their impact on stunting has been less impressive. Most of the educational interventions included in the systematic review conducted in 2008 showed either no impact or a modest effect on linear growth (Dewey & Adu‐Afarwuah 2008). An exception was a cluster‐randomised trial conducted in Peru, which had a substantial impact on stunting (Penny et al. 2005). That trial emphasised three key messages, one of which was consumption of nutrient‐rich animal‐source foods, and it was conducted in a population where animal‐source foods were available and affordable. Two studies published after 2008 (Shi et al. 2010; Vazir et al. 2013) also demonstrated the potential to reduce stunting via educational approaches, although in both cases the impact on linear growth was relatively small [effect size (difference due to intervention divided by standard deviation) ∼0.2]. These trials were conducted in China (Shi et al. 2010) and India (Vazir et al. 2013) and both emphasised key messages including dietary diversity and consumption of animal‐source foods.
Increased energy density of complementary foods
Interventions to increase the energy density of complementary foods have yielded mixed results. Of the five studies included in the systematic review (Dewey & Adu‐Afarwuah 2008), two had a positive impact on linear growth but three had no impact on energy intake or growth. Such approaches may be effective when the traditional complementary food has a low energy density and infants are unable to compensate by increasing the volume of food consumed or feeding frequency. Otherwise, they are not likely to affect growth.
Provision of complementary foods or a food product offering extra energy (with or without added micronutrients), alone or in combination with some other strategy such as education for caregivers
Provision of complementary food has had a positive impact on linear growth in some, but not all, studies (Dewey & Adu‐Afarwuah 2008). The average effect size has been modest (∼0.2–0.3), but there has been a wide range of impact, perhaps reflecting variations in the target populations’ food security and the nutrient quality of the food provided.
Two studies directly compared provision of food coupled with an educational intervention vs. education only (Bhandari et al. 2001; Roy et al. 2005). Both were conducted in South Asia, and in both cases there was a somewhat greater impact when the package included food.
Fortification of complementary foods
Fortification of complementary foods with micronutrients via central processing or home fortification strategies (such as micronutrient powders), without any additional macronutrients (energy, protein or fat), has generally not affected linear growth (Dewey & Adu‐Afarwuah 2008; CIGNIS Study Team 2010; Ouédraogo et al. 2010; De‐Regil et al. 2011). Similarly, strategies to increase bioavailability of key nutrients such as iron and zinc have generally failed to reduce stunting (Mamiro et al. 2004; Mazariegos et al. 2010).
One exception is a randomised trial conducted in India (Dhingra et al. 2004) where milk powder (fortified or unfortified) was given for 1 year to children whose average age was 23 months. The group given the fortified milk (n = 233) had significantly less morbidity and greater weight and height gain than the group given unfortified milk (n = 232). Subjects in this trial were more stunted at baseline than subjects in the other trials in this category, and the food vehicle for the extra nutrients (milk powder) did not contain ‘anti‐nutrients’ like phytic acid (common in grains in legumes) that can interfere with absorption of critical nutrients. These differences may have increased the likelihood of a positive growth response to a fortified product.
The need for integrated/combined approaches
Prenatal and post‐natal role of infection and subclinical conditions in stunting
It has long been recognised that infections can cause linear growth retardation. Recently, however, there has been great interest in the role of subclinical conditions that may inhibit growth. Subclinical conditions, such as environmental enteropathy, inflammation and other physiological responses to environmental insults (including mycotoxins and household air pollution), are likely to be far more common than clinically obvious infections and thus may account for a large proportion of stunting (Dewey & Mayers 2011; Khlangwiset et al. 2011; Smith et al. 2011, 2012; Prendergast & Kelly 2012). The mechanisms by which these conditions adversely affect linear growth – both in utero and postnatally – are the subject of active research. Meanwhile, strategies to prevent and manage infection, and to reduce exposure to the putative causative agents of subclinical conditions that impair growth, need to be part of an integrated approach to reducing stunting.
This is not to imply that nutritional interventions are ineffective in the face of infection or subclinical conditions – the evidence to date suggests otherwise (Dewey & Mayers 2011). For example, adequate nutrition can reduce the negative impact of infections on child growth through several mechanisms by:
strengthening the immune system, thereby reducing the severity and duration of infections,
providing extra amounts of nutrients to compensate for poor absorption during infection, losses during diarrhoea, reallocation due to immune system activation or reduced appetite during infection,
providing nutrients for catch‐up growth following infection, particularly those needed to build lean body tissue such as protein, potassium, magnesium, phosphorus, zinc and sodium,
preventing poor appetite caused by micronutrient deficiencies, thereby facilitating catch‐up growth, and
favouring the growth of beneficial bacteria in the gut that enhance gut function and immune defences.
Development and evaluation of integrated interventions
Integrated interventions that combine nutrition, infection control (including WASH), and care for mothers and children are likely to have a larger impact on stunting than any of these components alone. Such interventions should ideally tackle the entire ‘window of opportunity’, i.e. both the pre‐ and post‐natal periods, but that has not yet been attempted in efficacy or effectiveness trials.
A few large‐scale trials under way are attempting to combine nutrition and infection control. These include the WASH Benefits trial (water, sanitation and hygiene interventions: singly, combined or in combination with nutrition interventions, http://www.washbenefits.net/) in Bangladesh and Kenya and the Sanitation, Hygiene, Infant Nutrition Efficacy Project (SHINE) in Zimbabwe (independent and combined effects of improved water, sanitation and hygiene, and improved infant feeding, http://www.sdc.admin.ch/en/Home/Projects/Project_Detail?projectdbID=218331). However, both trials target mainly the post‐natal period.
There is a great need to investigate the impact on stunting of maternal infections and subclinical conditions during pregnancy. Some prenatal infection‐control studies have shown promising results. For example, in the Lungwena Antenatal Intervention Study conducted in Malawi (Luntamo et al. 2010, 2013), combined preventive antibiotic and enhanced malaria prophylaxis had a large impact on the incidence of preterm delivery, low birthweight and child stunting at 1 month of age. This is not to say that the specific pharmacological approach taken in that trial should be generalised to other settings, but the results imply that attention to maternal infection is critical if the goal is to reduce child stunting.
Integration of efforts to manage childhood illness has been recommended for quite some time (Tulloch 1999), and formally evaluated in several countries. In Bangladesh, the IMCI package was associated with a reduction in stunting (Arifeen et al. 2009), which was attributed to better case management of infections, increased frequency of complementary feeding and possibly improved dietary quality. In that study, the impact of IMCI's nutrition component may have been underestimated because the national nutrition program was delivered in both the study and control areas. Nonetheless, evaluation showed that there was a great need for improved delivery of the nutrition component. For example, the proportion of caregivers who reported receiving child feeding advice was low in both the IMCI (∼33%) and the control (∼20%) areas.
Integrated interventions that combine nutrition with care for mothers and children have great potential to reduce stunted growth and development, but few projects or programs have attempted this. Synergistic effects of stimulation on early child development, responsive feeding and caregiving, and nutrition interventions may occur, potentially resulting in a larger impact on growth and behavioural development than would be expected from the additive effects of single interventions (WHO 1999; Yousafzai et al. 2013). Responsive feeding is a key dimension of appropriate complementary feeding. It means that caregivers are sensitive and responsive to the child's cues of hunger and satiety (Black & Aboud 2011). Many caregivers require skilled support to create a stimulating environment for child growth and development. ‘Care for development’ interventions focus on communication and play to encourage responsive caregiving and interaction, not only for psychosocial development but also to improve feeding practices (WHO & UNICEF 2012). While in general the effect of combined interventions has been largest on behavioural development, several studies have also shown an impact on weight gain in malnourished children (Nahar et al. 2009, 2012). However, the evidence for prevention of stunting is limited. One study in Bogota, Colombia, showed that food supplementation (beginning prenatally and continuing for 36 months after birth) and home visitation to stimulate learning and development had additive effects on height at age 6 years, indicating a long‐term impact (Super et al. 1990). The evidence therefore calls for investment in care for development as an integral part of interventions to improve infant and young child nutrition, and warrants further research on how to optimise integration for the prevention of stunting.
Discussion and conclusions
Attained height is an accepted summary measure of children's nutritional well‐being and the success of interventions/programs aiming to improve maternal, infant and young child nutrition. Because the causes of stunting are embedded in a complex web of contextual and immediate influences (Stewart et al. 2013), its reduction requires multisectoral action (Casanovas et al. 2013). The key windows for reducing this legacy of intergenerational deprivation include the preconception, prenatal and post‐natal periods, with interventions targeted at women and their infants and young children.
The global target of 40% reduction in the number of stunted children by 2025 from a baseline of 171 million in 2010 remains unattainable at current rates of progress. At such rates, it is forecast that there will be 127 million stunted children in 2025, or a reduction of only 26%. Regional trends, however, indicate that Asia as a whole is likely to achieve or surpass the 40% reduction target (from 98 to 57 million between 2010 and 2025) while in Africa the number of stunted children will likely increase despite a slight reduction in prevalence. The different scenarios between the two regions are mainly due to projected population growth. At country level, the adaptation of the global target to national targets to guide action is based on a number of country‐specific characteristics, notably current levels and trends in stunting and population growth. This paper presents a methodology for estimating individual country contributions to achieving the global target – not precluding the use of others – that conceptually follows the one used for setting the global target. When applied to the 34 high‐burden countries, the individual country AARR required to meet the 40% reduction in numbers by 2025 varies from 2.3% to 6.8%. A 5% ceiling has been set to avoid having to aim for unrealistically high reduction rates. Following this approach, the total estimated reduction is about 59 million stunted children (or 38% relative reduction) by 2025 from the 34 countries combined, with 30 of the 34 countries achieving relative reductions of 32% or more.
An important limitation of the country‐specific examples is the inherent speculative nature of forecasts. The effort required to achieve the target is largely influenced by current stunting trends and estimated population growth. Thus, the data presented in this paper will be affected by updates of stunting rates and under‐five population estimates. Importantly, international efforts should not focus solely on high‐burden countries, but also include others that despite their small populations have very high stunting rates, and those, such as China, with a low prevalence but large actual numbers of stunted children (in 2010, 9% or 7.7 million under 5 stunted).
An essential question is what countries should do to reduce stunting in their populations and thereby contribute to meeting the global target. What inputs are required, and where and when should they be invested for highest returns? The broad spectrum of causal influences on stunting and their impact – through the mother as well as directly on the child – makes it extremely challenging to model expected returns from individual interventions to inform such decisions. Evidence from large‐scale, focused stunting reduction programs is scarce and decisions must therefore rely on what is biologically plausible and evidence from research trials. A detailed review of what can be done to address maternal and child malnutrition and at what cost was recently published (Bhutta et al. 2013a).
Nutrition interventions alone are almost certainly insufficient, hence the numerous efforts under way to foster nutrition‐sensitive development, including nutrition‐sensitive agriculture to improve household food security; maternal education and women's empowerment in support of their own health and their capacity to care for their children; improved hygiene, sanitation and water quality to reduce infections; and social protection programs to increase purchasing power and access to services and amenities (Ruel et al. 2013). The SUN Movement (http://scalingupnutrition.org/) and other initiatives are under way to address stunting across sectors by encouraging countries to develop evidence‐based, multisectoral scale‐up plans. These plans take into account what is required for a country to achieve the global target – combining direct nutrition interventions with evidence‐based strategies to address health, family planning, WASH and other elements which have an impact on stunting (http://scalingupnutrition.org).
Stunting reduction requires investments that should be an integral part of the post‐2015 development agenda (Hoddinott et al. 2013). Experience in Brazil and Mexico suggests that equity‐driven nutrition‐sensitive programs targeting the most vulnerable sub‐populations achieve the greatest reduction in national average stunting prevalence, in addition to closing the gap between the wealthier and poorer segments of the population. Success in these countries has been linked to increased maternal education and purchasing power of low‐income families, as well as expanded public water supplies and sewage systems, universal access to basic health care (including prenatal care) and increased access to and utilisation of health care facilities (Sepúlveda et al. 2006; Fernald et al. 2008; Monteiro et al. 2010; Victora et al. 2011).
The windows of action mentioned above form part of the continuum of care in a life cycle approach to care. Preconception interventions should include strategies encouraging girls to remain in school as long as possible, thus increasing maternal education levels, raising age at marriage and childbearing, and reducing total fertility. The impact of population size on stunting reduction has been illustrated by the computation showing that reducing birth rates would contribute to achieving the targets; and the positive impact that birth spacing has shown to have on overall maternal health, which in turn leads to improved child health (Dewey & Cohen 2007).
Although the literature reviewed for this paper provides scant and mixed evidence regarding the long‐term impact of prenatal maternal nutrient or food supplementation on offspring length/height (Khan et al. 2011; Prawirohartono et al. 2011; Roberfroid et al. 2012), overall birth outcomes were positive for women at risk (Kusin et al. 1992; Ceesay et al. 1997). Early initiation of breastfeeding and exclusive breastfeeding from 0 to 6 months are critical for child survival and the prevention of infections (Bhutta et al. 2013b). Complementary feeding at 6–23 months is recognised as the weakest link among the infant and young child feeding interventions for healthy growth. Unlike breastfeeding, appropriate complementary feeding encompasses a wide array of practices and dietary choices (PAHO/WHO 2003; WHO 2005). The systematic review of the efficacy and effectiveness of complementary feeding interventions in developing countries showed that effects on growth outcomes were usually positive but modest, ranging between 0.2 and 0.5 SD improvements in height‐for‐age (Dewey & Adu‐Afarwuah 2008).
As implied by the results of the prenatal MMN interventions, an adequate supply of macronutrients (energy, protein, fat) may be needed throughout the ‘window of opportunity’ to ensure a growth response to micronutrients. Essential fatty acids may play a key role in growth, but this aspect of dietary quality is often ignored (Vitta & Dewey 2012). In addition, attention should be paid to the amount and bioavailability of the micronutrients that are essential for growth, including ‘neglected’ type II nutrients such as phosphorus, potassium and magnesium. Nutrient quality of fortified products is likely to be important. For example, inhibitors of zinc absorption (e.g. phytate in cereal‐legume blends) may limit growth while inclusion of milk appears to have a growth‐stimulating effect. Innovative approaches to filling nutrient gaps in complementary food diets – such as greater use of novel and underused nutrient‐rich local foods (Kuyper et al. 2013) and home fortification with LNSs or micronutrient powders – are the subject of continuing research on how to improve child nutrition sustainably and affordably (Phuka et al. 2009; Burlingame & Dernini 2011; LaGrone et al. 2012; Suchdev et al. 2012; http://www.foodsecurity.gov.kh/node/611). Efficacious interventions with promise of sustainability should be proposed to governments for adoption and application at scale.
Nutrition interventions accompanied by control of infections, both pre‐ and postnatally, are likely to be needed to counter the characteristic decline in length‐for‐age from birth to 23 months in many developing countries (Victora et al. 2010). To date, however, there is little evidence on the impact of combined pre‐ and post‐natal nutrition and infection control interventions. Similarly, there is scant evidence of the combined influence of improved early nutrition and interventions to stimulate child development. It is clear, however, that the way forward is to integrate nutrition interventions within a comprehensive approach to reduction of stunting.
Although there are examples of community interventions with a positive impact on reducing stunting (Penny et al. 2005; Ruel et al. 2008), there are few documented examples of successful programs at scale. This is in part due to lack of systematic process‐and‐impact evaluations on pilot projects that might generate lessons to inform program planning for long‐term effectiveness (Lutter et al. 2013). Evaluation should not be limited to outcomes alone. Suitable indicators should be identified to monitor the implementation process itself for quality, access to interventions by target groups and geographical coverage of the programme. The setting of national stunting reduction goals will require countries to conduct situation analyses and mapping to establish baselines of the extent and social/geographic distribution of stunting in their populations. This will permit a realistic assessment of how much and what types of resources are needed to tackle the problem. Systems should then be put in place to screen for stunting and monitor progress, following systematic planning, implementation, and evaluation to enhance effectiveness over the long term (Lutter et al. 2013). Indeed, stunting was included among the indicators of the Comprehensive Implementation Plan (2012–2025) on Maternal, Infant and Young Child Nutrition because it is amenable to such monitoring.
Surveillance systems in most developing countries are weak or non‐existent, so unless they are established or strengthened it will be difficult to monitor progress towards achieving the global goal. Data collection, analysis and interpretation will need to be aligned with decision‐making structures so that real‐time data feed into decision‐making for resource mobilisation, allocation and reallocation, capacity strengthening, and interventions to address emerging risks and problems. Once the baseline stunting distribution has been mapped, special consideration should be given to the most disadvantaged groups where large numbers of stunted children cluster. Such an equity‐inspired approach is both an ethical imperative and a judicious investment strategy.
Source of funding
None.
Conflicts of interest
The authors do not have any conflicts of interest to declare.
Contributions
All authors contributed to the conceptualisation of the analyses, and to the preparation and final editing of the manuscript.
Disclaimer
MdO, EB,AO, MB, BD and FB are staff members of the World Health Organization. The authors alone are responsible for the views expressed in this publication and they do not necessarily represent the decisions, policy or views of the World Health Organization.
The World Health Organization retains copyright and all other rights in the manuscript of this article as submitted for publication.
References
- Arifeen S.E., Hoque D.M., Akter T., Rahman M., Hoque M.E., Begum K. et al (2009) Effect of the integrated management of childhood illness strategy on childhood mortality and nutrition in a rural area in Bangladesh: a cluster randomised trial. Lancet 374, 393–403. [DOI] [PubMed] [Google Scholar]
- Bartlett A. (1993) The arithmetic of growth: methods of calculation. Population and Environment: A Journal of Interdisciplinary Studies 14, 359–386. [Google Scholar]
- Bhandari N., Bahl R., Nayyar B., Khokhar P., Rohde J.E. & Bhan M.K. (2001) Food supplementation with encouragement to feed it to infants from 4 to 12 months of age has a small impact on weight gain. The Journal of Nutrition 131, 1946–1951. [DOI] [PubMed] [Google Scholar]
- Bhutta Z.A., Ahmed T., Black R.E., Cousens S., Dewey K., Giugliani E. et al, for the Maternal & Child Undernutrition Study Group (2008) What works? Interventions for maternal and child undernutrition and survival. Lancet 371, 417–440. [DOI] [PubMed] [Google Scholar]
- Bhutta Z.A., Das J.K., Rizvi A., Gaffey M.F., Walker N., Horton S. et al, for The Lancet Nutrition Interventions Review Group, and the Maternal and Child Nutrition Study Group (2013a) Evidence‐based interventions for improvement of maternal and child nutrition: what can be done and at what cost? Lancet. Published online June 6. Available at: http://dx.doi.org/ 10.1016/S0140-6736(13)60996-4 (Accessed 29 July 2013). [DOI] [Google Scholar]
- Bhutta Z.A., Das J.K., Walker N., Rizvi A., Campbell H., Rudan I. et al, for the Lancet Diarrhoea and Pneumonia Interventions Study Group (2013b) Interventions to address deaths from childhood pneumonia and diarrhoea equitably: what works and at what cost? Lancet 381, 1417–1429. [DOI] [PubMed] [Google Scholar]
- Black M.M. & Aboud F.E. (2011) Responsive feeding is embedded in a theoretical framework of responsive parenting. The Journal of Nutrition 141, 490–494. [DOI] [PMC free article] [PubMed] [Google Scholar]
- Black R.E., Victora C.G., Walker S.P., Bhutta Z.A., Christian P., de Onis M. et al, and the Maternal and Child Nutrition Study Group (2013) Maternal and child undernutrition and overweight in low‐income and middle‐income countries. Lancet. Published online June 6. Available at: http://dx.doi.org/ 10.1016/S0140-6736(13)60937-X (Accessed 29 July 2013). [DOI] [PubMed] [Google Scholar]
- Burlingame B. & Dernini S. (2011) Sustainable diets: the Mediterranean diet as an example. Public Health Nutrition 14, 2285–2287. [DOI] [PubMed] [Google Scholar]
- Casanovas M.C., Lutter C., Mangasaryan N., Mwadime R., Hajeebhoy N., Aguilar A.M. et al (2013) Multisectoral interventions for healthy growth. Maternal & Child Nutrition 9 (Suppl. 2), 46–57. [DOI] [PMC free article] [PubMed] [Google Scholar]
- Ceesay S.M., Prentice A.M., Cole T.J., Foord F., Weaver L.T., Poskitt E.M. et al (1997) Effects on birth weight and perinatal mortality of maternal dietary supplements in rural Gambia: 5 year randomised controlled trial. British Medical Journal 315, 786–790. [DOI] [PMC free article] [PubMed] [Google Scholar]
- Chilenje Infant Growth, Nutrition and Infection (CIGNIS) Study Team (2010) Micronutrient fortification to improve growth and health of maternally HIV‐unexposed and exposed Zambian infants: a randomised controlled trial. PLoS ONE 5, e11165. [DOI] [PMC free article] [PubMed] [Google Scholar]
- De‐Regil L.M., Suchdev P.S., Vist G.E., Walleser S. & Peña‐Rosas J.P. (2011) Home fortification of foods with multiple micronutrient powders for health and nutrition in children under 2 years of age. Cochrane Database of Systematic Reviews (9), CD008959. [DOI] [PubMed] [Google Scholar]
- Dewey K.G. & Adu‐Afarwuah S. (2008) Systematic review of the efficacy and effectiveness of complementary feeding interventions in developing countries. Maternal & Child Nutrition 4, 24–85. [DOI] [PMC free article] [PubMed] [Google Scholar]
- Dewey K.G. & Cohen R.J. (2007) Does birth spacing affect maternal or child nutritional status? A systematic literature review. Maternal & Child Nutrition 3, 151–173. [DOI] [PMC free article] [PubMed] [Google Scholar]
- Dewey K.G. & Huffman S.L. (2009) Maternal, infant, and young child nutrition: combining efforts to maximize impacts on child growth and micronutrient status. Food and Nutrition Bulletin 30, S187–S189. [DOI] [PubMed] [Google Scholar]
- Dewey K.G. & Mayers D.R. (2011) Early child growth: how do nutrition and infection interact? Maternal & Child Nutrition 7 (Suppl. 3), 129–142. [DOI] [PMC free article] [PubMed] [Google Scholar]
- Dhingra P., Menon V.P., Sazawal S., Dhingra U., Marwah D. & Sarkar A. (2004) Effect of fortification of milk with zinc and iron along with vitamins C, E, A and selenium on growth, iron status and development in preschool children. A community‐based double‐masked randomized trial . Report from the 2nd World Congress of Pediatric Gastroenterology, Hepatology and Nutrition: Paris, France.
- Engebretsen I.M., Tylleskär T., Wamani H., Karamagi C. & Tumwine J.K. (2008) Determinants of infant growth inEastern Uganda: a community‐based cross‐sectional study. BMC Public Health 22, 8–418. [DOI] [PMC free article] [PubMed] [Google Scholar]
- Fall C.H., Fisher D.J., Osmond C., Margetts B.M. & Maternal Micronutrient Supplementation Study Group (2009) Multiple micronutrient supplementation during pregnancy in low‐income countries: a meta‐analysis of effects on birth size and length of gestation. Food and Nutrition Bulletin 30 (Suppl. 4), S533–S546. [DOI] [PMC free article] [PubMed] [Google Scholar]
- Fernald L.C., Gertler P.J. & Neufeld L.M. (2008) Role of cash in conditional cash transfer programmes for child health, growth, and development: an analysis of Mexico's Oportunidades. Lancet 371, 828–837. [DOI] [PMC free article] [PubMed] [Google Scholar]
- Girard A.W. & Olude O. (2012) Nutrition education and counselling provided during pregnancy: effects on maternal, neonatal and child health outcomes. Paediatric and Perinatal Epidemiology 26 (Suppl. 1), 191–204. [DOI] [PubMed] [Google Scholar]
- Hoddinott J., Alderman H., Behrman J.R., Haddad L. & Horton S. (2013) The economic rationale for investing in stunting reduction. Maternal & Child Nutrition 9 (Suppl. 2), 69–82. [DOI] [PMC free article] [PubMed] [Google Scholar]
- Huybregts L., Roberfroid D., Lanou H., Menten J., Meda N., Van Camp J. et al (2009) Prenatal food supplementation fortified with multiple micronutrients increases birth length: a randomized controlled trial in rural Burkina Faso. The American Journal of Clinical Nutrition 90, 1593–1560. [DOI] [PubMed] [Google Scholar]
- Imdad A. & Bhutta Z.A. (2012a) Routine iron/folate supplementation during pregnancy: effect on maternal anaemia and birth outcomes. Paediatric & Perinatal Epidemiology 26, 168–177. [DOI] [PubMed] [Google Scholar]
- Imdad A. & Bhutta Z.A. (2012b) Maternal nutrition and birth outcomes: effect of balanced protein‐energy supplementation. Paediatric and Perinatal Epidemiology 26, 178–190. [DOI] [PubMed] [Google Scholar]
- Khan A.I., Kabir I., Ekström E.C., Åsling‐Monemi K., Alam D.S., Frongillo E.A. et al (2011) Effects of prenatal food and micronutrient supplementation on child growth from birth to 54 months of age: a randomized trial in Bangladesh. Nutrition Journal 10, 134. [DOI] [PMC free article] [PubMed] [Google Scholar]
- Khlangwiset P., Shephard G.S. & Wu F. (2011) Aflatoxins and growth impairment: a review. Critical Reviews in Toxicology 41, 740–755. [DOI] [PubMed] [Google Scholar]
- Kramer M.S. & Kakuma A. (2003) Energy and protein intake in pregnancy. Cochrane Database of Systematic Reviews (4), CD000032. [DOI] [PubMed] [Google Scholar]
- Kusin J.A., Kardjati S., Houtkooper J.M. & Renqvist U.H. (1992) Energy supplementation during pregnancy and postnatal growth. Lancet 340, 623–626. [DOI] [PubMed] [Google Scholar]
- Kuyper E., Vitta B. & Dewey K.G. (2013) Novel and underused food sources of key nutrients for complementary feeding. Alive & Thrive Technical Brief, Issue 6. Available at: http://www.aliveandthrive.org/resource/insight-novel-and-underused-food-sournces-key%20-nutrients-complementary-feeding (Accessed 29 July 2013).
- LaGrone L.N., Trehan I., Meuli G.J., Wang R.J., Thakwalakwa C., Maleta K. et al (2012) A novel fortified blended flour, corn‐soy blend ‘plus‐plus,’ is not inferior to lipid‐based ready‐to‐use supplementary foods for the treatment of moderate acute malnutrition in Malawian children. The American Journal of Clinical Nutrition 95, 212–219. [DOI] [PMC free article] [PubMed] [Google Scholar]
- Lima A.L., Silva A.C., Konno S.C., Conde W.L., D'Aquino Benicio M.H. & Monteiro C.A. (2010) Causes of the accelerated decline in child undernutrition in Northeastern Brazil (1986–1996–2006). Revista de Saude Publica 44, 17–27. [DOI] [PubMed] [Google Scholar]
- Luntamo M., Kulmala T., Mbewe B., Cheung Y.B., Maleta K. & Ashorn P. (2010) Effect of repeated treatment of pregnant women with sulfadoxine‐pyrimethamine and azithromycin on preterm delivery in Malawi: a randomized controlled trial. The American Journal of Tropical Medicine and Hygiene 83, 1212–1220. [DOI] [PMC free article] [PubMed] [Google Scholar]
- Luntamo M., Kulmala T., Cheung Y.B., Maleta K. & Ashorn P. (2013) The effect of antenatal monthly sulfadoxine‐pyrimethamine, alone or with azithromycin, on foetal and neonatal growth faltering in Malawi: a randomised controlled trial. Tropical Medicine and International Health 18, 386–397. [DOI] [PubMed] [Google Scholar]
- Lutter C., Iannotti L., Daelmans B., Robert R., Creed‐Kanashiro H., Haider R. et al (2013) Key principles to improve programmes and interventions in complementary feeding. Maternal & Child Nutrition 9 (Suppl. 2), 101–115. [DOI] [PMC free article] [PubMed] [Google Scholar]
- Mamiro P.S., Kolsteren P.W., van Camp J.H., Roberfroid D.A., Tatala S. & Opsomer A.S. (2004) Processed complementary food does not improve growth or hemoglobin status of rural Tanzanian infants from 6–12 months of age in Kilosa district, Tanzania. The Journal of Nutrition 134, 1084–1090. [DOI] [PubMed] [Google Scholar]
- Martorell R. & Zongrone A. (2012) Intergenerational influences on child growth and undernutrition. Paediatric & Perinatal Epidemiology 26, 302–314. [DOI] [PubMed] [Google Scholar]
- Mazariegos M., Hambidge K.M., Westcott J.E., Solomons N.W., Raboy V., Das A. et al (2010) Neither a zinc supplement nor phytate‐reduced maize nor their combination enhance growth of 6‐ to 12‐month‐old Guatemalan infants. The Journal of Nutrition 140, 1041–1048. [DOI] [PMC free article] [PubMed] [Google Scholar]
- Monteiro C.A., Benicio M.H., Konno S.C., Silva A.C., Lima A.L. & Conde W.L. (2009) Causes for the decline in child under‐nutrition in Brazil, 1996–2007. Revista de Saude Publica 43, 35–43. [DOI] [PubMed] [Google Scholar]
- Monteiro C.A., Benicio M.H., Conde W.L., Konno S., Lovadino A.L., Barros A.J. et al (2010) Narrowing socioeconomic inequality in child stunting: the Brazilian experience, 1974–2007. Bulletin of the World Health Organization 88, 305–311. [DOI] [PMC free article] [PubMed] [Google Scholar]
- Nahar B., Hamadani J.D., Ahmed T., Tofail F., Rahman A., Huda S.N. et al (2009) Effects of psychosocial stimulation on growth and development of severely malnourished children in a nutrition unit in Bangladesh. European Journal of Clinical Nutrition 63, 725–731. [DOI] [PubMed] [Google Scholar]
- Nahar B., Hossain M.I., Hamadani J.D., Ahmed T., Huda S.N., Grantham‐McGregor S.M. et al (2012) Effects of a community‐based approach for food and psychosocial stimulation on growth and development of severely malnourished children in Bangladesh: a randomized trial. European Journal of Clinical Nutrition 66, 701–709. [DOI] [PubMed] [Google Scholar]
- de Onis M. & Blössner M. (2003) World Health Organization Global Database on Child Growth and Malnutrition: methodology and applications. International Journal of Epidemiology 32, 518–526. [DOI] [PubMed] [Google Scholar]
- de Onis M., Blössner M., Borghi E., Morris R. & Frongillo E.A. (2004) Methodology for estimating regional and global trends of child malnutrition. International Journal of Epidemiology 33, 1260–1270. [DOI] [PubMed] [Google Scholar]
- de Onis M., Blössner M. & Borghi E. (2011) Prevalence and trends of stunting among preschool children, 1990–2020. Public Health Nutrition 15, 142–148. [DOI] [PubMed] [Google Scholar]
- de Onis M., Onyango A., Borghi E., Siyam A., Blössner M., Lutter C.K., for the WHO Multicentre Growth Reference Study Group (2012) Worldwide implementation of the WHO Child Growth Standards. Public Health Nutrition 15, 1603–1610. [DOI] [PubMed] [Google Scholar]
- Ouédraogo H.Z., Traoré T., Zèba A.N., Dramaix‐Wilmet M., Hennart P. & Donnen P. (2010) Effect of an improved local ingredient‐based complementary food fortified or not with iron and selected multiple micronutrients on Hb concentration. Public Health Nutrition 13, 1923–1930. [DOI] [PubMed] [Google Scholar]
- PAHO/WHO (2003) Guiding Principles for Complementary Feeding of the Breastfed Child. Pan American Health Organization; World Health Organization: Washington, DC. [Google Scholar]
- Penny M.E., Creed‐Kanashiro H.M., Robert R.C., Narro M.R., Caulfield L.E. & Black R.E. (2005) Effectiveness of an educational intervention delivered through the health services to improve nutrition in young children: a cluster‐randomised controlled trial. Lancet 365, 1863–1872. [DOI] [PubMed] [Google Scholar]
- Phuka J.C., Maleta K., Thakwalakwa C., Cheung Y.B., Briend A., Manary M.J. et al (2009) Postintervention growth of Malawian children who received 12‐mo dietary complementation with a lipid‐based nutrient supplement or maize‐soy flour. The American Journal of Clinical Nutrition 89, 382–390. [DOI] [PubMed] [Google Scholar]
- Prawirohartono E.P., Nyström L., Ivarsson A., Stenlund H. & Lind T. (2011) The impact of prenatal vitamin A and zinc supplementation on growth of children up to 2 years of age in rural Java, Indonesia. Public Health Nutrition 14, 2197–2206. [DOI] [PubMed] [Google Scholar]
- Prendergast A. & Kelly P. (2012) Enteropathies in the developing world: neglected effects on global health. The American Journal of Tropical Medicine and Hygiene 86, 756–763. [DOI] [PMC free article] [PubMed] [Google Scholar]
- Prentice A.M., Ward K.A., Goldberg G.R., Jarjou L.M., Moore S.E., Fulford A.J. et al (2013) Critical windows for nutritional interventions against stunting. The American Journal of Clinical Nutrition 97, 911–918. [DOI] [PMC free article] [PubMed] [Google Scholar]
- Ramakrishnan U., Grant F.K., Goldenberg T., Bui V., Imdad A. & Bhutta Z.A. (2012) Effect of multiple micronutrient supplementation on pregnancy and infant outcomes: a systematic review. Paediatric and Perinatal Epidemiology 26, 153–167. [DOI] [PubMed] [Google Scholar]
- Rivera J.A. (2009) Improving nutrition in Mexico: the use of research for decision making. Nutrition Reviews 67 (Suppl. 1), S62–S65. [DOI] [PubMed] [Google Scholar]
- Rivera J.A., Irizarry L.M. & González‐De Cossío T. (2009) Overview of the nutritional status of the Mexican population in the last two decades. Salud Pública de México 51 (Suppl. 4), S645–S656. [DOI] [PubMed] [Google Scholar]
- Roberfroid D., Huybregts L., Lanou H., Henry M.C., Meda N., Menten J. et al, for the MISAME Study Group (2008) Effects of maternal multiple micronutrient supplementation on fetal growth: a double‐blind randomized controlled trial in rural Burkina Faso. The American Journal of Clinical Nutrition 88, 1330–1340. [DOI] [PubMed] [Google Scholar]
- Roberfroid D., Huybregts L., Lanou H., Ouedraogo L., Henry M.C., Meda N. et al, for the MISAME Study Group (2012) Impact of prenatal multiple micronutrients on survival and growth during infancy: a randomized controlled trial. The American Journal of Clinical Nutrition 95, 916–924. [DOI] [PubMed] [Google Scholar]
- Roy S.K., Fuchs G.J., Mahmud Z., Ara G., Islam S., Shafique S. et al (2005) Intensive nutrition education with or without supplementary feeding improves the nutritional status of moderately‐malnourished children in Bangladesh. Journal of Health, Population and Nutrition 23, 320–330. [PubMed] [Google Scholar]
- Ruel M.T., Menon P., Habicht J.P., Loechl C., Bergeron G., Pelto G. et al (2008) Age‐based preventive targeting of food assistance and behaviour change and communication for reduction of childhood undernutrition in Haiti: a cluster randomised trial. Lancet. 371, 588–595. [DOI] [PubMed] [Google Scholar]
- Ruel M.T., Alderman H. & the Maternal and Child Nutrition Study Group (2013) Nutrition‐sensitive interventions and programmes: how can they help to accelerate progress in improving maternal and child nutrition? Lancet Maternal Child and Nutrition Series. Published online June 6. Available at: http://www.sciencedirect.com/science/article/pii/S0140673613608430 (Accessed 29 July 2013). [DOI] [PubMed] [Google Scholar]
- Schmidt M.K., Muslimatun S., West C.E., Schultink W., Gross R. & Hautvast J.G. (2002) Nutritional status and linear growth of Indonesian infants in West Java are determined more by prenatal environment than by postnatal factors. The Journal of Nutrition 132, 2202–2207. [DOI] [PubMed] [Google Scholar]
- Sepúlveda J., Bustreo F., Tapia R., Rivera J., Lozano R., Oláiz G. et al (2006) Improvement of child survival in Mexico: the diagonal approach. Lancet 368, 2017–2027. [DOI] [PubMed] [Google Scholar]
- Shi L., Zhang J., Wang Y., Caulfield L.E. & Guyer B. (2010) Effectiveness of an educational intervention on complementary feeding practices and growth in rural China: a cluster randomised controlled trial. Public Health Nutrition 13, 556–565. [DOI] [PubMed] [Google Scholar]
- Smith K.R., McCracken J.P., Weber M.W., Hubbard A., Jenny A., Thompson L.M. et al (2011) Effect of reduction in household air pollution on childhood pneumonia in Guatemala (RESPIRE): a randomised controlled trial. Lancet 378, 1717–1726. [DOI] [PubMed] [Google Scholar]
- Smith L.E., Stoltzfus R.J. & Prendergast A. (2012) Food chain mycotoxin exposure, gut health, and impaired growth: a conceptual framework. Advances in Nutrition (Bethesda, Md.) 3, 526–531. [DOI] [PMC free article] [PubMed] [Google Scholar]
- Stewart C.P., Christian P., Le Clerq S.C., West K.P. Jr & Khatry S.K. (2009) Antenatal supplementation with folic acid + iron + zinc improves linear growth and reduces peripheral adiposity in school‐age children in rural Nepal. The American Journal of Clinical Nutrition 90, 132–140. [DOI] [PMC free article] [PubMed] [Google Scholar]
- Stewart C.P., Iannotti L., Dewey K.G., Michaelsen K.F. & Onyango A.W. (2013) Contextualizing complementary feeding in a broader framework for stunting prevention. Maternal & Child Nutrition 9 (Suppl. 2), 27–45. [DOI] [PMC free article] [PubMed] [Google Scholar]
- Suchdev P.S., Ruth L.J., Woodruff B.A., Mbakaya C., Mandava U., Flores‐Ayala R. et al (2012) Selling Sprinkles micronutrient powder reduces anemia, iron deficiency, and vitamin A deficiency in young children in Western Kenya: a cluster‐randomized controlled trial. The American Journal of Clinical Nutrition 95, 1223–1230. [DOI] [PMC free article] [PubMed] [Google Scholar]
- Super C.M., Herrera M.A. & Mora J.O. (1990) Long term effects of food supplementation and psychosocial interventions on the physical growth of Colombian infants at risk of malnutrition. Child Development 61, 29–49. [PubMed] [Google Scholar]
- Tulloch J. (1999) Integrated approach to child health in developing countries. Lancet 354 (Suppl. 2), S1116–S1120. [DOI] [PubMed] [Google Scholar]
- UNICEF Division of Policy and Practice, Statistics and Monitoring Section (2007) Technical Note: How to calculate Average Annual Rate of Reduction (AARR) of Underweight Prevalence . UNICEF: New York. Available at: http://www.childinfo.org/files/Technical_Note_AARR.pdf (Accessed 29 July 2013).
- UNICEF (2012) UNICEF Programming Guide – Infant and Young Child Feeding . Available at: http://www.unicef.org/nutrition/files/Final_IYCF_programming_guide_June_2012.pdf (Accessed 29 July 2013).
- United Nations Children's Fund, World Health Organization & The World Bank (2012) UNICEF‐WHO‐World Bank Joint Child Malnutrition Estimates . UNICEF, New York; WHO, Geneva; The World Bank, Washington, DC. Available at: http://www.who.int/nutrition/en/ (Accessed 29 July 2013).
- United Nations, Department of Economic and Social Affairs, Population Division (2011) World Population Prospects: the 2010 Revision . CD‐ROM Edition.
- United Nations, Department of Economic and Social Affairs, UN Population Division (2009) World Population Prospect: The 2008 Revision. United Nations: New York. [Google Scholar]
- Vazir S., Engle P., Balakrishna N., Griffiths P.L., Johnson S.L., Creed‐Kanashiro H. et al (2013) Cluster‐randomized trial on complementary and responsive feeding education to caregivers found improved dietary intake, growth and development among rural Indian toddlers. Maternal & Child Nutrition 9, 99–117. [DOI] [PMC free article] [PubMed] [Google Scholar]
- Victora C.G., Adair L., Fall C., Hallal P.C., Martorell R., Richter L. et al, for the Maternal & Child Undernutrition Study Group (2008) Maternal and child undernutrition: consequences for adult health and human capital. Lancet 371, 340–357. [DOI] [PMC free article] [PubMed] [Google Scholar]
- Victora C.G., de Onis M., Hallal P.C., Blössner M. & Shrimpton R. (2010) Worldwide 3 timing of growth faltering: revisiting implications for interventions. Pediatrics 125, e473–e480. [DOI] [PubMed] [Google Scholar]
- Victora C.G., Aquino E.M., do Carmo Leal M., Monteiro C.A., Barros F.C. & Szwarcwald C.L. (2011) Maternal and child health in Brazil: progress and challenges. Lancet 377, 1863–1876. [DOI] [PubMed] [Google Scholar]
- Vitta B. & Dewey K. (2012) Essential fats for mothers and infants: another dimension of dietary quality. Alive & Thrive Technical Brief, Issue 5. Available at http://www.aliveandthrive.org/resource/insight-issue-5-essential-fats-mothers-and-infants-another-dimension-dietary-quality (Accessed 29 July 2013).
- Wang W., Yan H., Zeng L., Cheng Y., Wang D. & Li Q. (2012) No effect of maternal micronutrient supplementation on early childhood growth in rural western China: 30 month follow‐up evaluation of a double blind, cluster randomized controlled trial. European Journal of Clinical Nutrition 66, 261–268. [DOI] [PubMed] [Google Scholar]
- WHO (1999) A Critical Link: Interventions for Physical Growth and Psychological Development. A Review. World Health Organization: Geneva. [Google Scholar]
- WHO (2005) Guiding Principles for Feeding of Non‐Breastfed Children 6‐24 Months of Age. World Health Organization: Geneva. [Google Scholar]
- WHO (2010) Countdown to 2015 Decade Report (2000–2010): Taking Stock of Maternal, Newborn and Child Survival. World Health Organization: Geneva. [DOI] [PubMed] [Google Scholar]
- WHO (2011) Keeping Promises, Measuring Results: Commission on Information and Accountability for Women's and Children's Health. World Health Organization: Geneva. [Google Scholar]
- WHO (2012) Resolution WHA65.6. Maternal, infant and young child nutrition . In: Sixty‐fifth World Health Assembly, Geneva, 21–26 May. Resolutions and Decisions, Annexes World Health Organization: Geneva. (WHA65/2012/REC/1). Available at: http://apps.who.int/gb/ebwha/pdf_files/WHA65/A65_11-en.pdf and http://apps.who.int/gb/ebwha/pdf_files/WHA65/A65_11Corr1-en.pdf (Accessed 5 December 2012).
- WHO Multicentre Growth Reference Study Group (2006) WHO Child Growth Standards based on length/height, weight and age. Acta Paediatrica. Supplementum 450, 76–85. [DOI] [PubMed] [Google Scholar]
- WHO & UNICEF (2012) Care for Child Development. Improving the Care of Young Children . World Health Organization: Geneva.
- Yousafzai A.K., Rasheed M.A. & Bhutta Z.A. (2013) Annual research review: improved nutrition – a pathway to resilience. Journal of Child Psychology and Psychiatry, and Allied Disciplines 54, 367–377. [DOI] [PubMed] [Google Scholar]