

Abstract
This review addresses the question of whether a short birth interval is associated with adverse nutritional outcomes for the mother or the child. Indices of anthropometric status (maternal weight or body mass index; child growth) and micronutrient status (e.g. iron or vitamin A) were included as outcomes. A computerized search of all relevant papers published since 1966 was completed, and the ‘snowball’ method was used to identify additional relevant published or unpublished papers. In total, 57 papers were found to contain data regarding the relationship between birth spacing and nutritional outcomes (35 for child nutrition, 11 for maternal anthropometric status, and 11 for maternal anaemia or micronutrient status). Of these, 23 papers were excluded from further consideration because they did not include any multivariate analysis, leaving 34 papers that met the criteria for the review (22 for child nutrition, eight for maternal anthropometric status, and four for maternal anaemia or micronutrient status).
The studies on child nutrition outcomes indicate that a longer birth interval is associated with a lower risk of malnutrition in some populations, but not all. In those countries in which the relationship was significant, the reduction in stunting associated with a previous birth interval ≥36 months ranged from ∼10% to 50%. Some of this reduction may be due to residual confounding, i.e. to factors not included in the analysis (such as breastfeeding and maternal height).
The studies on maternal anthropometric outcomes yielded mixed results. Because the nutritional burden on the mother between pregnancies depends on the extent of breastfeeding, the interpregnancy interval is not the best measure of whether the mother has had a chance to recover from the pregnancy, in terms of repleting her nutritional status. Therefore, some studies examined the ‘recuperative interval’ (duration of the non‐pregnant, non‐lactating interval) instead. Taken as a whole, the studies do not provide clear evidence of a link between interpregnancy or recuperative interval and maternal anthropometric status. This may be due, in part, to changes in the hormonal regulation of nutrient partitioning between the mother and the fetus when a mother is malnourished.
Only four papers were identified that related to micronutrient status, three of which examined maternal anaemia. One study showed an increased risk for maternal anaemia when the interpregnancy interval was <6 months, but the analysis did not control for iron supplementation during pregnancy. The other two studies did not show a significant association between interpregnancy interval and maternal anaemia. One study of micronutrient status indicated no significant relationship between interpregnancy interval and maternal serum zinc, copper, magnesium, ferritin, folate or thyroid‐stimulating hormone.
Important methodological limitations were apparent in most of the studies. Thus, further research with more comprehensive control of potentially confounding variables is needed.
Keywords: birth interval, interpregnancy interval, child growth, maternal nutrition
Background
There are many reasons to suspect that a short birth interval could adversely affect nutritional status of the mother or the child. For the mother, a short birth interval may give her insufficient time to recover from the nutritional burden of pregnancy (King 2003). Pregnancy increases energy needs by 13%, protein needs by 54%, and vitamin and mineral needs by 0–50%, depending on the vitamin or mineral in question (Institute of Medicine 1997, 1998, 2000, 2001). If the mother’s reserves have been depleted, it is theorized that a longer interpregnancy interval would allow for repletion prior to the next conception. As will be discussed below, however, this theory of maternal depletion and repletion does not take into account the nutritional impact of breastfeeding. Lactation represents a greater nutritional burden than pregnancy, with energy needs increasing by 25%, protein needs by 54%, and vitamin and mineral needs by 0–93%, depending on the vitamin or mineral in question (Dewey 2004). Prolonged lactation has been associated with depletion of energy reserves among women in the Philippines (Adair & Popkin 1992). Lactation that overlaps with pregnancy represents a particularly large nutritional burden (Adair 1993). Thus, the ability to replete nutrient reserves during the interpregnancy interval will depend on the duration and exclusivity of breastfeeding. For this reason, some investigators have proposed a new definition of ‘maternal depletion syndrome’ that examines separately the various components of a full reproductive cycle (1992, 2003).
Figure 1 shows a conceptual model for the relationship between interpregnancy interval and maternal nutritional status, which illustrates the complex web of factors that may come into play. For the reasons explained above, the interpregnancy interval is subdivided into the period of lactation and the period when the mother is neither pregnant nor lactating. These two periods may have differing effects on the mother’s nutritional status at the beginning of the next pregnancy, and thus two separate arrows are shown. The mother’s initial body mass index (BMI) is a key factor to consider, as it may be inversely related to the interpregnancy interval [a woman with higher BMI is likely to return to fertility sooner (Kurz et al. 1993; Popkin et al. 1993; Heinig et al. 1994), which in the absence of contraception will lead to a shorter interpregnancy interval], yet positively related to her BMI at the next conception. The mother’s initial BMI is in turn influenced by pregnancy weight gain. The mother’s dietary adequacy and physical activity level are important modifying factors; that is, they may influence the effect of the interpregnancy interval on the mother’s nutritional status. For a woman with generous nutrient intake, a longer period for ‘repletion’ is unlikely to make a difference, whereas for malnourished women or those with high levels of physical activity, this recuperative interval could be essential. Dietary adequacy may also influence the partitioning of nutrients between the mother and the fetus during pregnancy (Winkvist et al. 1994), thus affecting the mother’s BMI immediately postpartum. Other factors to be considered include socio‐economic status (SES), educational level, prenatal care, parity and maternal morbidity, all of which may affect several of the above variables and confound the relationship between interpregnancy interval and maternal nutritional status. In the case of maternal iron status, for example, a woman who receives prenatal care may be more likely to space out her pregnancies, and if her prenatal care includes iron supplementation, she will also be less likely to be anaemic. Thus, it is necessary to control for prenatal care and iron supplementation when examining the relationship between interpregnancy interval and maternal anaemia.
Figure 1.
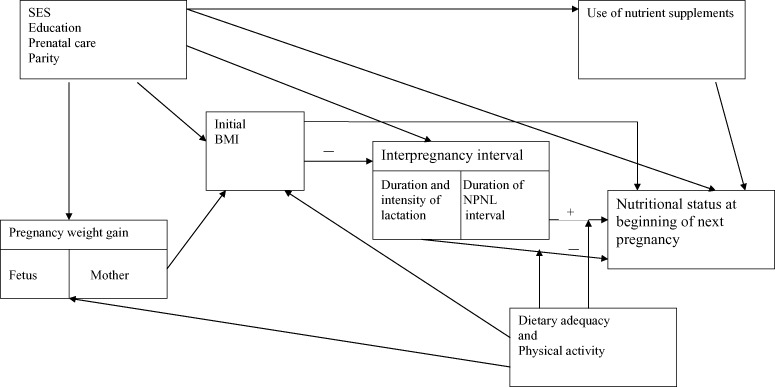
Conceptual model for the relationship between interpregnancy interval and maternal nutritional status. BMI, body mass index; NPNL, non‐pregnant, non‐lactating; SES, socio‐economic status.
For the child, two different conceptual models are shown, one for the effect of the previous birth interval (Fig. 2), and the other for the effect of the subsequent birth interval (Fig. 3). A short previous birth interval could be risky if the mother’s nutrient reserves become depleted, which could increase the risk of intrauterine growth retardation and adversely affect infant nutrient stores at birth and nutrient delivery via breastmilk. There is little evidence that maternal malnutrition affects the amount of breastmilk available to the infant (Dewey 1997), but deficiencies of certain micronutrients (most vitamins and certain trace elements such as iodine and selenium) can affect the nutrient content of the milk (Institute of Medicine 1991), which may then affect the child’s nutritional status. Although the mother’s nutritional status is unlikely to directly affect milk production, her perception of being undernourished may influence her infant feeding choices, such as the duration and intensity of breastfeeding and supplemental feeding of the infant. These choices could then influence the child’s nutritional status (either positively or negatively) via direct effects attributable to nutrient intake and indirect effects attributable to morbidity. Apart from the issue of maternal depletion, a short previous birth interval (and thus a closely spaced older child) may compromise the care received by the infant. In addition, the presence of several young children in the household increases the risk of infection (Manun’ebo et al. 1994). Lastly, the potentially confounding effects of SES, educational level, prenatal care and parity need to be taken into account.
Figure 2.

Conceptual model for the relationship between previous birth interval and child nutritional status. IUGR, intrauterine growth retardation; SES, socio‐economic status.
Figure 3.
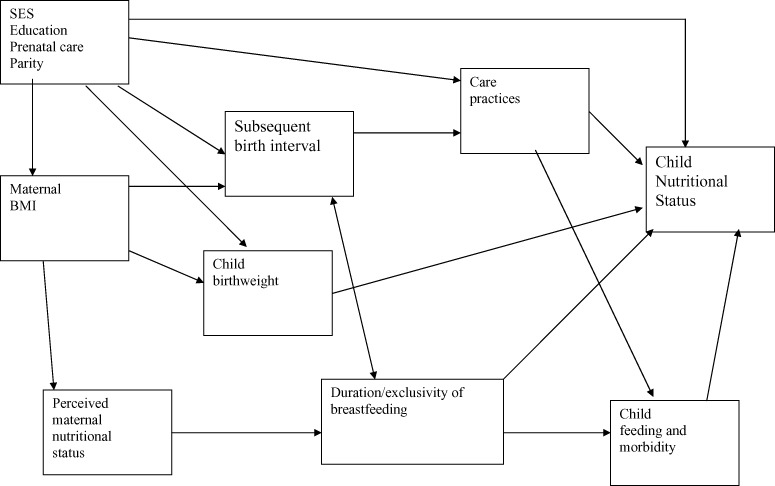
Conceptual model for the relationship between subsequent birth interval and child nutritional status. BMI, body mass index; SES, socio‐economic status.
A short subsequent birth interval can also place the child at risk for several reasons (Fig. 3). A new pregnancy often prompts weaning of the current child, or at least a reduction in the volume of breastmilk consumed, and reduced breastmilk intake can be hazardous both nutritionally and in terms of resistance to infection. The relationship between subsequent birth interval and duration of breastfeeding is bidirectional, however, as cessation of breastfeeding (or introduction of other infant foods) can prompt the return to fertility, which in the absence of contraception will cause a shorter birth interval. Caring for a new infant also reduces the amount of time that the mother can devote to caring for the older child. Children who are younger when this occurs (i.e. when there is a short birth interval) are likely to be more vulnerable to reduced caregiving than children who are older. Even before the new infant is born, simply being pregnant may alter care practices that affect the current child’s health. Children in Bhutan whose mothers were pregnant when they terminated breastfeeding experienced a reduction in growth (Bøhler & Bergström 1996), and an increased incidence of diarrhoea (Bøhler & Bergström 1995) compared with children weaned at the same age from non‐pregnant mothers. The mother’s initial nutritional status is an important factor to consider. A mother with a higher initial BMI is likely to have a shorter subsequent birth interval (in the absence of contraception, as explained above), but less likely to have a low‐birthweight infant. Because birthweight is a strong predictor of subsequent child anthropometric status, this association could obscure the relationship between subsequent birth interval and child nutritional status. As mentioned previously, the mother’s perceived nutritional status may affect her infant feeding choices and thus the child’s morbidity and nutritional status. Finally, SES, educational level, prenatal care and parity may have an influence on several variables in the model, including maternal BMI, care practices, subsequent birth interval, and child nutritional status.
The three conceptual models demonstrate that the relationship between interpregnancy interval and maternal or child nutritional status is by no means simple. In addition to the complex set of factors that may be involved, it is likely that the relationship is context‐specific. Positive associations may be more evident in populations with higher rates of malnutrition. Use of contraception is another complicating factor, particularly if choosing to become pregnant again is influenced by the mother’s or the child’s health status. Some potentially confounding variables, not all of which are shown in the figures, may be important in certain populations but not in others. The relationship, and the confounders that need to be considered, may also differ depending on which outcome is being measured. For example, a longer period of breastfeeding (and thus potentially a longer interpregnancy interval) may result in a lower maternal BMI, but may improve maternal iron status. This is because iron needs are actually lower during lactation than in the non‐pregnant, non‐lactating state as a consequence of lactational amenorrhoea. Potential confounders that may need to be considered when examining maternal iron status (but not for maternal anthropometric status) include delivery type (vaginal vs. cesarean section) and blood loss during or after delivery. Similarly, when child height is the outcome, parental height is a key factor to consider.
The objectives of this review were to examine the relationship of birth interval or interpregnancy interval, to the following outcomes:
-
1
A. Child nutritional status
-
1
Anthropometric status, e.g. weight, length or height, prevalence of stunting, wasting or underweight
-
2
Anaemia or iron status
-
3
Other measures of micronutrient status, if data are available
-
1
B. Maternal nutritional status (prior to, during or after pregnancy)
-
1
Weight or BMI
-
2
Anaemia or iron status
-
3
Other measures of micronutrient status (e.g. vitamin A), if data are available
Although maternal bone density may be affected by pregnancy and lactation, it was not considered as an index of maternal nutritional status for this review because it is so strongly influenced by non‐dietary factors such as weight‐bearing activity, oestrogen levels and sunlight exposure.
Questions/hypotheses
The following questions were the focus of this review:
-
1
Is a longer interpregnancy interval (previous or subsequent) associated with child nutritional status, i.e. a lower risk of child stunting, wasting, anaemia and poor micronutrient status?
-
2
Is a longer interpregnancy interval associated with higher maternal weight or BMI?
-
3
Is a longer interpregnancy interval associated with a lower risk of maternal anaemia or micronutrient deficiency?
The hypothesis was that a longer interpregnancy interval would be associated with better child and maternal nutritional outcomes. A schematic diagram illustrating interpregnancy interval (defined as the time period between the birth of the previous child and conception of the index child), previous birth interval (defined as the time period between the birth of the previous child and birth of the index child), and subsequent birth interval (defined as the time period between the birth of the index child and the birth of the subsequent child) is shown in Fig. 4. Interpregnancy interval is the preferred variable for such analyses because it is not affected by the gestational age of the index child. However, many of the studies reviewed herein used birth interval rather than interpregnancy interval, and the two terms are used interchangeably in this paper.
Figure 4.
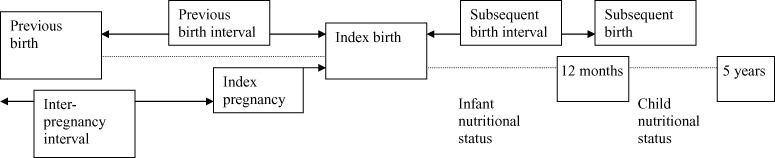
Schematic diagram of interpregnancy and birth intervals.
Review methods
An initial search in MEDLINE for the period 1966 to October 2003 was conducted by Conde‐Agudelo et al. (2006), who made their findings available to the authors. Additional searches through 2006 were then conducted in MEDLINE, EMBASE, POPLINE, CINAHL, LILACS and ECLA. The POPLINE database includes unpublished reports.
The search strategy used Medical Subject Headings, including truncation. No language restrictions were imposed. The following Medical Subject Headings or keyword terms were used:
-
•
For child outcomes:
-
2
Term one: interpregnancy interval* OR birth spacing OR pregnancy spacing OR intergenesic interval OR birth interval* OR birth to birth interval* OR interbirth interval* OR birth to conception interval* OR delivery to conception interval* OR interdelivery interval*
-
3
And
-
4
Term two: infant OR child*
-
5
And
-
6
Term three: Growth OR Nutrition* OR Weight gain OR Length gain OR Stunting OR Wasting OR Malnutrition OR Anemia OR Iron OR Underweight OR Vitamin A OR Retinol
-
•
For maternal outcomes:
-
8
Term one: interpregnancy interval* OR birth spacing OR pregnancy spacing OR intergenesic interval OR birth interval* OR birth to birth interval* OR interbirth interval* OR birth to conception interval* OR delivery to conception interval* OR interdelivery interval*
-
9
And
-
10
Term two: mother* OR woman OR women OR maternal
-
11
And
-
12
Term three: nutrition* OR malnutrition OR body mass index OR anemia OR iron OR vitamin A OR Retinol OR maternal depletion
We also used the ‘snowball’ method, by checking the references cited in review papers and the articles identified through the search engines, to find additional relevant papers (published or unpublished). All abstracts identified by the search were read and categorized by both authors according to whether or not the study had (or might have) data relevant to the outcomes of interest. The full papers for all relevant abstracts were obtained for further review. These papers were then categorized into those that actually did or did not have data on the outcomes of interest. Case studies, editorials and review papers that did not report primary data were in the latter category.
For each paper with relevant data, a ‘data extraction form’ was completed independently by each of the two reviewers. The form was used to record standard information on each study, including study site, study design, how pregnancy spacing was measured (prior or subsequent birth interval; interpregnancy interval), outcomes assessed, sample size, subject characteristics, consideration of potential confounders, and results. The two forms for each paper were then compared, and any discordance in coding was resolved by consensus.
After the data extraction forms were completed, papers that were judged by both reviewers as not having considered potentially confounding variables (i.e. had no multivariate analysis) were excluded from further consideration. Multiple articles resulting from the same data source were included only once in the systematic review.
For papers included in the review, study quality was scored based on adequacy of control for the key potentially confounding variables. For child anthropometric outcomes, the key confounders were considered to be: (1) SES and/or maternal education, (2) parity, (3) child age, (4) maternal height, and (5) breastfeeding of the index child. Thus, the quality score ranged from 1 to 5 depending on how many of these variables were considered by the investigators, either by including them in the multivariate analysis or by demonstrating that they were not confounders in that population. For maternal anthropometric status, the quality score ranged from 1 to 4 based on consideration of four key confounders: (1) SES and/or maternal education, (2) parity, (3) pre‐pregnancy BMI or weight, and (4) breastfeeding. For maternal anaemia or micronutrient status, the quality score ranged from 1 to 3 based on three key confounders: (1) SES and/or maternal education, (2) parity, and (3) iron supplementation during pregnancy. Because none of the papers mentioned whether the individuals collecting data on outcomes were ‘masked’ with regard to the duration of the birth interval, this aspect of study quality was not rated. Methods for measuring exposure (birth interval or interpregnancy interval, almost always by maternal report) and outcomes were similar across studies, and thus these aspects of study quality were also not rated.
Search results
In total, 253 abstracts were identified as potentially relevant for the maternal and child nutrition outcomes, 218 from the computerized search and 35 from the ‘snowball’ method. Of the 253 abstracts identified, 132 pertained to child nutrition outcomes, 89 to maternal anthropometric status, and 32 to maternal anaemia or micronutrient status. Of the abstracts on child nutrition outcomes, there were only two dealing with vitamin A status and none dealing with iron status or other indices of micronutrient status.
Of the abstracts reviewed, 110 were categorized as (possibly) having data relevant to the outcomes of interest, and of these, full papers were obtained for all but seven (see Fig. 5). Of the 103 papers reviewed, 57 actually contained relevant data (35 for child nutrition, 11 for maternal anthropometric status, and 11 for maternal anaemia or micronutrient status), and the remaining 46 did not. Of the 57 papers with relevant data, 23 were excluded from further consideration because they did not include any multivariate analysis. Thus, 34 papers have been included in the summary of findings below (22 for child nutrition, eight for maternal anthropometric status, and four for maternal anaemia or micronutrient status). Overall agreement on inclusion/exclusion of each of the 96 papers was 98% (kappa = 0.95). All results discussed in the following section were statistically significant at P < 0.05 unless otherwise indicated. When available in the original paper, the 95% confidence interval for odds ratios (OR), adjusted odds ratios (AOR) or relative risk (RR) are presented in the result tables.
Figure 5.

Study selection process.
Specific findings
Child nutrition
Table 1 summarizes the 22 papers included in the review of child nutrition outcomes. One of the papers reports the results of Demographic and Health Surveys (DHS) conducted in 17 different countries in 1986−89 (Boerma & Bicego 1992), and another (Sommerfelt 1991) reports DHS results from 19 countries in the same time interval, two of which were not included in the former paper. DHS data for 1990−97 are reported for 14 countries in a recent paper (Rutstein 2005). Thus, the actual number of studies represented by these papers totals 52. All of the studies were conducted in developing countries, and all but one focused on anthropometric outcomes in infants and/or children under 5 years of age [the exception was a study of 5‐ to 12‐year‐old children in Indonesia (Sekiyama & Ohtsuka 2005)]. There were five prospective cohort studies, 46 cross‐sectional studies and three case–control studies (two papers included both cohort and case–control studies). Child anthropometric status was examined in relation to the previous birth (or interpregnancy) interval in 50 studies, and in relationship to the subsequent birth (or interpregnancy) interval in seven studies (some studies examined both). Only two studies used interpregnancy interval rather than birth interval. In 44 studies, the interval was divided into three or more categories (or birth interval was used as a continuous variable), and in eight studies the analysis was based on only two categories.
Table 1.
Summary of papers included: child nutrition
| Authors (year) | Location | Study design | Age range | n | P‐ or S‐BI | BI/IPI categories | Outcomes assessed | Control for confounders | Findings | Quality score (1–5) |
|---|---|---|---|---|---|---|---|---|---|---|
| Aerts et al. (2004) | Brazil | CS | <5 years | 3 355 | P‐BI S‐BI | <24; ≥24 months | Stunting | Maternal age, education, parity, socio‐economic status, employment, child age, sex, gestational age, birthweight, child care | Stunting more likely with P‐BI <24 months (AOR = 1.69; CI 1.13–2.53) and with S‐BI <24 months (AOR = 1.91; CI 1.16–3.13) | 3 |
| Afifi (1985) | Egypt | P‐Coh | <1 year | 162 | P‐BI | <2; 2–3; >3 years | Four growth ‘factors’: growth velocity, size factor, length, soft/ bony tissue | Maternal age, education, social sanitary index, maternal height; infant sex, age of solid‐food introduction. (NR: child age) | Previous BI positively associated with overall size factor, but not with growth velocity, soft/bony tissue or infant length factors | 3 |
| Bertrand et al. (1988) | Zaire | CS | <5 years | 2 038 | P‐BI | <24; >24 months | HAZ, WAZ, WHZ, wasting, stunting, underweight | Maternal age, parity, family income, housing type and quality, BF after BI (current yes/no), child sex and age | No association between BI and HAZ or WHZ; association with WAZ was marginally significant | 4 |
| Boerma & Bicego (1992) | 17 DHS: Bolivia, Brazil, Burundi, Colombia, Dom. Rep., Egypt, Ghana, Guatemala, Mali, Morocco, Senegal, Sri Lanka, Thailand, Togo, Tunisia, Uganda, Zimbabwe | CS | <24 months | Varies by site | P‐BI | <24; 24–35; ≥36 months | Stunting, underweight | Maternal age and education, parity, household assets, floor material; infant sex, child age | Stunting: BI < 24 months at higher risk in 1/17 countries (Zimbabwe, RR 1.47) and lower in 1 country (Dom. Rep, RR 0.72); BI ≥ 36 months at lower risk in 5/17 countries (Morocco, RR 0.70; Tunisia, RR 0.56; Sri Lanka RR 0.68; Colombia, RR 0.50; Dom. Rep., RR 0.46). Underweight: BI < 24 months at higher risk in 2/17 countries (Ghana, RR 1.54; Thailand, RR 1.60). BI ≥ 36 months at lower risk in 1/17 countries (Dom. Republic, RR 0.38). (confidence intervals not reported) | 3 |
| Bøhler et al. (1995) | Bhutan | P‐Coh and CC (subsequent pregnancy within 18–30 months vs. not) | <36 months | 86 | S‐IPI | 18–30; >30 months | Growth velocity during first 6 months of subsequent pregnancy (P‐Coh); WAZ, MUAC, weight gain (CC) | Maternal age, education, parity, father’s occupation, arable land owned; CC subjects matched for child age. (NR: child sex) | No association between subsequent IPI and growth velocity in cohort study. In case–control study, lower weight gain & greater risk of low MUAC found in children whose mothers became pregnant. Weight gain difference most apparent during 1st trimester of pregnancy | 3 |
| Bøhler (1996) | Bhutan (follow‐up to 1995 study) | P‐Coh and CC | ∼4.5 years | 76 (P‐Coh); 66 (CC) | S‐BI | 18–30; >30 months; also as continuous variable | WAZ, HAZ, WHZ, MUAC | Maternal age, parity, father’s occupation, arable land owned, previous BI. (NR: child age) | No association between subsequent BI and any of the anthropometric outcomes. Case–control study yielded same results as regression analysis | 4 |
| Clark (1992) | Guatemala | CS | <1 year | 301 | P‐IPI | ≤12; >12 months | Weight change (0–12, 0–6, 6–12 months) | Maternal age, parity, income, height, BF duration after BI, infant sex, initial weight. (NR: child age) | Short previous IPI associated with decreased growth from 0–12 and 0–6 months, but no association with growth from 6–12 months | 5 |
| Fletcher et al. (1992) | Jamaica | CC | 6–48 months | 612 | P‐BI | <24; ≥24 months | Underweight (<80% median weight for age) | Prenatal care, household possessions, birthweight. (NR: maternal age, education, parity, child sex and age) | BI < 24 months associated with greater risk of underweight (AOR = 1.8; CI 1.02–3.21) | 3 |
| Goldberg (1985) | Senegal | CS | 2–4 years | 979 | P‐BI S‐BI | ≤24; >24 months | WHZ, HAZ | Prenatal care, maternal age, parity, dwelling type, husband’s occupation, ethnicity, child sex | Short (≤24 months) previous BI associated with greater risk of low HAZ (AOR = 2.4), but not associated with low WHZ. Short subsequent BI associated with lower risk of low HAZ (AOR = 0.26), but not associated with low WHZ. (confidence intervals not reported) | 2 |
| Huttly et al. (1992) | Brazil | CS | ∼19 months | 3 587 | P‐BI | <18; 18–23; 24–35; 36–47; 48–71; >71 months | WHZ and HAZ | Maternal age, education, parity, income, race, child age. (NR: child sex, gestational age) | Previous BI positively associated with WHZ and HAZ. Same trend when limiting analysis to those with gestational age data | 3 |
| Madzingira (1995) | Zimbabwe – DHS | CS | 3–60 months | No information | P‐BI | Continuous | WAZ, HAZ, WHZ | Maternal education, parity, income, sanitation, BF duration after BI, child age, birthweight | Previous BI not associated with any of the anthropometric outcomes | 4 |
| Mozumder et al. (2000) | Bangladesh | CS | 6–39 months | 1 887 | P‐BI & S‐BI | P: none, ≤18; 19–24; 25–36; 37–48, ≥49 months S: none; ≤18; 19–24; 25–36; ≥37 months | Low weight for age (<60% and <70% of NCHS median) | Maternal age, education, parity, housing unit area, child age, sex, diarrhoea | Short subsequent BI (≤24 vs. >25 months) associated with greater risk of low weight for age (OR 1.6; CI 1.09–2.23). Previous BI not associated with low weight for age | 3 |
| Rajaram et al. (2003) | India | CS | <5 years | 7 473 | P‐BI | <24; 24–47; ≥48 months | Stunting, wasting, underweight | Maternal age, education, parity, rural/urban, source of lighting, child age, sex | No association between BI and stunting or wasting. In one region, underweight less likely with BI ≥ 48 months (OR = 0.46; CI 0.29–0.74) | 3 |
| Ricci & Becker (1996) | Philippines | CS | <30 months | 14 189 | P‐BI | <24; ≥24 months | Stunting, wasting | Prenatal care, household possessions, house materials, maternal age, education, BF after BI (current yes/no), child age, sex, birthweight | BI < 24 months associated with higher risk of stunting in 3 age intervals (0–5, 6–11, 12–29 months) and both urban and rural locations (AOR 1.13–1.67). BI not associated with wasting. (confidence intervals not reported) | 3 |
| Roy (2000) | Bangladesh | P‐Coh | <5 years | 8 881 | P‐BI S‐BI | None; <24; ≥24 months | Low MUAC (<−3 SD) | Maternal education, family dwelling space, religion, BF duration after BI, child sex, diarrhoea | Previous BI: no association with MUAC. Subsequent BI: lower risk of low MUAC with BI ≥ 24 months (AOR 0.83; CI 0.70–0.99) | 2 |
| Russell (1976) | Guatemala | P‐Coh | <5 years | 643 | P‐BI S‐BI | 12–17; 18–23; 24–29; 30–35; 36–41; ≥42 months | Height at 3 years, interpolated from growth curves | Parity, parental height, child sex. (NR: child age) | Subsequent BI positively associated with height. Previous BI positively associated with height only in males | 3 |
| Rutstein (2005) | 14 DHS: Bangladesh, Bolivia, Cote d’Ivoire, Egypt, Ghana, Guatemala, India, Indonesia, Kenya, Morocco, Nepal, Nigeria, Peru, Philippines, Tanzania, Uganda, Zambia | CS | <5 years or <4 years or <3 years (depending on country) | 94 376 | P‐BI | <18; 18–23; 24–29; 30–35; 36–41; 42–47; 48–53; 54–59; ≥60 months | Stunting, wasting, underweight | Maternal age, education, urban/rural, socio‐economic status, parity, prenatal care, wantedness of pregnancy, child age, sex, breastfeeding | Stunting less likely with longer BI in 6 countries (Bangladesh, Guatemala, India, Kenya, Peru, Zambia) and underweight less likely with longer BI in 6 countries (Bolivia, Guatemala, India, Kenya, Nigeria, Peru). No association of BI with wasting | 4 |
| Sekiyama & Ohtsuka (2005) | Indonesia | CS | 5–12 years | 310 | P‐BI | Continuous | HAZ, WAZ | Maternal age, education, parity, height, weight, socio‐economic status, healthcare utilization, child age, sex, birthweight | BI positively associated with HAZ and WAZ | 4 |
| Som et al. (2006) | India | CS | <3 years | 1 789 | P‐BI | <24; 24–47; ≥48 months | Stunting, wasting, underweight | Maternal age, education, parity, socio‐economic status, ethnicity, urban/rural, child age, sex | No consistent association between BI and stunting, wasting or underweight | 2 |
| Sommerfelt (1991) | 19 DHS (17 also reported by Boerma & Bicego) | CS | 3–36 months | Varies by site | P‐BI | None; <24; 24–35; 36–47; >47 months | HAZ | Maternal education, parity, household assets, sanitation, child sex, child age | No association between HAZ and previous BI in Nigeria or Trinidad and Tobago* | 3 |
| Thaver et al. (1990) | Pakistan | CS | <1 year | 211 | P‐BI | <24; >24 months | Underweight (not defined) | Prenatal care, maternal age, parity, housing type and materials, family possessions, mortality of previous sibling, BF duration after BI, child age | Short BI not associated with underweight | 4 |
| Thuita et al. (2005) | Kenya | CS | 6–36 months | 347 | P‐BI | Continuous | HAZ, WAZ, WHZ | Maternal age, education, parity, socio‐economic status, employment, BMI, prenatal care, child sex | BI positively associated with WAZ but not HAZ or WHZ | 2 |
AOR, adjusted odds ratio; BF, breastfed; BI, birth interval (P‐BI, previous birth interval; S‐BI, subsequent birth interval); CC, case–control; CI, 95% confidence interval; CS, cross‐sectional; DHS, Demographic and Health Surveys; Dom. Rep., Dominican Republic; HAZ, height‐for‐age z‐score; IPI, interpregnancy interval; MUAC, mid‐upper arm circumference; NCHS, National Center for Health Statistics; NR, not relevant (not a confounder); OR, odds ratio; P‐Coh, prospective cohort; RR, relative risk; Stunting, HAZ < −2; Underweight, WAZ < −2; Wasting, WHZ < −2; WAZ, weight‐for‐age z‐score; WHZ, weight‐for‐height z‐score; *Results from the 17 other countries were reported in the Boerma & Bicego paper.
All but one of the studies controlled for at least one variable that reflected SES. The one that did not control for SES (Russell 1976) included parental height, which is generally correlated with SES. Most studies controlled for child age (48 studies), sex (49 studies), maternal age (47 studies), parity (49 studies) and maternal education (46 studies), but only 20 studies controlled for breastfeeding of the index child (either duration of breastfeeding or yes/no for currently breastfed), and only four controlled for maternal height. Study quality scores ranged from 2 to 5, with most given a rating of 3. Only one study controlled for all of the key potential confounders and received a score of 5. It is unfortunate that only four studies controlled for maternal height, as it is usually positively associated with child growth status. Whether maternal height is a potentially confounding factor depends on whether it is also associated with birth interval (independently of SES or education). In the absence of contraception, maternal weight may be negatively associated with birth interval, as heavier mothers experience a shorter duration of lactational amenorrhoea. However, to our knowledge it is unknown whether maternal height is related to birth interval. Information on birth interval or interpregnancy interval was by maternal report in all but two studies, although some investigators attempted to verify the information provided by the mother. In the prospective studies, loss to follow‐up was not consistently reported.
The results were mixed with regard to the association between birth interval or interpregnancy interval (either previous or subsequent) and child anthropometric status. Twenty‐five studies [including seven of the 19 countries in the earlier DHS studies (Sommerfelt 1991; Boerma & Bicego 1992) and six of the 14 countries in the later DHS (Rutstein 2005)] showed a positive association (i.e. a longer interval was associated with better nutritional status), whereas 25 studies showed no significant relationship, and two studies yielded mixed results. Of the latter two studies, one (conducted in Senegal) showed more stunting (height‐for‐age z‐score <−2) with a shorter previous birth interval (AOR 2.4) but less stunting with a shorter subsequent birth interval (AOR 0.26) (Goldberg 1985). The other study reporting inconsistent findings was the DHS in the Dominican Republic (Boerma & Bicego 1992). In that country, the risk of stunting was lower in those with a previous birth interval of <24 months than in those with a previous birth interval of 24–35 months (RR 0.72), but the risks of both stunting and underweight (weight‐for‐age z‐score <−2) were also lower in those with a previous birth interval of ≥36 months than in those with a birth interval of 24–35 months (RRs of 0.46 and 0.38, respectively). In all of the other DHS from 1986 to 1989 in which there was a significant relationship between previous birth interval and stunting or underweight, the RR associated with a short birth interval (<24 months compared with 24–35 months) was >1 (ranging from 1.47 to 1.60), and the RR associated with a longer birth interval (≥36 months compared with 24–35 months) was <1 (ranging from 0.38 to 0.70). In the more recent DHS, the weighted average ORs based on the results of the multivariate analyses in all 14 countries showed a significant downward trend from the shortest (<18 months) to the longest (≥60 months) birth intervals, from 1.21 to 0.85 for stunting, and from 1.14 to 0.82 for underweight (reference birth interval category 36–41 months). Most of the other studies did not present the results in terms of RR or OR, but of those that did, the ratios for those with significant results were of similar magnitude [AOR 2.0 for underweight with previous birth interval <24 months in Jamaica (Fletcher et al. 1992); OR 1.6 for underweight with subsequent birth interval ≤24 months in Bangladesh (Mozumder et al. 2000); AOR 1.13–1.67 for stunting with previous birth interval <24 months in the Philippines (Ricci & Becker 1996); AOR 0.83 for low mid‐upper arm circumference with subsequent birth interval ≥24 months in Bangladesh (Roy 2000); AOR for stunting 1.69 with previous birth interval <24 months and 1.91 with subsequent birth interval <24 months in Brazil (Aerts et al. 2004)].
Five studies examined the associations of child nutritional status with both subsequent and previous birth interval in the same population. Three of these showed a positive association between child anthropometric status and duration of subsequent birth interval, but either no significant association with previous birth interval (Mozumder et al. 2000; Roy 2000) or a significant association only in males (Russell 1976). One study (Aerts et al. 2004) showed a positive association with both previous and subsequent birth interval, and another showed a positive relationship with previous birth interval but a negative relationship with subsequent birth interval (Goldberg 1985). In that study, the authors compared only two categories of birth intervals (≤24 months vs. >24 months); they attributed their unexpected findings regarding subsequent birth interval to the likelihood that women with a very long subsequent birth interval (who were included in the second group) had more difficulty getting pregnant, and thus their children were at greater risk of intrauterine growth retardation. Of the five studies that examined both previous and subsequent birth interval, only one controlled for breastfeeding duration (Roy 2000). Given that a longer duration of breastfeeding might lead to both better child nutrition and a longer subsequent birth interval, breastfeeding is a potentially confounding variable.
A pair of studies in Bhutan (one of which was a follow‐up to the first study) also examined subsequent birth interval (Bøhler et al. 1995; Bøhler 1996). Although neither showed a significant association with child growth status in the prospective cohort analyses, this may have been due to lack of statistical power, as the sample sizes were <100 in both cases. In the first study, when the children were <36 months of age (Bøhler et al. 1995), the investigators contrasted the growth of children of mothers who were pregnant again with that of children whose mothers were not pregnant at the time of the measurements. Weight gain of the former group was reduced by 28% relative to the latter group (P < 0.05), and the difference was greatest in early pregnancy. All of the children in the former group were still being breastfed. This implies that breastfed children are vulnerable to growth faltering during the time when their mothers are pregnant with the next child. This vulnerability is likely to be greatest when the index child is <12 months and most at risk of growth faltering for other reasons. Such a scenario would be consistent with an association between a short subsequent birth interval and child malnutrition.
In five studies, the relationship between birth interval and child anthropometric status was examined after controlling for birthweight (among other variables) (Fletcher et al. 1992; Madzingira 1995; Ricci & Becker 1996; Aerts et al. 2004; Sekiyama & Ohtsuka 2005). Four of these studies still found a greater risk of underweight (Fletcher 1992; Sekiyama & Ohtsuka 2005) or stunting (Ricci 1996; Aerts et al. 2004; Sekiyama & Ohtsuka 2005) with a shorter birth interval, but the fourth study did not find a significant association (Madzingira 1995). This implies that at least in some settings, the effect of a short birth interval is not solely due to its impact on maternal nutrition during pregnancy, and that there is likely to be a post‐natal component as well.
In most of the studies that reported both univariate and multivariate results, adjustment for potential confounders did not substantially change the results. In four of the earlier DHS (Sommerfelt 1991), however, the relationship between child height‐for‐age z‐score and previous birth interval was statistically significant in univariate analyses, but not in the multivariate analysis. Among the 13 studies excluded because the authors did not report any multivariate analyses, the results were mixed. In seven of these studies, at least one of the outcomes was more positive when the birth interval was longer, whereas the results were not statistically significant (or no statistics were presented) in five studies and an inverse relationship was reported in one study.
Maternal anthropometric status
Table 2 summarizes the eight papers included in the review of maternal anthropometric outcomes. Three studies were conducted in the USA, two in Pakistan, two in Guatemala, and one in Lesotho. There were six prospective cohort studies, one retrospective cohort study, and one cross‐sectional study. Maternal anthropometric status was examined in relation to the interpregnancy interval in five studies, and in relation to birth interval in one study. Another two studies used the ‘recuperative interval’, rather than the entire interpregnancy interval (one of the studies that examined interpregnancy interval also used recuperative interval). Recuperative interval is generally defined as the amount of time that the woman was not lactating prior to the next conception. This recognizes the fact that the nutritional burden on the mother between pregnancies depends on the extent of breastfeeding.
Table 2.
Summary of papers included: maternal anthropometric status
| Authors (year) | Location | Study design | n | BI or IPI | BI/IPI categories | Outcomes assessed | Control for confounders | Findings | Quality score (1–4) |
|---|---|---|---|---|---|---|---|---|---|
| Farahati et al. (1993) | USA | P‐Coh (3 consecutive pregnancies) | 47 | IPI | ≤12; >12 months; continuous | Pregravid weight for subsequent pregnancy | Maternal age, pre‐pregnancy weight, gestational age. (smokers excluded) | IPI not associated with subsequent pregravid weight | 2 |
| Greene et al. (1988) | USA (1959−65) | P‐Coh | 7 116 | IPI | Continuous | Interpregnancy weight change. Women reported pre‐pregnancy weight at time of enrolment | Maternal age, parity, race, smoking, US Bureau of Census Socioeconomic Index, breastfeeding (yes/no), pre‐pregnancy weight, delivery complications, week gestation at enrolment | IPI positively associated with interpregnancy weight change | 4 |
| Herman & Yu (1997) | USA | P‐Coh | 43 160 | IPI | Continuous | Obesity (pre‐pregnancy BMI > 26 and >29). Height measured and weight reported at first prenatal visit | Maternal age, education, race, marital status, smoking, initial BMI, weight gain between pregnancies. Parity 1 & 2 only | Longer IPI associated with obesity (non‐linear relationship) | 2 |
| Khan et al. (1998) | Pakistan | R‐Coh | 278 | IPI | Continuous | Change in weight and BMI between 1st and 2nd pregnancy. Weight measured during first prenatal visit (6–7 weeks) | Maternal age, parity, initial weight or BMI | IPI positively associated with change in weight and BMI between 1st and 2nd pregnancies | 2 |
| Merchant et al. (1990) | Guatemala | P‐Coh | 504 in paper 1; 102 in paper 2 (women with 2 consecutive pregnancies) | Recup. interval | None (overlap of BF and pregnancy) vs. short (≤6 months NPNL) vs. long (>6 months NPNL) | Thigh fatfold measurements taken at 3‐month intervals during pregnancy and lactation | Maternal age, parity. (NR: energy supplementation, height, gestational age) | Paper 1: Longer recup. interval positively associated with thigh fatfold. Paper 2: Longer recup. interval associated with greater thigh fatfold during 1st and 2nd trimesters, but not during 3rd trimester or postpartum | 1 for Paper 1; 2 for Paper 2 |
| Miller & Huss‐Ashmore (1989) | Lesotho | CS | 873 | BI | <12; 12–17; 18–23; 24–35; ≥36 months | BMI, triceps skinfold, arm muscle area | Maternal age, parity. (All were classified as ‘poor’ or low SES) | BI not associated with BMI or triceps skinfold. Arm muscle area lower when BI 12–17 months compared with BI < 12 months | 2 |
| Pebley & DaVanzo (1993) | Guatemala | P‐Coh | 227–262 | IPI; Recup. interval | IPI: <9; 9–14; ≥15 months Recup. interval: None (overlap of BF and pregnancy) vs. 0–3 months NPNL vs. >3 months NPNL | Preconception weight for height, pregnancy weight gain. Weight measured within 3 months prior to conception, and during 1st and 3rd trimesters | Maternal age, education, parity, energy supplementation, breastfeeding duration | IPI negatively associated with preconception weight for height, but not associated with pregnancy weight gain. Recup. interval not associated with preconception weight for height, but positively associated with pregnancy weight gain | 3 |
| Winkvist et al. (1994) | Pakistan | P‐Coh | 76 | Recup. interval | Duration of NPNL interval between pregnancies; duration of overlap of BF and pregnancy | Weight at 1 month postpartum, weight change between 2 consecutive pregnancies | Parity, initial weight, gestational age. (NR: maternal age, smoking, infant sex) | Increased reproductive stress (greater BF duration or overlap of BF and pregnancy) associated with increased weight gain between pregnancies | 2 |
BF, breastfeeding; BI, birth interval; BMI, body mass index; CS, cross‐sectional; IPI, interpregnancy interval; NPNL, non‐pregnant, non‐lactating; NR, not relevant (not a confounder); P‐Coh, prospective cohort; Recup. interval, recuperative interval (duration of NPNL interval); SES, socio‐economic status.
The studies that examined interpregnancy interval generally used it as a continuous variable, whereas those that examined the recuperative interval used 2–3 categories (e.g. none = overlap between breastfeeding and the subsequent pregnancy; short = 0–3 or 0–6 months with no breastfeeding prior to conception; and long = ≥3 or >6 months of no breastfeeding prior to conception). The study examining birth interval used five categories. All eight studies controlled for maternal age, and several controlled for parity (five studies), pre‐pregnancy BMI or weight (four studies), and smoking (four studies). Only two studies controlled for maternal education, one controlled for SES, and none controlled for prenatal care. Breastfeeding was included as a covariable in two studies (one used duration of breastfeeding and the other used yes/no for any breastfeeding), and was taken into account by using recuperative interval in three studies. Study quality, on a scale of 1–4, was rated as 2 for most of the studies, with only one study achieving a score of 4. In five of the studies, maternal anthropometric status was measured directly, but in two the data were obtained by self‐report, and in one study it is unclear how the outcomes were assessed.
Conflicting results were found with regard to the association between birth interval or interpregnancy interval and maternal anthropometric status. Of the three studies conducted in the USA, one did not show a statistically significant relationship between interpregnancy interval and subsequent pregravid weight (Farahati et al. 1993), whereas one showed a positive relationship between interpregnancy interval and interpregnancy weight change (Greene et al. 1988), and another demonstrated an increased risk of obesity with a longer interpregnancy interval (Herman & Yu 1997). Of the studies conducted in developing countries, two demonstrated a positive relationship with maternal anthropometric status and interpregnancy interval (Khan et al. 1998) or recuperative interval (Merchant et al. 1990), one showed mainly non‐significant results (Miller & Huss‐Ashmore 1989), one showed that increased reproductive stress (longer duration of breastfeeding and overlap of breastfeeding with pregnancy) was associated with increased weight gain between pregnancies, contrary to expectations (Winkvist et al. 1994), and one showed mixed results (Pebley & DaVanzo 1993). In the study by Pebley and DaVanzo, different results were found for interpregnancy interval than for recuperative interval. Interpregnancy interval was negatively associated with preconception weight (contrary to expectations), but not associated with pregnancy weight gain. Recuperative interval was not associated with preconception weight, but was positively associated with pregnancy weight gain. This illustrates that these two indices, interpregnancy interval and recuperative interval, cannot be equated.
Three of the above studies reported both univariate and multivariate results, and in these, adjustment for potential confounders did not substantially change the results. Among the three studies excluded because the authors did not report any multivariate analyses, two showed a positive association between duration of the birth interval and maternal postpartum weight, whereas the other showed greater maternal overweight when the birth interval was shorter.
Maternal anaemia or micronutrient status
Only three papers with maternal anaemia or haemoglobin concentration as an outcome met the inclusion criteria for the review (Table 3). One of these was a very large study using the Perinatal Information System database, which included data for 456 889 pregnant women in 18 countries in Latin America and the Caribbean (Conde‐Agudelo & Belizán 2000). In this database, a mother was coded as anaemic if haemoglobin was <110 g L−1 at any time during pregnancy. In the other two studies, conducted in Pakistan and Singapore, maternal haemoglobin was measured at the time of delivery or shortly thereafter. Two of the studies were cross‐sectional (Singh et al. 1998; Conde‐Agudelo & Belizán 2000) and one was a retrospective cohort study comparing haemoglobin change between the first and the second pregnancy (Khan et al. 1998). All examined the outcome in relationship to interpregnancy interval, with the two cross‐sectional studies using 5–6 categories and the retrospective cohort study using interpregnancy interval as a continuous variable. All three studies controlled for maternal age and parity, and the two cross‐sectional studies controlled for prenatal care and maternal SES or education, but only one controlled for iron supplementation during pregnancy (Singh et al. 1998). None controlled for breastfeeding during the interpregnancy interval or for pregnancy complications that might increase blood loss. Study quality, on a scale of 1–3, was rated as 1 for one study, 2 for another, and 3 for the third.
Table 3.
Summary of papers included: maternal anaemia or micronutrient status
| Authors (year) | Location | Study design | n | BI or IPI | BI/IPI categories | Outcomes assessed | Control for confounders | Findings | Quality score (1–3) |
|---|---|---|---|---|---|---|---|---|---|
| Conde‐Agudelo & Belizán (2000) | Latin America, Caribbean | CS | 456 889 | IPI | ≤5; 6–11; 12–17; 18–23; 24–59; ≥60 months | Anaemia, measured during pregnancy | Prenatal care, smoking, marital status, maternal age, education, parity, delivery mode | IPI < 6 months associated with greater risk of anaemia (adjusted RR = 1.3; CI 1.18–1.43) compared with IPI of 18–23 months. No other significant differences | 2 |
| Khan et al. (1998) | Pakistan | R‐Coh | 278 | IPI | Continuous | Hb change from 1st to 2nd pregnancy, measured 48 h after delivery | Maternal age, parity, initial Hb | IPI was not associated with change in Hb between 1st and 2nd pregnancies | 1 |
| Pathak et al. (2004) | India | CS | 283 | IPI | Not stated | Serum Zn, Cu, Mg, ferritin, folate, TSH | Maternal education, parity, dietary intake | IPI not associated with any of the outcomes | 2 |
| Singh et al. (1998) | Singapore | CS | 3 728 | IPI | <3; 3–5; 6–11; 12–17; 18–23 months | Anaemia at delivery | Prenatal care, maternal age, parity, ethnicity, social class, iron supplement, Hb at booking | No association between IPI and anaemia at delivery | 3 |
BI, birth interval; CI, 95% confidence interval; CS, cross‐sectional; Hb, haemoglobin; IPI, interpregnancy interval; R‐Coh, retrospective cohort; RR, relative risk; TSH, thyroid‐stimulating hormone.
The large multi‐country study showed a 30% increased risk of anaemia with an interpregnancy interval <6 months, relative to an interpregnancy interval of 18–23 months, but no significant differences for any of the other interpregnancy interval categories. There was also an increased risk of third‐trimester bleeding in women with an interpregnancy interval <6 months, but the authors did not report whether this explained (partially or fully) the increased risk of anaemia in the same subgroup. In the other two studies, the multivariate analyses showed no significant association between interpregnancy interval and anaemia (Singh et al. 1998) or change in haemoglobin between the first and second pregnancies (Khan et al. 1998). However, in the former study, the authors controlled for haemoglobin ‘at booking’ (presumably the first prenatal clinic visit). By controlling for early pregnancy haemoglobin, which is likely to be strongly related to anaemia at delivery, they greatly reduced the chance of finding a significant association between interpregnancy interval and anaemia at delivery. In the univariate results, the percentage of mothers who were anaemic was higher in those with an interpregnancy interval <18 months (20–23%) than in those with an interval of 18–23 months (13.8%), but no statistics were provided.
In the two studies with both univariate and multivariate analyses, the results did not change substantially after adjusting for the potential confounders that were included. Of the seven studies excluded because the authors did not present any multivariate analyses, five showed less anaemia or better iron status in women with a longer birth interval, and two showed no significant association.
One additional study reported data on serum zinc, copper, magnesium, ferritin (an indicator of iron status), folate and thyroid‐stimulating hormone (an indicator of iodine status) of 283 pregnant women in India (Pathak et al. 2004). The investigators controlled for maternal education and parity but not iron supplementation during pregnancy. In multivariate analyses, no significant association with interpregnancy interval was found for any of these outcomes.
Summary and discussion
Table 4 summarizes the findings of the studies included in this review. For all three categories of outcomes, the results were mixed. This is perhaps not surprising given the limitations of most of the studies and lack of comparability of methods. First, there were differences in the definition of the key independent variable, not only with respect to the choice between interpregnancy interval and birth interval, but in the cut‐offs used to define a short or long interval and the number of categories used. Several studies analysed the interval as a continuous variable, which may not be appropriate if the association between interpregnancy interval and maternal or child nutrition is non‐linear. Second, there was great variability in the outcomes assessed, for both child and maternal anthropometric status. The association with interpregnancy interval may be different for measures of longer‐term status (e.g. height‐for‐age) than for measures that reflect shorter‐term changes (e.g. BMI or skinfold thickness). Third, the populations in which the relationship was studied differed dramatically in SES and other characteristics. As mentioned in the Introduction, a short interpregnancy interval may pose a greater risk to maternal and child nutrition in areas where malnutrition is prevalent. Last, there was great variability in study quality, with most studies not controlling adequately for all of the key potentially confounding variables.
Table 4.
Summary of findings
| Studies (n) | Association between outcome and BI or IPI | |||
|---|---|---|---|---|
| Positive (n) | Negative (n) | NS or inconsistent (n) | ||
| Child anthropometric status | ||||
| Previous BI | 50 | 24 | 0 | 26 |
| Subsequent BI | 7 | 4 | 1 | 2 |
| Maternal anthropometric status | 8 | 4 | 1 | 3 |
| Maternal anemia or micronutrient status | 4 | 1 | 0 | 3 |
BI, birth interval; IPI, interpregnancy interval; NS, not significant.
For the studies of child nutrition, all of which were conducted in developing countries, the results indicate that a longer birth interval is associated with a lower risk of child malnutrition in some populations, but not all. It is noteworthy that there was little evidence of the opposite, which suggests that a positive relationship exists but is not always statistically significant. In those countries in which the relationship was statistically significant, the reduction in stunting associated with a previous birth interval ≥36 months ranged from ∼10% to 50%. However, some of this reduction may be due to residual confounding, i.e. to factors not included in the analysis (such as breastfeeding and maternal height). Furthermore, all but two of the studies in Table 1 used birth interval rather than interpregnancy interval, and thus there is the potential for bias if children born after a short interval were more likely to be of lower gestational age (only two studies using birth interval controlled for gestational age). Therefore, if children with lower gestational age subsequently have lower anthropometric status (e.g. stunting), this could bias the results.
In the child nutrition studies that examined both subsequent and previous birth interval, the link was somewhat more consistent for the former. This is consistent with the concept of kwashiorkor, a term from Ghana which refers to the poor nutritional condition of a child who has a younger sibling born within a short interval while the mother was still breastfeeding. However, without controlling for the duration of breastfeeding, it is difficult to know whether this link is directly attributable to the duration of the birth interval.
The studies on maternal anthropometric status do not provide clear evidence of a link with interpregnancy interval or recuperative interval. Three of the studies were conducted in the USA, and five were conducted in developing countries. Most of the studies used interpregnancy interval or recuperative interval (controlling for gestational age) in the analysis, but one used birth interval, which is less appropriate. The studies also differed in the time points at which maternal status was assessed, ranging from preconception to various times postpartum. The mechanisms governing maternal weight change during and after pregnancy are complex, and involve hormonal regulation of appetite, changes in physical activity and other physiological effects that are not well understood. For example, based on their findings, Winkvist et al. (1994) argue that nutrient partitioning between the mother and the offspring may be influenced by the mother’s nutritional status. They speculate that, when a mother is undernourished, more energy is partitioned to the mother, causing maternal weight gain at the same time that the infant is born with low birthweight. Conversely, mothers who are well nourished may partition more energy to the infant at their own expense. This calls into question the definition of ‘maternal depletion’. If based solely on deterioration in the mother’s nutritional status, without simultaneously considering the infant’s status, inappropriate conclusions may be drawn.
At the same time, viewing ‘recuperation’ of weight between pregnancies as a positive outcome deserves reconsideration in light of the global trend towards adult obesity, even in some developing countries. In this context, the finding by Herman & Yu (1997) that a longer interpregnancy interval is associated with a greater risk of maternal obesity, is of concern. Villamor and Cnattinguis (2006) recently reported that modest increases in BMI before pregnancy can increase the risk of perinatal complications, even if the woman does not become overweight. Thus, caution is needed with regard to encouraging weight gain between pregnancies. While maternal nutrient depletion can and does occur, encouraging a longer interval between pregnancies is not likely to be an effective means by which to prevent this outcome. Nutritional support for women before, during and after pregnancy, including advice to prevent obesity, is a more promising approach.
The results of the studies on maternal anaemia are also mixed. There may be an increased risk for maternal anaemia when interpregnancy interval is short, but it is important to control for iron supplementation during pregnancy before drawing conclusions. If the relationship is real, the mechanism is unclear, as it could be linked to third‐trimester bleeding and/or a shorter duration of breastfeeding during the interpregnancy interval (which lowers the risk of iron deficiency if accompanied by lactational amenorrhoea). None of the three studies included in the review measured iron status directly, relying instead on haemoglobin. Further research with additional indicators of iron status would help elucidate the nutritional risk associated with short interpregnancy intervals. No conclusions can be drawn about the relationship between interpregnancy interval and other micronutrient deficiencies, as only one study examined this question and the results were not significant.
This review has several limitations. First, there were few studies from industrialized countries, so the findings cannot be generalized to those contexts. Second, in many studies, evaluating the relationship between birth interval and maternal or child nutrition was not a primary objective, as birth interval was only one of many variables examined. While this may diminish the risk of publication bias, a drawback is that the studies often lacked sufficient information to adequately examine this relationship. For all three categories of outcomes, additional studies that include a more complete assessment of potentially confounding variables are needed to disentangle the complex set of factors involved in the relationship between birth spacing and maternal and child nutrition (as shown in the three conceptual models, 1, 2, 3). The extent to which nutritional interventions can ameliorate the potentially adverse consequences of short birth intervals is an important policy question.
Acknowledgements
We gratefully acknowledge the contribution of the expert librarians at the Academy for Educational Development’s Information Services, Eileen D’Andrea and Jennifer Gelman, in conducting the computerized literature search, and to Laurel Suiter and Juan Carlos Toscano, who obtained the requested articles from local libraries document retrieval services. Incisive comments on the first draft of this paper were provided by Linda Adair, Julie DaVanzo, Maureen Norton and Bao‐Ping Zhu. Paula Hollerbach was of great assistance in guiding the review process.
This paper was made possible through support provided by the Office of Population and Reproductive Health, Bureau for Global Health, U.S. Agency for International Development, under the terms of Award Nos. HRN‐A‐00‐00‐00003‐00 and GPO‐A‐00‐05‐00027‐00, to Pathfinder International. The opinions expressed herein are those of the authors and do not necessarily reflect the views of the U.S. Agency for International Development.
References
- Adair L.S. & Popkin B.M. (1992) Prolonged lactation contributes to depletion of maternal energy reserves in Filipino women. Journal of Nutrition 122, 1643–1655. [DOI] [PubMed] [Google Scholar]
- Adair S.‐R. (1993) Biological determinants of pregnancy weight gain: a longitudinal study of Filipino women. American Journal of Clinical Nutrition 57, 365–372. [DOI] [PubMed] [Google Scholar]
- Aerts D., Drachler M. & Giugliani E.R. (2004) Determinants of growth retardation in Southern Brazil. Cad Saude Publica 20, 1182–1190. [DOI] [PubMed] [Google Scholar]
- Afifi Z.E.M. (1985) Determinants of growth of infants in an Egyptian village: maternal anthropometry, birth interval, solid food and death of siblings. Human Biology 57, 649–658. [PubMed] [Google Scholar]
- Bertrand W.E., Mock N.B. & Franklin R.R. (1988) Differential correlates of nutritional status in Kinshasa, Zaire. International Journal of Epidemiology 17, 556–567. [DOI] [PubMed] [Google Scholar]
- Boerma J.T. & Bicego G.T. (1992) Preceding birth intervals and child survival: searching for pathways of influence. Studies in Family Planning 23, 243–256. [PubMed] [Google Scholar]
- Bøhler E. (1996) Short subsequent‐birth interval does not affect previous child’s nutritional status in the fifth year of life. Acta Paediatrica 85, 375–376. [DOI] [PubMed] [Google Scholar]
- Bøhler E. & Bergström S. (1995) Subsequent pregnancy affects morbidity of previous child. Journal of Biosocial Science 27, 431–442. [DOI] [PubMed] [Google Scholar]
- Bøhler E. & Bergström S. (1996) Child growth during weaning depends on whether mother is pregnant again. Journal of Tropical Pediatrics 42, 104–109. [DOI] [PubMed] [Google Scholar]
- Bøhler E., Singey J. & Bergstrom S. (1995) Subsequent pregnancy affects nutritional status of previous child: a study from Bhutan. Acta Paediatrica 84, 478–483. [DOI] [PubMed] [Google Scholar]
- Clark C.A.M. (1992) Demographic Socioeconomic Correlates of Infant Growth in Guatemala. Rand Corporation: Santa Monica, CA. [Google Scholar]
- Conde‐Agudelo A. & Belizán J.M. (2000) Maternal morbidity and mortality associated with interpregnancy interval: cross sectional study. British Medical Journal 321, 1255–1259. [DOI] [PMC free article] [PubMed] [Google Scholar]
- Conde‐Agudelo A., Rosas‐Bermudez A. & Kafury‐Goeta A.C. (2006) Birth spacing and risk of adverse perinatal outcomes: a meta‐analysis. Journal of the American Medical Association 295, 1809–1823. [DOI] [PubMed] [Google Scholar]
- Dewey K.G. (1997) Energy and protein requirements during lactation. Annual Review of Nutrition 17, 1936. [DOI] [PubMed] [Google Scholar]
- Dewey K.G. (2004) Impact of breastfeeding on maternal nutritional status In: Protecting Infants Through Human Milk: Advancing the Scientific Evidence Base (eds Pickering L.K., Morrow A.L., Ruiz‐Palacios G.M. & Schanler R.J.), pp 91–100. Kluwer Academic; /Plenum Publishers: New York. [Google Scholar]
- Farahati M., Bozorgi N. & Luke B. (1993) Influence of maternal age, birth‐to‐conception intervals and prior perinatal factors on perinatal outcomes. Journal of Reproductive Medicine 38, 751–756. [PubMed] [Google Scholar]
- Fletcher P.D., Simeon D.T. & Grantham‐McGregor S.M. (1992) Risk indicators of childhood undernutrition in Kingston, Jamaica. Transactions of the Royal Society of Tropical Medicine and Hygiene 86, 566–569. [DOI] [PubMed] [Google Scholar]
- Goldberg H. (1985) Proceedings of IUSSP International Conference in Florence: Birth Intervals and Undernutrition in Rural Senegal. Paper presented at International Population Conference June 5–12. Congres international de la population. Florence.
- Greene G.W., Smiciklas‐Wright H., Scholl T.O. & Karp R.J. (1988) Postpartum weight change: how much of the weight gained in pregnancy will be lost after delivery? Obstetrics and Gynecology 71, 701–707. [PubMed] [Google Scholar]
- Heinig M.J., Nommsen‐Rivers L.A., Peerson J.M. & Dewey K.G. (1994) Factors related to the duration of postpartum amenorrhoea among USA women with prolonged lactation. Journal of Biosocial Science 26, 517–527. [DOI] [PubMed] [Google Scholar]
- Herman A.A. & Yu K.F. (1997) Adolescent age at first pregnancy and subsequent obesity. Paediatric Perinatal Epidemiology 11, 130–141. [DOI] [PubMed] [Google Scholar]
- Huttly S.R.A., Victoria C.G., Barros F.C. & Vaughan V.P. (1992) Birth spacing and child health in urban Brazilian children. Pediatrics 89, 1049–1054. [PubMed] [Google Scholar]
- Institute of Medicine (1991) Nutrition During Lactation. National Academy Press: Washington, DC. [Google Scholar]
- Institute of Medicine (1997) Dietary Reference Intakes for Calcium, Phosphorus, Magnesium, Vitamin D and Fluoride. National Academy Press: Washington, DC. [PubMed] [Google Scholar]
- Institute of Medicine (1998) Dietary Reference Intakes for Thiamin, Riboflavin, Niacin, Vitamin B6, Folate, Vitamin B12, Pantothenic Acid, Biotin, and Choline. National Academy Press: Washington, DC. [PubMed] [Google Scholar]
- Institute of Medicine (2000) Dietary Reference Intakes for Vitamin C, Vitamin E, Selenium, and Carotenoids. National Academy Press: Washington, DC. [PubMed] [Google Scholar]
- Institute of Medicine (2001) Dietary Reference Intakes for Vitamin A, Vitamin K, Arsenic, Boron, Chromium, Copper, Iodine, Iron, Manganese, Molybdenum, Nickel, Silicon, Vanadium, and Zinc. National Academy Press: Washington, DC. [PubMed] [Google Scholar]
- Khan K.S., Chien P.F.W. & Khan N.B. (1998) Nutritional stress of reproduction – a cohort study over two consecutive pregnancies. Acta Obstetricia et Gynecologica Scandinavica 77, 395–401. [PubMed] [Google Scholar]
- King J.C. (2003) The risk of maternal nutritional depletion and poor outcomes increases in early or closely spaced pregnancies. Journal of Nutrition 133, 1732S–1736S. [DOI] [PubMed] [Google Scholar]
- Kurz K.M., Habicht J.‐P., Rasmussen K.M. & Schwager S.J. (1993) Effects of maternal nutritional status and maternal energy supplementation on length of postpartum amenorrhea among Guatemalan women. American Journal of Clinical Nutrition 1993, 636–640. [DOI] [PubMed] [Google Scholar]
- Madzingira N. (1995) Malnutrition in children under five in Zimbabwe: effect of socioeconomic factors and disease. Social Biology 42, 239–246. [DOI] [PubMed] [Google Scholar]
- Manun’ebo M.N., Haggerty P.A., Kalengaie M., Ashworth A. & Kirkwood B.R. (1994) Influence of demographic, socioeconomic and environmental variables on childhood diarrhoea in rural area of Zaire. Journal of Tropical Medicine and Hygiene 97, 31–38. [PubMed] [Google Scholar]
- Merchant K., Martorell R. & Haas J. (1990) Maternal and fetal responses to the stresses of lactation concurrent with pregnancy and of short recuperative intervals. American Journal of Clinical Nutrition 52, 280–288. [DOI] [PubMed] [Google Scholar]
- Miller J.E. & Huss‐Ashmore R. (1989) Do reproductive patterns affect maternal nutritional status? An analysis of maternal depletion in Lesotho. American Journal of Human Biology 1, 409–419. [DOI] [PubMed] [Google Scholar]
- Mozumder A., Barkat‐E‐Khuda Kane T.T., Levin A. & Ahmed S. (2000) The effect of birth interval on malnutrition in Bangladeshi infants and young children. Journal of Biosocial Science 32, 289–300. [DOI] [PubMed] [Google Scholar]
- Pathak P., Kapil U., Kapoor S.K., Saxena R., Kumar A., Gupta N. et al (2004) Prevalence of multiple micronutrient deficiencies amongst pregnant women in a rural area of Haryana. Indian Journal of Pediatrics 71, 1007–1014. [DOI] [PubMed] [Google Scholar]
- Pebley A.R. & DaVanzo J. (1993) Maternal Depletion and Child Survival in Guatemala and Malaysia. RAND Health: Santa Monica, CA. [Google Scholar]
- Popkin B.M., Guilkey D.K., Akin J.S., Adair L.S., Udry J.R. & Flieger W. (1993) Nutrition, lactation and birth spacing in Filipino women. Demography 40, 333–352. [PubMed] [Google Scholar]
- Rajaram S., Sunil T.S. & Zottarelli L.K. (2003) An analysis of childhood malnutrition in Kerala and Goa. Journal of Biosocial Science 35, 335–351. [DOI] [PubMed] [Google Scholar]
- Ricci J.A. & Becker S. (1996) Risk factors for wasting and stunting among children in Metro Cebu, Philippines. American Journal of Clinical Nutrition 63, 966–975. [DOI] [PubMed] [Google Scholar]
- Roy N.C. (2000) Use of mid‐upper arm circumference for evaluation of nutritional status of children and for identification of high‐risk groups for malnutrition in rural Bangladesh. Journal of Health, Population and Nutrition 18, 171–180. [PubMed] [Google Scholar]
- Russell M. (1976) The relationship of family size and spacing to the growth of preschool Mayan children in Guatemala. American Journal of Public Health 66, 1165–1172. [DOI] [PMC free article] [PubMed] [Google Scholar]
- Rutstein S.O. (2005) Effects of preceding birth intervals on neonatal, infant and under‐five years mortality and nutritional status in developing countries: evidence from the demographic and health surveys. International Journal of Gynecology and Obstetrics 89, S7–S24. [DOI] [PubMed] [Google Scholar]
- Sekiyama M. & Ohtsuka R. (2005) Significant effects of birth‐related biological factors on pre‐adolescent nutritional status among rural Sundanese in West Java, Indonesia. Journal of Biosocial Science 37, 413–426. [DOI] [PubMed] [Google Scholar]
- Singh K., Fong Y.F.A. & Arulkumaran S. (1998) Anaemia in pregnancy – a cross‐sectional study in Singapore. European Journal of Clinical Nutrition 52, 65–70. [DOI] [PubMed] [Google Scholar]
- Som S., Pal M., Bhattacharya B., Bharati S. & Bharati P. (2006) Socioeconomic differentials in nutritional status of children in the states of West Bengal and Assam, India. Journal of Biosocial Science 38, 625–642. [DOI] [PubMed] [Google Scholar]
- Sommerfelt A. (1991) Comparative Analysis of the Determinants of Children’s Nutritional Status. Paper presented at DHS World Conference, August 5–7, 1991. Washington, DC.
- Thaver I.H., Ebrahim G.J. & Richardson R. (1990) Infant mortality and undernutrition in the squatter settlements of Karachi. Journal of Tropical Pediatrics 36, 135–140. [DOI] [PubMed] [Google Scholar]
- Thuita F.M., Mwadime R.K.N. & Wang’ombe J.K. (2005) Child nutritional status and maternal factors in an urban slum in Nairobi, Kenya. East Africa Medical Journal 82, 209–215. [DOI] [PubMed] [Google Scholar]
- Villamor E. & Cnattinguis S. (2006) Interpregnancy weight change and risk of adverse pregnancy outcomes: a population‐based study. Lancet 368, 1164–1170. [DOI] [PubMed] [Google Scholar]
- Winkvist A., Rasmussen K.M. & Habicht J.‐P. (1992) A new definition of maternal depletion syndrome. American Journal of Public Health 82, 691–694. [DOI] [PMC free article] [PubMed] [Google Scholar]
- Winkvist A., Jalil F., Habicht J. & Rasmussen K.M. (1994) Maternal energy depletion is buffered among malnourished women in Punjab, Pakistan. Journal of Nutrition 124, 2376–2385. [DOI] [PubMed] [Google Scholar]
- Winkvist A., Rasmussen K.M. & Lissner L. (2003) Associations between reproduction and maternal body weight: examining the component parts of a full reproductive cycle. European Journal of Clinical Nutrition 57, 114–117. [DOI] [PubMed] [Google Scholar]