

Abstract
The weight gain chart for pregnant women, developed by Rosso and Mardones (RM chart, 1997), is analysed and compared with other charts in terms of its usefulness for targeting nutritional interventions aimed at preventing low or high birth weights. The RM chart defines categories of maternal nutritional status in early gestation based on weight/height, expressed either as percentage of standard weight (PSW) or body mass index (BMI), and desirable gestational weight gains for each of these categories. Weight gain recommendations of the RM chart are proportional to maternal height. For underweight women the weight recommendation was derived from actual data, while for overweight and obese women it is based on data extrapolations. Since 1987 the Chilean National Health Service has used the RM chart as a standard in prenatal care in all its clinics, covering approximately 70% of the country's population, mostly middle and low income women. During the 1987–2001 period the proportion of underweight pregnant women and infants with birth weight <3000 g decreased significantly and proportionally. Nevertheless, the proportion of obese pregnant women and infants with birth weight ≥4000 g increased during this period. Multifactorial social changes including a decade of substantial economic growth in the country with improved family income, precludes the possibility of determining the efficacy of the RM chart in this group. However, the widespread use of the RM chart indicates that it is a helpful and easy‐to‐use instrument in the field. Further, by its clear graphical presentation of maternal nutritional status it helps draw the attention of health personnel to women who need special nutritional advice and support.
Keywords: weight gain, chart, pregnancy
Introduction
Both maternal anthropometry and weight gain during pregnancy are important determinants of birth weight (Institute of Medicine 1990; Rosso 1990). In addition, given their sensitivity to weight and body image issues, women are likely to request advice about weight increment during pregnancy (Abrams et al. 2000).
In Chile, during the 1980s, we developed an instrument that classifies mothers according to their nutritional status allowing monitoring of adequacy of weight gain during gestation (Mardones and Rosso 1997). This instrument [the Rosso and Mardones (RM) chart], which is a development of a previous chart (Rosso 1985), enables the identification, at any gestational age, of mothers at risk of delivering either small or large for gestational age babies and sets weight gain goals for each individual mother. These goals can then be used by health personnel to monitor adequacy of weight gain and to provide either dietetic counselling or food supplements. The chart can be easily used in prenatal clinics of developing countries, and is currently used in several Latin America countries.
In the present paper, the usefulness of the RM chart in targeting interventions aimed at preventing low or high birth weights is analysed and the features which make it particularly useful in field conditions discussed. Birth weight of less than 3000 g is used to define small for gestational age infants. Weight‐for‐gestation charts and tables published by Lubchenco and many subsequent workers are frequently adopted to define small for gestational age infants, usually those below the 10th centile at a given gestation (Thomson 1983). The majority of infants diagnosed as small for gestational age or intrauterine growth retarded weigh less than 3000 g; cases most affected by maternal nutritional status and social conditions are those in the 2500–2999 category (Puffer and Serrano 1987). A birth weight of ≥4000 g defines macrosomic or large for gestational age infants. This concurs with other weight‐for‐gestation charts defining large for gestational age infants as those over the 90th centile at a given gestation. All infants diagnosed as large for gestational age fall within the birth weight of ≥4000 g in most texts (Thomson 1983).
The above mentioned birth weight categories carry increased mortality and morbidity risks during the first year of life (Institute of Medicine 1990). Further, there are other long‐term outcomes such as susceptibility to chronic disease in later life: ‘There is considerable evidence, mostly from developed countries, that intrauterine growth retardation is associated with an increased risk of coronary heart disease, stroke, diabetes and raised blood pressure. Large size at birth is also associated with an increased risk of diabetes and cardiovascular disease’ (World Health Organization 2003).
We discuss and comment on the joint evolution in Chile of maternal anthropometry and birth weight values between 1987 and 2001, following the adoption of the RM chart by the Chilean National Health Services. Many other factors may have influenced this evolution so it is not possible to identify the specific effects of the RM chart. However, observational and experimental studies are presented as favourable evidence for its use.
Anthropometry
The anthropometric characteristics of individuals reflect their body mass and the proportion of fat and lean tissue. Body weight and the proportion of fat or lean tissue are determined by the individual's energy balance so anthropometric measures are used to assess nutritional status (Garn 1962).
Body weight reflects the individual's size and is strongly influenced by height. For this reason, when nutritional status is assessed body weight is always expressed as weight‐for‐height. Currently, the two most widely used ways of expressing weight‐for‐height are body mass index (BMI) and percentage of standard weight (PSW). PSW is derived from adequacy of weight‐for‐height tables developed by a life insurance company (Metropolitan Life Insurance Company 1959).
These two indices are calculated as follows:
| PSW = observed weight × 100/desirable weight‐for‐height |
| BMI = weight (kg)/height2 (m) |
Desirable weight‐for‐height values were established statistically using life expectancy as the outcome (Society of Actuaries 1959a, 1959b). Based on this criterion, the limits of ‘normality’ are 90–110 PSW. Non‐pregnant women whose PSW is below 90 are considered to be underweight, those over 110 are considered to be overweight. Obesity is defined as a weight‐for‐height equivalent to 120% or more of standard weight. The 1959 Metropolitan Life Insurance Company's weight‐for‐height standards (Metropolitan Life Insurance Company 1959) are widely used in the United States (Institute of Medicine 1990), Latin America, including Chile, and many other countries (Mardones and Rosso 1997). However, more recently BMI is becoming widely used.
Body mass index ranges of normality for non‐pregnant women have been proposed using limits derived from the PSW tables (Institute of Medicine 1990). BMI is highly correlated with PSW and is essentially just a different way of presenting information about the relationship between weight and height (Working Group 1991).
Use of anthropometric measures in prenatal care
The recognition of the value of anthropometric indicators to predict pregnancy outcomes has generated great interest in this previously neglected field. Although many relevant research questions remain unanswered, a consensus has been reached regarding the usefulness of the anthropometric measures as described below.
Initial weight‐for‐height in gestation
Several studies have shown that pre‐pregnancy weight‐for‐height is significantly related to birth weight and gestational age at delivery (Institute of Medicine 1990; Rosso 1990; Working Group 1991; , Siega‐Ruiz et al. 1994). Thus, weight‐for‐height before pregnancy or in early pregnancy is considered useful for identifying women at nutritional risk.
Weight gain during pregnancy
Gestational weight gain reflects the growth of the conceptus and maternal physiological adjustments such as blood volume expansion, fluid retention, fat accumulation and, to a lesser extent, increases in lean tissue (uterus, mammary gland) (Hytten 1981). A large body of evidence indicates that gestational weight gain is a determinant of fetal growth (Institute of Medicine 1990; Abrams et al. 2000). Lower maternal net weight gain is associated with an increased risk of intrauterine growth retardation and increased perinatal mortality, whereas higher weight gain is associated with high birth weight and, secondarily, prolonged labour, shoulder dystocia, caesarean delivery, birth trauma and perinatal asphyxia (Institute of Medicine 1990; Parker and Abrams 1992).
Evidence shows that the effect of maternal weight gain on birth weight is modified by the mother's pre‐pregnancy weight‐for‐height. Thus, while low weight gain puts underweight women at a very high risk of delivering <3000 g birth weight infants, a similar low weight gain will have no demonstrable effect in obese women. On the other hand, a large weight gain will reduce the risk of underweight women of delivering growth retarded infants while in obese mothers it will only increase the maternal risk of hypertension, feto‐pelvic disproportion and gestational diabetes (Rosso 1990).
An adequate weight gain represents an important goal in prenatal care because of its influence on fetal growth and maternal health. Thus, health care providers should have access to easy‐to‐use instruments for setting desirable weight gain goals for each individual mother and for monitoring weight gain during the course of pregnancy.
Assessment of maternal nutritional status during the course of pregnancy
In prenatal clinics, or other settings where anthropometric instruments are available, assessment of maternal nutritional status should be based on weight‐for‐height and gestational weight gain. Accurate information of length of gestation, generally estimated using the date of the last menstrual period, is essential when applying these anthropometric measures.
Monitoring of maternal nutritional status during pregnancy is based on observed changes in body weight at the prenatal visits. These weight changes are assessed in relation to an expected or desirable weight gain for the entire period of gestation. Over time, the idea of desirable weight gain has undergone successive changes. Until the late 1960s and early 1970s US pregnant women were encouraged to restrict their weight gain to 8–9 kg (Lull and Kimbrough 1953). After the importance of maternal nutrition on fetal outcome was recognized the weight gain recommendation was increased to 11–12 kg in the US (Abrams et al. 2000).
A study of weight gain of Scottish primigravidas has greatly influenced concepts of spontaneous weight gain in a well‐fed white population (Thomson and Billewicz 1957). In this study, total weight gain between the end of the first trimester and term was a mean figure of 11.4 kg. Assuming that weight gain during the first trimester is on average approximately 1 kg (Hytten and Leicht 1971), it was concluded that the average woman gains 12.5 kg during pregnancy. Subsequently, and quite erroneously, this value was universally adopted as the desirable pregnancy weight gain and was recommended to all women independent of their height and pre‐pregnancy weight‐for‐height (Rosso 1990). This was the worldwide recommendation of international organizations for many years (World Health Organization 1973; 1985).
The need to define ‘average’ weight gain, considered so important until recently, is now of little practical value (Rosso 1990). When the independent influences of pre‐pregnancy weight and weight gain on birth weight were established it became apparent that underweight, normal weight and overweight women have different gestational weight gain requirements (Institute of Medicine 1990; Rosso 1990). Thus, it is now well accepted that the previous recommendation of gaining 11–12 kg is valid only for women of average height and normal weight‐for‐height. For other women a specific, individualized, weight gain target must be established at her first prenatal visit. Based on this weight gain goal, the health care providers should counsel the mother with respect to diet and the best use of available foods.
Weight gain charts
Several charts and tables establishing weight gain goals and monitoring weight changes are available (Institute of Medicine 1990; Rosso 1990). The earliest models did not take into consideration maternal pre‐pregnancy weight and, following criteria accepted at that time, recommended a similar weight gain for all women (Oregon WIC Staff 1981; Butman 1982). The most recent charts incorporate maternal pre‐pregnant weight and establish different weight gain targets for underweight, normal and overweight mothers. Some of these charts do not take into consideration maternal height and therefore recommend similar weight gain goals to women of very different heights (Oregon WIC Staff 1981; Dimperio 1988). Consequently, short and tall women are recommended to gain proportionately more or less weight, respectively, than average height women.
One of the charts developed by us (Rosso 1985), solved previous inconsistencies in the application of weight recommendations to women of different heights by expressing all weight gain recommendations as PSW. Nevertheless, the sample size of that study was too small to allow individualized weight gain recommendations in some of the subcategories of maternal nutritional status at the beginning of pregnancy. A new study with a larger sample size allowed the design of a subsequent chart (Mardones and Rosso 1997).
A review of the various available charts and tables by an expert subcommittee of the USA Institute of Medicine (IOM) concluded that additional research was needed to validate some of the concepts and recommendations of the various charts, including the classification of women as underweight, of normal weight and overweight (Institute of Medicine 1990).
The subcommittee designed weight gain guidelines by pre‐pregnancy BMI. These are known as the ‘IOM's recommended weight‐gain ranges’ (Institute of Medicine 1990). This proposal included the following aspects: (1) the use of different charts for underweight, normal weight and overweight women (BMI < 19.8, 19.8–26.0, 26.1–29.0, and > 29.0, respectively); and (2) the expression of the total weight gain recommendation in absolute values with upper and lower limits for each of the charts with the exception of the last one (12.5–18.0 kg, 11.5–16.0 kg, 7.0–11.5 kg, and ≥7.0 kg, respectively) (Institute of Medicine 1992).
The cut‐off points are similar to those widely used for non‐pregnant women: 90, 120 and 135% of the 1959 Metropolitan Life Insurance Company's weight‐for‐height standards (Institute of Medicine 1990). However, unlike the RM chart explained below, those cut‐offs were not validated against pregnancy outcomes. Further, the recommendations of the subcommittee for the IOM chart are questionable because of the worldwide variability of individual women's heights (Krasovec and Anderson 1991). By expressing weight gain in absolute values the recommendation does not consider proportionality of recommended weight gain for short and tall women. The inclusion in the chart of upper and lower limits of normality does not solve the problem. On the contrary, it introduces another source of error in judging adequacy of weight gain in a given mother. For example, for underweight women it sets a weight gain target ranging from 12.5 to 18 kg. For a very underweight tall woman a 12.5 kg weight gain may be too low. However, for a slightly underweight short woman a total weight gain of 18 kg is probably unnecessarily high. In this respect, although the IOM recommendations could be useful to assess adequacy of weight gain in a group of underweight women of different heights, they are inadequate to monitor weight gain in an individual mother. The same criticism obtains for the weight gain recommendation for normal and overweight women.
The IOM's guidelines have been introduced in the USA (Institute of Medicine 1992; Abrams et al. 2000) and Canada (Health Canada 1999). Some studies have examined their possible impact on maternal weight gain during pregnancy and on some perinatal outcomes. Evaluations should ideally have an experimental design, which compares randomly selected groups. Experimental studies have many practical difficulties so most evaluations have been done comparing cohorts of pregnant women without randomization. Cohort studies, including those with a large sample sizes, have shown favourable results in women following IOM weight gain chart guidelines (Parker and Abrams 1992; Siega‐Ruiz et al. 1994). A recent review of observational studies that examined fetal and maternal outcomes according to IOM's weight gain recommendations in women with a normal pre‐pregnancy weight concluded that the IOM's recommended ranges are associated with the best outcome for both mothers and infants (Abrams et al. 2000). A more recent experimental evaluation concluded that the use of the IOM's weight ranges, accompanied by an educational intervention, results in favourable maternal weight changes during pregnancy (Polley et al. 2002).
The educational intervention in this USA study was done at the hospital obstetric clinic following the determination of BMI > 19.8 by a clinical professional (Polley et al. 2002). The intervention consisted of oral and written information concerning: (1) appropriate weight gain; (2) exercise; and (3) healthy eating. Individual counselling sessions included: (1) review of weight gain chart; (2) assessment of current eating and exercise (i.e. a 24‐h recall or examination of self‐monitoring records), with periodic computerized nutrition analysis; (3) review of progress towards behavioural goals; (4) problem‐solving; (5) instructions in the use of behavioural techniques such as stimulus control or self‐monitoring; and (6) goal‐setting for eating and exercise behaviours.
A weight gain standard designed in Chile
The RM chart has been used in Chile since 1987 to monitor weight gain during pregnancy. Besides Chile, other Latin American countries, i.e. Argentina, Brazil, Ecuador, Panama, and Uruguay, have also been using this weight gain chart in their prenatal care programs (Mardones and Rosso 1997) whilst Colombia, Costa Rica and Peru, have been using it in experimental programs. The mean height of Chilean women is similar to the mean height of women in most Latin American countries (Krasovec and Anderson 1991).
The RM chart has gestational age on the horizontal axis and maternal body weight, expressed as PSW, on the vertical axis (Fig. 1). Areas of different colours are used to classify adequacy of weight‐for‐height for those underweight, of normal weight and overweight and obese mothers (Mardones and Rosso 1997). The estimation of PSW is derived from an easy to use nomogram (Fig. 2) (Rosso 1985). PSW determined in this way is much more precise than BMI from available monograms, as the PSW scale is much larger.
Figure 1.
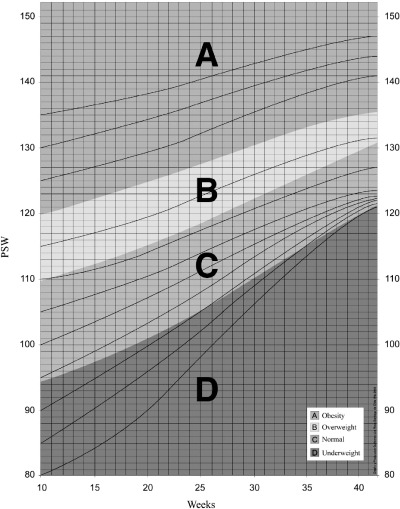
The Rosso and Mardones chart for guiding weight gain during pregnancy (modified from Mardones and Rosso 1997). Weight for height is expressed as percentage of standard weight (PSW).
Figure 2.
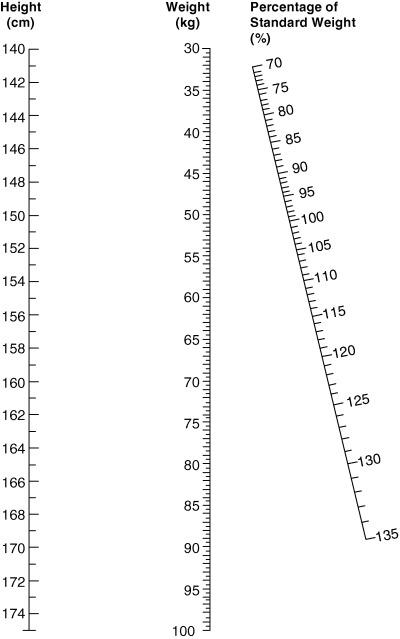
Nomogram to determine adequacy of weight for height and to calculate desirable total weight gain during pregnancy (Rosso 1985). Reproduced with permission by the American Journal of Clinical Nutrition© Am J Clin Nutr. American Society of Clinical Nutrition.
We also designed this chart using BMI (Fig. 3) after demonstrating that PSW has a correlation coefficient of nearly 1 with BMI in the original database (Mardones et al. 1999) in agreement with previous research (Working Group 1991).
Figure 3.
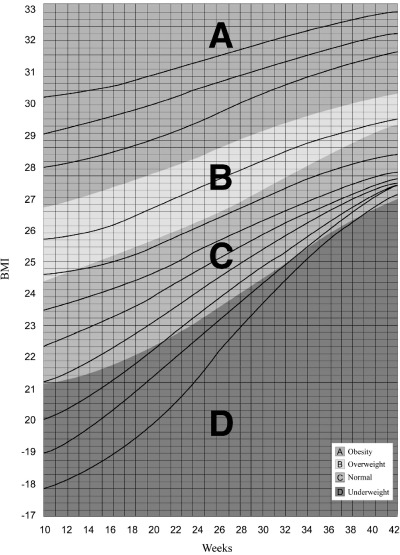
The Rosso and Mardones chart for guiding weight gain during pregnancy (modified from Mardones et al. 1999). Weight for height is expressed as body mass index (BMI).
The weight/height limits, which classify the individuals as normal, underweight, overweight and obese, were determined using actual data from 1745 healthy adult women delivering their singleton babies at 39–41 weeks of gestation (Mardones and Rosso 1997). Women in this study were enrolled in the prenatal clinics of the south‐east health zone of Santiago, Chile. Inclusion criteria were: 20 years old and older, para 0–5, non‐smokers, non‐consumers of alcoholic beverages and free of obstetric and medical complications known to affect fetal growth. Only babies delivered at 39–41 weeks of gestation were included in the first analysis (Mardones and Rosso 1997) because, if birth weight is between 3 and 4 kg, they are thought to be optimally grown (Institute of Medicine 1990). This population was ethnically mixed, i.e. Amerindian and Hispanic ancestry, and socio‐economically mixed, i.e. 86% from the low income group covered by the public health sector (70% of the total Chilean population) and 14% from a middle income population (Mardones and Rosso 1997). Weight/height limits at weeks 10 and 40 of gestation for both PSW and BMI are shown in Table 1.
Table 1.
BMI and PSW cut‐offs points of the RM chart for the nutritional classification of women at the beginning and at the end of pregnancy (Mardones and Rosso 1997; Mardones et al. 1999)
| BMI | PSW | |
|---|---|---|
| Week 10 | ||
| Underweight | <21.15 | <95 |
| Normal | 21.15–24.49 | 95–109 |
| Overweight | 24.5–26.73 | 110–119 |
| Obese | >26.73 | >120 |
| Week 40 | ||
| Underweight | <26.55 | <119.2 |
| Normal | 26.55–28.9 | 119.2–129.7 |
| Overweight | 28.91–30.03 | 129.8–134.7 |
| Obese | >30.03 | >134.8 |
BMI, body mass index; PSW, percentage of standard weight; RM, Rosso and Mardones.
The critical body mass has been defined when designing the RM chart as the weight‐for‐height area during gestation at which the resulting mean birth weight is similar to the mean birth weight of a healthy population of pregnant women (Mardones and Rosso 1997). This area is equivalent in the RM chart to the diagnosis of weight in the normal range, shown as the green area in 1, 3. Women in the normal range at the beginning and at the end of pregnancy delivered newborns with birth weight 3455 ± 383 g (Mean ± SD) and 3450 ± 363 g (Mean ± SD), respectively; values which were very similar to the figure for the entire population: 3428 ± 398 g (Mean ± SD) (Mardones and Rosso 1997). Malnutrition diagnoses (Table 1) increase the risk of delivering infants of birth weight <3000 g or ≥4000 g (2, 3).
Table 2.
Odd ratios (OR) and confidence intervals (CI 95%) for birth weights <3000 g in low weight women diagnosed by the Rosso and Mardones (RM) chart at the beginning and at the end of pregnancy (Mardones et al. 1999) (n = 1745 women)
| OR | CI 95% | |
|---|---|---|
| Week 10 | ||
| Underweight | 1.650 | 1.414–1.925 |
| Normal | 1 | |
| Week 40 | ||
| Underweight | 1.734 | 1.493–2.015 |
| Normal | 1 | |
Table 3.
Odd ratios (OR) and confidence intervals (CI 95%) for birth weights ≥4000 g in overweight and obese women diagnosed by the Rosso and Mardones (RM) chart at the beginning and at the end of pregnancy (Mardones et al. 1999) (n = 1745 women)
| OR | CI 95% | |
|---|---|---|
| Week 10 | ||
| Normal | 1 | |
| Overweight | 1.395 | 1.249–1.557 |
| Obese | 2.311 | 1.751–3.050 |
| Week 40 | ||
| Normal | 1 | |
| Overweight | 1.310 | 1.212–1.417 |
| Obese | 2.171 | 1.735–2.716 |
These data validate previous recommendations that maternal weight‐for‐height at term should be at least equivalent to PSW 120 (BMI 26.6) (Rosso 1985). Pregnant underweight women who were able to reach this goal had infants significantly heavier than women whose body mass increment remained below this value. A similar conclusion reached in black and Hispanic women living in the US suggests that the proposed limit is valid across some ethnic and cultural boundaries (Hickey et al. 1990). However, this information does not invalidate the need to determine whether the chart's weight recommendations are more universally applicable, as suggested by other authors (Gueri et al. 1982).
For the Chilean population included in this study the critical initial weight‐for‐height was established as PSW 95 (BMI 21.15), a value somewhat higher than the traditional limit of PSW 90 to define being underweight in a non‐pregnant woman.
Actual weight increments in underweight women who reached the green area at the end of pregnancy were used to design ‘channels’ to guide ideal weight gain; see in 1, 3 lines that begin at week 10 of gestation in the subcategories of PSW. Weight gain channels for overweight and obese women are tentative as in the original population most such women did not reach the green area at the end of pregnancy. Therefore, and assuming that pregnancy is not a time for dieting nor to aggravate a pre‐existing obesity, the corresponding ‘desirable’ weight increment channels were designed based on the physiological weight changes that take place during a normal pregnancy (Niswander 1981).
The RM chart is only valid in fully grown women with singleton pregnancies. Its use in adolescent pregnancies remains to be determined. The height and weight ranges included in the nomogram (140–170 cm and 30–100 kg) preclude its use in women who exceed these values. In order to include this population the nomogram should be modified and validated.
Attendance at clinics for antenatal visits where they can be weighed may not be possible in every part of the world. Pharmacies or markets, where appropriate equipment for weight/height calculations may be available, could be alternatives.
The RM chart starts at week 10 of gestation. Weight gain is modest in the first weeks of pregnancy and women frequently present for their initial pregnancy check‐up at around 10 weeks of gestation, when use of the chart is appropriate. In addition, women who present to health care services later than others can easily be allocated into specific weight/height categories in the RM chart and still be guided along their weight increment.
The mean maternal weight gain, 12.6 ± 6.1 kg (mean ± SD) observed in the entire sample of low income Chilean women used to derive the RM chart is higher than figures reported for other developing countries (Schieve et al. 1998). This may be partially due to the inclusion and exclusion criteria that eliminated gravid women with medical and obstetric complications. Also nutritional status and other maternal factors, such as heavy manual work, may have been better in the Chilean women than in those of low income populations from other countries reported in the literature. Mean maternal weight gain of women in the green area of the RM chart, corresponding to normal nutritional status, was 12.7 ± 5.2 kg (mean ± SD), a similar figure than the total study group.
Mean birth weight at term (3428 ± 398 g) was also higher in this study than that reported in most developing countries (Puffer and Serrano 1987). This difference can be attributed to exclusion criteria leading to a greater maternal weight gain and the absence of maternal complications. Mean birth weight in healthy populations would be affected mainly by the proportions of underweight and obese women or the mean PSW at the end of pregnancy (Rosso 1991), so use of the chart elsewhere is appropriate from this point of view.
Recent information from Chile
The Chilean National Health Services adopted the RM chart in 1987 and information on maternal nutritional status, as classified by the chart, is now available for the entire country. Annual proportions of pregnant women, mostly middle and low income women, in the different weight‐for‐height categories are reported from women at different gestational ages taken in the month of December during routine check‐ups. National data are available for the 1987–2001 period for live births, including information on birth weight; live births with missing data on birth weight were only 1.52% of the total in 1987 and 0.10% in 2001. Unfortunately, the combined registration of birth weight and maternal nutritional status for each individual live birth is lacking.
The 30% of women attending private health services and the military health services belong to a wealthier population than the 70% of women under the national public health service (National Health Fund 2003). Generally national health information is not registered according to the specific health system of each patient. Nevertheless, most national health indices are considered representative of the 70% and vice versa as the remaining 30% would alter the overall data very little (Rajs 2004). In spite of this consideration, the prevalence report for the month of December each year is a mixture of women entering check‐ups for the first time and women being monitored during pregnancy with two or more check‐ups. This fact does not allow for conclusions regarding the possible RM chart effect; the former would be the expression of the pre‐pregnancy influences and the latter would be mostly affected by the pregnancy period including the RM chart possible effect. Furthermore, the occurrence of many other changes associated with a decade of substantial economic growth in the country and improved family income, prevents the possibility of drawing any conclusion with respect to the efficacy of the use of the RM chart. For example, the population living below the poverty line declined from over 40% at the end of the 1980s to 20.6% in 2000 (Ministry of Planning 2000). For all these reasons Chile is now considered to be in the phase of nutritional transition (Albala et al. 2002).
Although the previous comments preclude conclusions to be drawn on the possible association between national anthropometric changes and the use of the RM chart, the evolution of maternal nutritional status and specific birth weight categories between 1987 and 2001 are important demographic changes, as discussed below. Observational and experimental studies on the possible impact of using the RM chart are also discussed.
Maternal underweight diagnosis and birth weight <3000 g
During the observation period, the proportions of infants of birth weight <3000 g and underweight pregnant women have decreased at similar rates. In 1987 the incidence of birth weight <3000 g was 26.4% and the prevalence of underweight pregnant women was 25.7%. By contrast, in 2001 the incidence of birth weights <3000 g was 20.2% and the proportion of underweight pregnant women was 13.3% (National Institute of Statistics, Chile 1987–2001; Ministry of Health, Nutrition Unit 2002). Thus, a 23.5% reduction of birth weight <3000 g and a 48% reduction of underweight pregnant women have been observed.
Most infants diagnosed as intrauterine growth retarded fall within birth weight range <3000 g (Puffer and Serrano 1987), which in Chile results in an infant mortality rate of approximately 20 per thousand live births, double the national figure (National Institute of Statistics, Chile 1987–2001). Between 1987 and 2001 the percentage for birth weight <2500 g decreased from 6.5% to 5.3%. Thus, the drop in the percentage of <3000 g birth weight babies observed in the same period mostly reflects a decrease in the 2500–2999 g babies category. Some authors consider that the change in this category is linked to maternal social and nutritional factors (Puffer and Serrano 1987).
Being underweight during pregnancy, as defined by the RM chart, triggers a special education package to improve home diet. Although financial restriction may limit the improvement of the caloric and protein intake of the home, the educational intervention has been shown to be effective in an observational study (Durán et al. 1999). This national educational intervention is initiated by diagnosis of being underweight, overweight or obese during the regularly scheduled clinic visits, usually overseen by midwives. The women are then sent to a nutritionist in the same health clinic who performs a 24‐h dietary recall and a food‐frequency questionnaire. She then advises appropriate weight gain during pregnancy, i.e. following the RM chart ‘channels’ of weight gain, to be achieved by healthy eating and sometimes exercise.
This improvement in dietary intake is supported by the greater contribution of food through the National Food Supplementation Program (NFSP). The NFSP delivers 2 kg of powdered milk and 2 kg of rice monthly to underweight pregnant women; other women receive just 1 kg of powdered milk.
Observational studies conclude that this intervention in underweight mothers has a positive association with maternal food intake, weight gain, and the incidence of birth weights <3000 g (Robinovitch et al. 1995; Durán et al. 1999; Mardones 2003). Nevertheless, other factors could have influenced the favourable results in those observational studies. Therefore, a causal association with the observed reduction of birth weight <3000 g needs the additional proof of experimental or quasi‐experimental studies.
Data from an experimental study conducted in Chile support the possibility of a positive effect of multimicronutrient fortification of powdered milk on mildly undernourished women such as those in the PSW category 90–94 (Mardones‐Santander et al. 1988). Underweight pregnant women, as defined by the RM chart, entered the study at 14.4 ± 3 (mean ± SD) weeks of gestation with PSW 90 ± 6 (mean ± SD). The standard 26% fat milk powder used in the national program was delivered to the control group. The experimental group received a supplement consisting of milk powder fortified with micronutrients. At the end of pregnancy the mean PSW in the control group was 111, whereas in the experimental group it was 112.7. The incidence of a birth weight <3000 g was 39.9% in the control group and 32.5% in the experimental group (P < 0.05). On average, neither group reached the ‘critical body mass’ and they gained 12.3 kg ± 4.6 kg and 11.3 kg ± 5.2 kg (P < 0.05) in the experimental and control groups, respectively. Nevertheless, the wide SD for weight gain suggests that some of them, especially in the experimental group, may have reached the critical body mass supporting the improved fetal growth.
The multimicronutrient fortified milk used in the Santiago study had 43 mg of iron sulfate per 100 g of powder (Mardones‐Santander et al. 1988); this amount of iron made this product susceptible to fat oxidation inhibiting the introduction of similarly fortified powdered milks in Chile. New products that use aminochelated iron are recently available permitting similar iron fortification without technological problems (Mardones et al. 2004). The majority of Latin American countries using the graph are providing non‐fortified powdered milk to pregnant women.
Ethically it is not possible to perform an experiment with a control group not receiving the food supplement, however, a de facto analogous group comprised spontaneous non‐consumers of milk during pregnancy (Mardones‐Santander et al. 1988). This quasi‐experimental comparison showed a positive association between food supplements consumption and birth weight. The proportions of birth weight <3000 g were 39.9% and 61%, respectively, among consumers and non‐consumers of the regular food supplement. Women suffering from lactose intolerance have a variable prevalence among different populations. Possibly the majority of the 10% of women who did not consume milk in the Santiago study suffered from lactose intolerance. This aspect is not important for the possible efficacy of this kind of intervention because most dairy companies nowadays produce lactose free powdered milk.
Positive cost‐effect benefit of the experimental and the quasi‐experimental results have been calculated (Mardones and Zamora 1990; Mardones‐Santander et al. 1991).
Micronutrient supplementation during pregnancy ‘has been paid little attention until the late 1990s, except for the constant concern about the high prevalence of maternal iron deficiency’ (United Nations Administrative Committee on Coordination, Sub‐Committee on Nutrition 2000a). A recent review has concluded that the Santiago study was one of only four trials on dietary supplementation to have successfully reduced or prevented low birth weight (United Nations Administrative Committee on Coordination, Sub‐Committee on Nutrition 2000b). We have compared nutritional interventions preventing intrauterine growth retardation, as published by De Onis and colleagues (De Onis et al. 1998), with the outcomes of the Santiago study, concluding that our results were the best in preventing intrauterine growth retardation (Mardones‐Santander et al. 1999; Mardones‐Santander et al. 2000).
Nutritional supplementation with micronutrients for mildly underweight women seems justified. In frankly or greatly underweight women it might be expected that a high caloric supplement would have a greater effect, as concluded from the results of the Gambia study (United Nations Administrative Committee on Coordination, Sub‐Committee on Nutrition 2000b). With regard to the possible mechanisms of the effect on intrauterine growth restriction, we have proposed that the micronutrient content of the fortified milk powder may lead to higher fluid retention and greater plasma volume expansion. This higher plasma volume expansion may favourably influence fetal growth (Rosso and Salas 1994), a view shared by others for the Santiago study (Institute of Medicine 1990; Susser 1991). In fact, women in the experimental group in our study gained, on average, 1 kg more during pregnancy than women in the control group. Nevertheless, this weight difference disappeared 24–48 h after delivery, probably explained by higher fluid retention. We have also demonstrated that maternal body water, and therefore fat‐free‐mass, near term is the most important variable influencing birth weight (Mardones‐Santander et al. 1998).
A substantial proportion of women in both developed and underdeveloped countries have diets with lower than recommended amounts of certain micronutrients which have been associated with pregnancy outcome. The absence of these micronutrients, either because of poor diet or impaired absorption, may influence these mechanisms.
Maternal overweight and obese diagnoses and birth weight ≥4000 g
Chile had a national incidence of 6.05% for birth weight ≥4000 g in 1987 and 10.7% in 2001 (National Institute of Statistics et al. 1987–2001). Over the same period, estimated annual overweight and obese pregnant women numbers in the public health system have increased from 18.8% and 12.9%, respectively, in 1987, to 21.8% and 32.6% in 2001 (Ministry of Health, Nutrition Unit 2002). Therefore, the combined prevalence for overweight and obese pregnant women has increased from 31.7% to 54.4%.
The increases over time in birth weight ≥4000 g, in being overweight and in obese women proportions are relatively similar. Nevertheless, the proportion of birth weights ≥4000 g is small in comparison with the above mentioned proportion of malnutrition; this observation about macrosomic births has been described elsewhere (Lu et al. 2001).
Being overweight or obese also triggers an educational intervention with a smaller contribution of food through the NFSP, which delivers just 1 kg of powdered milk per month to these women. The policy of delivering less milk to overweight or obese women could simply worsen dietary quality rather than decreasing weight gain. Nevertheless, the educational intervention, has been shown to be successful in reducing caloric consumption (Durán et al. 1999).
The annual prevalence of overweight or obese pregnant women has continued to grow. The increase in obesity has been described around the world and has been shown to be a modern epidemic (Albala et al. 2002). For example, in Birmingham, USA, data from 53 080 pregnant women has shown that the proportion with a BMI > 29 at the first prenatal visit increased from 16.3% in 1980 to 36.4% in 1999 (Lu et al. 2001). As the BMI cut‐off for obesity is close to 27 at the beginning of pregnancy on the RM chart, it seems that obesity figures diagnosed with a more stringent criterion in the USA are much higher than in Chile. Evidently, the proportion of obese women has more than doubled as has similarly been observed in Chile. The high figures observed both in Chile and in Birmingham, USA, are probably influenced by the obesity rise of the general population in the pre‐pregnant period. On the other hand, large‐for‐dates infants increased in Birmingham from 11.5% to 13.9%, a lower proportion than the change in maternal nutritional status; this observation is similar to what happened in Chile relating to birth weight ≥4000 g.
The limited influence of obesity on macrosomic births may be due to different factors. Overweight and obese pregnant women attending the public health system in Chile frequently have low amounts of micronutrients in their diet (Durán et al. 1999) and anaemia is also observed in this group (Mardones et al. 2003b). These factors could lead to reduced fetal growth, as proposed by Allen and Gillespie (United Nations Administrative Committee on Coordination, Sub‐Committee on Nutrition 2000b) and also by Barker using data from Finland (Forsen et al. 1997; Barker 1998). Indeed they contribute to the incidence of term birth weight <3000 g in Chile (Robinovitch et al. 1995; Mardones and Rosso 1997). Alternatively, it has been observed that overweight and obese women have more preterm deliveries, mostly from caesarean sections, than women with normal weight/height (Robinovitch et al. 1995; Lu et al. 2001; Young and Woodmansee 2002). These preterm deliveries have reduced weight at birth (Silva et al. 2001). These possibilities could partially explain the less than expected rise in birth weights ≥4000 g, particularly as Chile had the highest caesarean section rate (40% in 1997) of 12 Latin America countries studied (Belizan et al. 1999).
Overweight and obese mothers at the end of pregnancy, as defined by the RM chart, may increase the cardiovascular mortality risk in their male offspring when adults, as observed in Finland (Forsen et al. 1997).
Conclusions
There is convincing evidence that the effect of maternal weight gain on birth weight is influenced by the mother's pre‐pregnancy weight‐for‐height. Thus, efforts to prevent malnutrition in pregnant women should begin well before conception. Because of its influence on fetal growth and maternal health, an adequate weight gain represents an important goal of prenatal care.
Over time the definition of desirable weight gain has undergone successive changes. When the independent influences of pre‐pregnancy weight and weight gain on birth weight were established it became apparent that underweight, normal weight and overweight women require different weight gains. Thus, it is now well accepted that the previous recommendation of gaining 11–12 kg is valid only for women of average height and normal weight‐for‐height. For other women a specific, individualized, weight gain target must be established at her first prenatal visit.
It is concluded that a chart for pregnancy weight gain based on weight‐for‐height, using PSW or BMI, is better in practice than simple recommendations for target amount to gain, as it accounts for the differences in women's size. The RM chart fits this need because its weight gain recommendations are proportional to maternal height.
The RM chart has been used in Chile since 1987 and since the 1990s, in other Latin American countries. There has been an undoubted improvement in both maternal anthropometry and birth weight values in Chile between 1987 and 2001. However, the presence of many other influencing factors preclude reaching specific conclusions on the possible effect of the RM chart. However, other Chilean observational and experimental studies do lend evidence as to the favourable effects of its use.
The RM chart can be used around the world, because it covers most of the maternal height range. Nevertheless, we suggest validation studies be undertaken in countries where women have different maternal heights or body frames from Chilean women, in whom the chart's weight recommendations have been demonstrated as applicable.
References
- Abrams B., Altman S.L. & Pickett K.E. (2000) Pregnancy weight gain: still controversial. American Journal of Clinical Nutrition 71(Suppl.), 1233S–1241S. [DOI] [PubMed] [Google Scholar]
- Albala C., Vio F., Kain J. & Uauy R. (2002) Nutrition transition in Chile: determinants and consequences. Public Health Nutrition 5, 123–128. [DOI] [PubMed] [Google Scholar]
- Barker D.J.P. (1998) Mother, Babies and Health in Later Life, 2nd edn Churchill Livingstone: Edinburgh. [Google Scholar]
- Belizan J.M., Althabe F. & Barros F.C. (1999) Rates and implications of caesarean sections in Latin America: ecological study. British Medical Journal 319, 1397–1400. [DOI] [PMC free article] [PubMed] [Google Scholar]
- Butman M. (1982) Prenatal Nutrition: A Clinical Manual. WIC Program. Massachusetts Department of Public Health: Boston. [Google Scholar]
- De Onis M., Villar J. & Gülmezoglu M. (1998) Nutritional interventions to prevent intrauterine growth retardation: evidence from randomized controlled trials. European Journal of Clinical Nutrition 52, S1, S83–S93. [PubMed] [Google Scholar]
- Dimperio D. (1988) Prenatal Nutrition: Clinical Guidelines for Nurses. March of Dimes Birth Defects Foundation: White Plains, NY. [Google Scholar]
- Durán E., Soto D., Asenjo G., Pradenas F. & Quiroz V. (1999) Diet evaluation during pregnancy and its relation to nutritional status (Evaluación de la dieta de embarazadas de área urbana y su relación con el estado nutricional). Revista Chilena de Nutricion 26, 62–69. [Google Scholar]
- Forsen T., Ericksonn J.G., Tuomilehto J., Teramo K., Osmonde C. & Barker D.J.P. (1997) Mother's weight in pregnancy and coronary heart disease in a cohort of Finnish men: follow up study. British Medical Journal 315, 837–884. [DOI] [PMC free article] [PubMed] [Google Scholar]
- Garn S.M. (1962) Anthropometry in clinical evaluation of nutritional status. American Journal of Clinical Nutrition 11, 418–432. [DOI] [PubMed] [Google Scholar]
- Gueri M., Jutsum P. & Sorhaindo B. (1982) Anthropometric assessment of nutritional status in pregnant women: a reference table of weight‐for height by week of pregnancy. American Journal of Clinical Nutrition 35, 609–616. [DOI] [PubMed] [Google Scholar]
- Health Canada (1999) Nutrition for a Healthy Pregnancy: National Guidelines for the Childbearing Years. Minister of Public Works and Government Services Canada: Ottawa. [Google Scholar]
- Hickey C.A., Uauy R., Rodriguez L.M. & Jennings L.W. (1990) Maternal weight gain in low‐income Black and Hispanic women: evaluation by use of weight‐for‐height near term. American Journal of Clinical Nutrition 52, 938–943. [DOI] [PubMed] [Google Scholar]
- Hytten F.E. (1981) Weight gain in pregnancy In: Clinical Physiology in Obstetrics (eds Hytten F.E. & Chamberlain G.), pp 193–233. Blackwell: Oxford. [Google Scholar]
- Hytten F.E. & Leicht I. (1971) The Physiology of Human Pregnancy. Blackwell: Oxford. [Google Scholar]
- Institute of Medicine National Academy of Sciences (1990) Nutrition During Pregnancy. National Academy Press: Washington, DC. [Google Scholar]
- Institute of Medicine National Academy of Sciences (1992) Nutrition During Pregnancy and Lactation. An Implementation Guide. National Academy Press: Washington, DC. [Google Scholar]
- Krasovec K. & Anderson M.A. (1991) Appendix B: mean height weight, and body mass index of nonpregnant women 18 years of age or more in developing countries and the U.S In: Maternal Nutrition and Pregnancy Outcomes. Scientific Publication N° 529 (eds Krasovec K. & Anderson M.A.), pp 208–211. Pan American Health Organization: Washington, DC. [Google Scholar]
- Lu G.C., Rouse D.J., Dubard M., Cliver S., Kimberlin D. & Hauth J.C. (2001) The effect of the increasing prevalence of maternal obesity on perinatal morbidity. American Journal of Obstetrics and Gynecology 185, 845–849. [DOI] [PubMed] [Google Scholar]
- Lull C.V. & Kimbrough R.A. (1953) Clinical Obstetrics. Lippincott: Philadelphia. [Google Scholar]
- Mardones F. (2003a) Evolution of maternal anthropometry and birth weight in Chile, 1987–2000 (Evolución de la antropometría materna y del peso de nacimiento en Chile, 1987–2000). Revista Chilena de Nutricion 30, 122–131. [Google Scholar]
- Mardones F., Rioseco A., Ocqueteau M., Urrutia M.T., Javet L., Rojas I. et al. (2003b) Anaemia in pregnant women of Puente Alto, Chile (Anemia en las embarazadas de Puente Alto, Chile). Revista Médica de Chile 131, 520–525. [PubMed] [Google Scholar]
- Mardones F. & Rosso P. (1997) Design of a weight gain chart for pregnant women (Diseño de una curva patrón de incrementos ponderales para la embarazada). Revista Médica de Chile 125, 1437–1448. [PubMed] [Google Scholar]
- Mardones F., Rosso P., Marshall G., Villarroel L. & Bastías G. (1999) Comparison of two weight‐for‐height indices in pregnant women (Comparación de dos indicadores de la relación peso‐talla en la embarazada). Acta Pediátrica Española 57, 501–506. [Google Scholar]
- Mardones F., Urrutia M.T., Villarroel L., Rioseco A., Bastias G., Castillo O., et al. (2004) Fetal growth in underweight Chilean pregnant women using a new milk‐based (Suppl.) (Mamán). X International Congress of Auxology, Florence, Italy, Book of Abstracts P‐57, p 146.
- Mardones F. & Zamora R. (1990) Socio‐economic evaluation of powdered milk delivery to pregnant women in Chile (Evaluación socio‐económica de la entrega de leche ‘Purita’ a la embarazada en Chile). Revista Médica de Chile 118, 1043–1051. [PubMed] [Google Scholar]
- Mardones‐Santander F., Marshall G., Rosso P. & Uiterwaal D. (2000) A reply to MS Kramer, Isocaloric protein supplementation during pregnancy (letter). European Journal of Clinical Nutrition 54, 803. [DOI] [PubMed] [Google Scholar]
- Mardones‐Santander F., Rosso P., Stekel A., Ahumada E., Llaguno S., Pizarro F., et al. (1988) Effect of a milk‐based food supplement on maternal nutritional status and fetal growth in underweight Chilean women. American Journal of Clinical Nutrition 47, 413–419. [DOI] [PubMed] [Google Scholar]
- Mardones‐Santander F., Rosso P., Uiterwaal D. & Marshall G. (1999) Nutritional interventions to prevent intrauterine growth retardation, evidence from randomized controlled trials (letter). European Journal of Clinical Nutrition 53, 970–971. [DOI] [PubMed] [Google Scholar]
- Mardones‐Santander F., Rosso P. & Zamora R. (1991) Cost‐effectiveness of a nutrition intervention for pregnant women. Nutrition Research 11, 295–307. [Google Scholar]
- Mardones‐Santander F., Salazar G., Rosso P. & Villarroel L. (1998) Maternal body composition near term and birth weight. Obstetrics and Gynecology 91, 873–877. [DOI] [PubMed] [Google Scholar]
- Metropolitan Life Insurance Company (1959) New weight standards for men and women. Statistics Bulletin Metropolitan Life Insurance Company 40, 1–4. [Google Scholar]
- Ministry of Health, Nutrition Unit (2002) Nutritional Situation of the Maternal and Child Population Covered by the Public System. Ministry of Health, Nutrition. Unit: Mimeo, Santiago. [Google Scholar]
- Ministry of Planning, Chile (2000) Social Department National Survey of Social Conditions (CASEN). http://www.mideplan.cl.
- National Health Fund, Chile (2003) Estimations of Covered Population by the Public Health System. National Health Fund, Ministry of Health, Department of Studies: Mimeo, Santiago. [Google Scholar]
- National Institute of Statistics, Chile (19872001) Vital Statistics. Web site: http://www.ine.cl.
- Niswander K.R. (1981) Obstetrics, 2nd edn Little, Brown and Company: Boston. [Google Scholar]
- Oregon WIC Staff (1981) WIC Program Manual. Oregon Health Division, Department of Human Resources: Portland, Oregon. [Google Scholar]
- Parker J.D. & Abrams B. (1992) Prenatal weight gain advice: an examination of the recent prenatal weight gain recommendations of the Institute of Medicine. Obstetrics and Gynecology 79, 664–669. [PubMed] [Google Scholar]
- Polley B.A., Wing R.R. & Sims C.J. (2002) Randomized controlled trial to prevent excessive weight gain in pregnant women. International Journal of Obesity and Related Metabolic Disorders 26, 1494–1502. [DOI] [PubMed] [Google Scholar]
- Puffer R.R. & Serrano C.V. (1987) Patterns of Birth Weight. P.A.H.O. Scientific Publication No 504. Pan American Health Organization: Washington, DC. [Google Scholar]
- Rajs D. (2004) Head, Statistics Unit, Ministry of Health, Chile. Personal communication.
- Robinovitch J., Rubio E., Sáez J. & Ramírez M. (1995) Body weight influence on pregnancy and perinatal outcomes (Influencia del peso corporal en el embarazo y resultado perinatal). Revista Chilena de Obstetricia y Ginecologia 60, 151–167. [PubMed] [Google Scholar]
- Rosso P. (1985) A new chart to monitor weight gain during pregnancy. American Journal of Clinical Nutrition 41, 644–652. [DOI] [PubMed] [Google Scholar]
- Rosso P. (1990) Nutrition and Metabolism in Pregnancy. Oxford University Press: New York. [Google Scholar]
- Rosso P. (1991) Weight‐for‐height/body mass index in pregnant women In: Maternal Nutrition and Pregnancy Outcomes. Scientific Publication N° 529 (eds Krasovec K. & Anderson M.A.), pp 173–185. Pan American Health Organization: Washington, DC. [Google Scholar]
- Rosso P. & Salas S. (1994) Mechanisms of fetal growth retardation in the underweight mother In: Nutrient Regulation During Pregnancy, Lactation and Infant Growth (eds Allen L.H., King J.C., Lönnerdal B.), pp 1–9. Plenum Press: New York. [DOI] [PubMed] [Google Scholar]
- Schieve L.A., Cogswell M.E. & Scanlon K.S. (1998) An empiric evaluation of the Institute of Medicine's pregnancy weight gain guidelines by race. Obstetrics and Gynecology 91, 878–884. [DOI] [PubMed] [Google Scholar]
- Siega‐Ruiz A.M., Adair L.S. & Hobel C.J. (1994) Institute of Medicine maternal weight gain recommendations and pregnancy outcome in a predominantly Hispanic population. Obstetrics and Gynecology 84, 565–573. [PubMed] [Google Scholar]
- Silva A.A., Lamy‐Filho F., Alves M.T., Coimbra L.C., Bettiol H. & Barbieri M.A. (2001) Risk factors for low birthweight in north‐east Brazil: the role of caesarean section. Paediatric and Perinatal Epidemiology 15, 257–264. [DOI] [PubMed] [Google Scholar]
- Society of Actuaries (1959a) Build and Blood Pressure Study, Vol. I. Society of Actuaries: Chicago. [Google Scholar]
- Society of Actuaries (1959b) Build and Blood Pressure Study, Vol. II. Society of Actuaries: Chicago. [Google Scholar]
- Susser M. (1991) Maternal weight gain, infant birth weight, and diet: causal sequences. American Journal of Clinical Nutrition 53, 1384–1396. [DOI] [PubMed] [Google Scholar]
- Thomson A.M. (1983) Fetal growth In: Obstetrical Epidemiology (eds Barron S.L. & Thomson A.M.), pp 89–142. Academic Press Inc. (London) Ltd: London. [Google Scholar]
- Thomson A.M. & Billewicz W.Z. (1957) Clinical significance of weight trends during pregnancy. British Medical Journal 1, 243–247. [DOI] [PMC free article] [PubMed] [Google Scholar]
- United Nations Administrative Committee on Coordination, Sub‐Committee on Nutrition (2000a) Nutrition Policy Paper ♯ 19 What Works? A Review of the Efficacy and Effectiveness of Nutrition Interventions (eds Allen L.H. & Gillespie S.R.). UNU ACC/SCN, in collaboration with the Asian developmental Bank, Manila: Geneva. [Google Scholar]
- United Nations Administrative Committee on Coordination, Sub‐Committee on Nutrition (2000b) Nutrition Policy Paper ♯ 18, Low Birthweight: Report of a Meeting in Dhaka, Bangladesh on 14–17 June 1999 (eds Pojda J. & Kelly L.). UNU ACC/SCN in collaboration with ICDD: Geneva. [Google Scholar]
- Working Group (1991) Summary and recommendations In: Maternal Nutrition and Pregnancy Outcomes, PAHO Scientific Publication N° 529 (eds Krasovec K. & Anderson M.A.), pp 197–203. Pan American Health Organization: Washington, DC. [Google Scholar]
- World Health Organization (1973) Energy and Protein Requirement. Report of a joint FAO/WHO Expert Consultation. Technical Report Series no. 522. World Health Organization: Geneva. [Google Scholar]
- World Health Organization (1985) Energy and Protein Requirements. Report of a Joint FAO/WHO/UNU Expert Consultation. Technical Report Series no. 724. World Health Organization: Geneva. [PubMed] [Google Scholar]
- World Health Organization (2003) Diet, nutrition and chronic disease in context In: Diet, Nutrition and the Prevention of Chronic Diseases (WHO Technical Report Series No. 916), pp 30–53. WHO: Geneva. [PubMed] [Google Scholar]
- Young T.K. & Woodmansee B. (2002) Factors that are associated with cesarean delivery in a large private practice: the importance of prepregnancy body mass index and weight gain. American Journal of Obstetrics and Gynecology 187, 312–318. [DOI] [PubMed] [Google Scholar]