

Abstract
Copy number variants (CNVs) are subject to stronger selective pressure than single-nucleotide variants, but their roles in archaic introgression and adaptation have not been systematically investigated. We show that stratified CNVs are significantly associated with signatures of positive selection in Melanesians and provide evidence for adaptive introgression of large CNVs at chromosomes 16p11.2 and 8p21.3 from Denisovans and Neanderthals, respectively. Using long-read sequence data, we reconstruct the structure and complex evolutionary history of these polymorphisms and show that both encode positively selected genes absent from most human populations. Our results collectively suggest that large CNVs originating in archaic hominins and introgressed into modern humans have played an important role in local population adaptation and represent an insufficiently studied source of large-scale genetic variation.
Graphical Abstract
INTRODUCTION:
Characterizing genetic variants underlying local adaptations in human populations is one of the central goals of evolutionary research. Most studies have focused on adaptive single-nucleotide variants that either arose as new beneficial mutations or were introduced after interbreeding with our now-extinct relatives, including Neanderthals and Denisovans. The adaptive role of copy number variants (CNVs), another well-known form of genomic variation generated through deletions or duplications that affect more base pairs in the genome, is less well understood, despite evidence that such mutations are subject to stronger selective pressures.
RATIONALE:
This study focuses on the discovery of introgressed and adaptive CNVs that have become enriched in specific human populations. We combine whole-genome CNV calling and population genetic inference methods to discover CNVs and then assess signals of selection after controlling for demographic history. We examine 266 publicly available modern human genomes from the Simons Genome Diversity Project and genomes of three ancient hominins—a Denisovan, a Neanderthal from the Altai Mountains in Siberia, and a Neanderthal from Croatia. We apply long-read sequencing methods to sequence-resolve complex CNVs of interest specifically in the Melanesians—an Oceanian population distributed from Papua New Guinea to as far east as the islands of Fiji and known to harbor some of the greatest amounts of Neanderthal and Denisovan ancestry.
RESULTS:
Consistent with the hypothesis of archaic introgression outside Africa, we find a significant excess of CNV sharing between modern non-African populations and archaic hominins (P = 0.039). Among Melanesians, we observe an enrichment of CNVs with potential signals of positive selection (n = 37 CNVs), of which 19 CNVs likely introgressed from archaic hominins. We show that Melanesian-stratified CNVs are significantly associated with signals of positive selection (P = 0.0323). Many map near or within genes associated with metabolism (e.g., ACOT1 and ACOT2), development and cell cycle or signaling (e.g., TNFRSF10D and CDK11A and CDK11B), or immune response (e.g., IFNLR1). We characterize two of the largest and most complex CNVs on chromosomes 16p11.2 and 8p21.3 that introgressed from Denisovans and Neanderthals, respectively, and are absent from most other human populations. At chromosome 16p11.2, we sequence-resolve a large duplication of >383 thousand base pairs (kbp) that originated from Denisovans and introgressed into the ancestral Melanesian population 60,000 to 170,000 years ago. This large duplication occurs at high frequency (>79%) in diverse Melanesian groups, shows signatures of positive selection, and maps adjacent to Homo sapiens–specific duplications that predispose to rearrangements associated with autism. On chromosome 8p21.3, we identify a Melanesian haplotype that carries two CNVs, a ~6-kbp deletion, and a ~38-kbp duplication, with a Neanderthal origin and that introgressed into non-Africans 40,000 to 120,000 years ago. This CNV haplotype occurs at high frequency (44%) and shows signals consistent with a partial selective sweep in Melanesians. Using long-read sequencing genomic and transcriptomic data, we reconstruct the structure and complex evolutionary history for these two CNVs and discover previously undescribed duplicated genes (TNFRSF10D1, TNFRSF10D2, and NPIPB16) that show an excess of amino acid replacements consistent with the action of positive selection.
CONCLUSION:
Our results suggest that large CNVs originating in archaic hominins and introgressed into modern humans have played an important role in local population adaptation and represent an insufficiently studied source of large-scale genetic variation that is absent from current reference genomes.
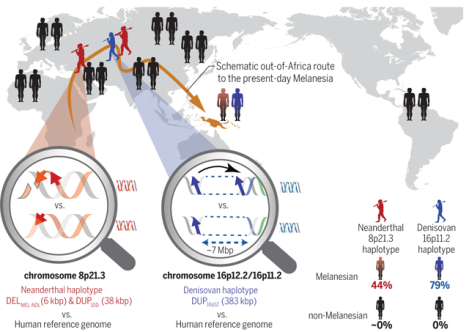
Large adaptive-introgressed CNVs at chromosomes 8p21.3 and 16p11.2 in Melanesians. The magnifying glasses highlight structural differences between the archaic (top) and reference (bottom) genomes. Neanderthal (red) and Denisovan (blue) haplotypes encompassing large CNVs occur at high frequencies in Melanesians (44 and 79%, respectively) but are absent (black) in all non-Melanesians. These CNVs create positively selected genes (TNFRSF10D1, TNFRSF10D2, and NPIPB16) that are absent from the reference genome.
Upon migration out of their ancestral homeland, our ancestors likely experienced pressure to adapt to new environments. Genomic surveys with single-nucleotide variants (SNVs) have provided evidence for local genetic adaptations (1–4) and the acquisition of variants introgressed from other hominins and subsequently under positive selection in modern humans (5–7). Copy number variants (CNVs) are a form of structural variation, including deletions, duplications, and multi-allelic CNVs, that are >50 base pairs (bp) in length and affect at least five times as many base pairs as SNVs per diploid human genome (8–10). When compared with the relative abundance of SNVs, structural variants are three times as likely to be associated with a genome-wide association signal and 50 times as likely to be associated with expressed quantitative trait loci (eQTL) (11). Although larger CNVs are generally deleterious and associated with disease, examples of adaptive CNVs in humans have been documented (12–15). However, relatively little is known about the extent to which CNVs contribute to the genetic basis of local adaptation and, more importantly, whether CNVs introgressed from other hominins may have been targets of adaptive selection.
In this work, we systematically searched for genome-wide evidence for selective and archaic introgressed CNVs among Melanesian genomes. Melanesia, a subregion of Oceania, is characterized by island populations distributed across the Bismarck Archipelago and Bougainville Island, just to the east of New Guinea. Melanesians have likely developed adaptations to diet (16), infectious diseases (17), and body size (18) as a result of the tropical island environment. In addition, Melanesians have been relatively isolated over most of their history (>50,000 years), with major influences from populations to the west occurring only during the past 3000 years (19, 20). Melanesians also carry some of the greatest amounts of ancestry from both known archaic hominins, Denisovans (3 to 5%) (21–23) and Neanderthals (1 to 3%) (24), allowing for insights into the role of introgression in human evolution.
An excess of archaic hominin CNVs in non-African populations
We began by constructing a database of 5135 archaic CNVs (table S1) from previous sequence read-depth analyses of genomes of three ancient hominins—a Denisovan (25), a Neanderthal (26) from the Altai Mountains in Siberia, and a Neanderthal from Croatia (24). We compared these archaic genomes to a diversity panel of 17 high-coverage modern human genomes from the Simons Genome Diversity Project (SGDP) (24). We genotyped these CNVs in 249 genomes from the SGDP panel (27) and 72 nonhuman great ape genomes (28) and then parsimoniously classified CNV events as lineage-specific or shared with modern humans and other ape species. We found that 2684 of the 5135 CNV loci in modern humans are copy number polymorphic in the archaic genomes [i.e., at least one of the three archaic genomes has a copy number estimate not equal to 2]; of these, 142 CNVs are likely derived relative to the 72 nonhuman primate genomes, which are fixed at a diploid copy number (CN2) for these loci. We defined a CNV as hominin specific if it is fixed in CN2 among all nonhuman primate samples and is variable in copy number in at least one hominin sample. Among the 402 hominin-specific CNVs (table S2), 13% (51 of 402) of the CNVs are specifically shared between the three Eurasian archaic hominins and non-African samples. The amount of shared CNVs between the archaic and non-African samples is unlikely under a null expectation (P = 0.039, 100,000 permutation simulations; fig. S1). Despite the small sample size of three archaic genomes, our result is consistent with recent evidence for archaic admixture found in Eurasia and suggests that some of the shared CNVs might result from archaic introgression.
Discovery of single-nucleotide and population-stratified CNVs
We performed a more comprehensive computational analysis to discover and assess patterns of single-nucleotide and structural variation in the SGDP populations (29). We identified population-stratified CNVs and then tested for selection and introgression by using SNVs from the diploid sequence flanking population-stratified CNVs (29). Using five CNV callers, we discovered 368,256 autosomal CNVs, of which 93.5% were identified by a single CNV caller (fig. S2 and table S3). We focused on a conserved call set of 19,211 CNVs constructed by applying a variety of quality control filters (fig. S3) (29). We used orthogonal single-nucleotide polymorphism microarray data to determine an overall validation rate of 83.5% (68.2% for duplications and ~100% for deletions) (table S4) (29).
To identify population-stratified CNVs, we applied three statistics quantifying the differences in copy number between a focal population and all the other SGDP samples: VST, Mann-Whitney U (MWU), and Dmedian (29). After removing admixed individuals (fig. S4), we grouped the remaining SGDP samples (n = 249 individuals) into eight focal populations: sub-Saharan Africans (n = 33), Native Americans (n = 20), East Asians (n = 47), Europeans (n = 51), Melanesians (n = 16), Middle Easterners (n = 22), South Asians (n = 38), and Siberians (n = 22) (29). We found little to no correlation between the focal population sample size and the number of stratified CNVs identified by VST (r = −0.16, P = 0.699) and MWU test (r = −0.19, P = 0.638) compared with those obtained by the Dmedian test (r = −0.73, P = 0.039) (fig. S5). In addition, there is a strong correlation between the Bonferroni P values of the MWU and VST tests (r = −0.65, P < 2 × 10⁻¹⁶); however, 233 CNVs have VST > 0.1 but with MWU Bonferroni’s P > 0.05, indicating that the two tests are complementary. To conservatively identify stratified CNVs in a focal population, we used the following criteria: (i) VST > 0.1, (ii) Bonferroni P value of the MWU test < 0.05, and (iii) Dmedian > 0.5 (fig. S6). Although the number varied by population (table S5), we observed more stratified CNVs per population than expected by chance (P < 0.0105,10,000 nonparametric permutation simulations) (29), suggesting that the enrichment of stratified CNVs is unlikely to be the result of sampling errors. Because Melanesians share the most introgressed alleles with archaic lineages (an estimated 2 to 4% from both Denisovan and Neanderthal), we focused on this population for a more detailed investigation of introgressed and selected CNVs.
Tests for selective and archaic introgressed CNVs in Melanesians
We considered two possible origins for the population-stratified CNVs: The events could have arisen de novo or, alternatively, could have introgressed from other hominins and then subsequently risen to high frequency by the action of natural selection or demographic processes, including drift. To distinguish between these hypotheses, we applied a variety of population genetic statistics that use both allele frequency and linkage disequilibrium information of SNVs flanking the CNVs for additional evidence of archaic hominin introgression and/or signatures of positive selection (29). Potential biases on the test statistics owing to population history were controlled through coalescent simulations on the basis of the inferred best-fit demographic models for Melanesians. We define the significance of each test as the fraction of simulations with test statistic values greater than or equal to the observed value in the real data (29). A test for a window is significant if its P value is <0.05. Among the models we tested (table S6), our best-fit model (fig. S7; log-likelihood = −103,386) estimates that the ancestors of Africans and non-Africans diverged ~74,000 years ago [95% confidence interval (CI): 73,321 to 75,199 years ago], followed by Melanesian-East Asian divergence ~52,000 years ago (95% CI: 51,450 to 52,591 years ago), consistent with recent reports (19). Our demographic model confirms moderately high gene flow from East Asians to Melanesians [95% CI for NAMH*mMEL-EA = 1.109 to 1.128 > 1 (NAMH, effective population size of anatomically modern humans; mMEL-EA, migration rate from East Asia to Melanesia); table S7]. This finding is notable because there is evidence for East Asian gene flow into Melanesians, especially in the lowland groups, which constitute approximately one-third of our Melanesian sample set (19, 20).
Our coalescent simulations (fig. S8 and table S8) (29) generally recapitulated the empirical variation pattern of SNVs (fig. S9A) and demonstrated the utility of our approach to identify non-neutrally evolved loci (fig. S9, B and C). We used these parametric coalescent simulations to estimate significance of selection and introgression at individual loci. Among Melanesians, we identified signatures of positive selection at 37 distinct CNV loci [P < 0.05, population branch statistic (PBS)] (2) (Fig. 1) and signals of introgression [fD test (30) at 24 and 28 CNV loci using Neanderthal and Denisovan genomes as archaic references, respectively]. Notably, more than 51% of the selective CNV candidates (19 of 37 CNVs) also have introgression signals at the flanking diploid sequences (Table 1 and tables S9 and S10)—an observation that is highly unlikely (P = 0.0004, 10,000 nonparametric permutations). However, we hypothesize that this strong correlation is likely driven by the association between population-stratified CNVs and selection signals at their flanking sequences, because our analysis shows that Melanesian-stratified CNVs are significantly associated with selective signals (P = 0.0323,10,000 nonparametric permutations) but not with archaic introgression signals (P = 0.2282,10,000 nonparametric permutations) (fig. S10).
Fig. 1. Candidates for introgressed archaic and selective CNVs.

Joint distributions of P values for CNV stratification (x axis, Mann-Whitney U), archaic introgression (fD statistic, top two rows), and positive selection (population branch statistic, bottom row) tests. The archaic reference sequences used in the calculations of fD are Neanderthals (top row) and Denisovans (middle row), respectively. CNVs that show signatures of both positive selection and archaic introgression (red circles) are distinguished from loci that show signatures of introgression only (orange circles).
Table 1. Top candidates for adaptive introgressed CNVs in Melanesians.
P values for selection and introgression scans are calculated from coalescent simulations. Only loci with selection test P values <0.01 are listed. Variant type is determined with respect to the human reference genome. The introgression statistic (fD) is calculated separately for Neanderthals (NDL) and Denisovans (DNS). mCNV, multi-allelic CNV; DUP, bi-allelic duplication; DEL, bi-allelic deletion. VST is a measurement of copy number stratification. See tables S9 and S10 for all candidates.
| Locus | Size (bp) | Type | Median CN (Melanesians) | Median CN (all others) | VST | P value selection (PBS) | P value, introgression (fD) archaic ref: NDL | P value, introgression (fD) archaic ref: DNS | Genes within 30 kbp |
|---|---|---|---|---|---|---|---|---|---|
| chr2:97699365–97907043 | 207,678 | mCNV | 48.722 | 39.147 | 0.487 | <0.001* | 0.009* | 0.001* | ANKRD36, FAHD2B |
| chr8:22886278–23003689† | 117,411 | DUP | 4.054 | 3.257 | 0.272 | <0.001* | 0.003* | 0.055 | TNFRSF10D/10C |
| chr14:73990658–74053946 | 63,288 | mCNV | 3.997 | 2.968 | 0.149 | <0.001* | 0.008* | 0.013* | ACOT1/2, HEATR4 |
| chr3:177002637–177011375 | 8738 | DEL | 0.984 | 1.905 | 0.702 | 0.001* | 0.363 | 0.007* | LINC00501 |
| chr8:22981867–22988907 | 7040 | DEL | 1.160 | 2.163 | 0.428 | 0.001* | <0.001* | 0.001* | TNFRSF10D/10C |
| chr16:227l6041:22783558†† | 73,517 | DUP | 3.935 | 1.969 | 0.923 | 0.004* | 0.179 | <0.001* | MIR548AA2, MIR548D2 |
| chr17:44170850–45157111 | 986,261 | DUP | 2.079 | 3.311 | 0.172 | 0.004* | 0.001* | 0.005* | KANSL1, NSF(chr17q21) |
| chr1:1568057–1683771 | 115,714 | mCNV | 3.291 | 4.306 | 0.298 | 0.007* | 0.053 | 0.025* | CDK11A/11B(chr1p36) |
| chr1:24520349–24523673 | 3324 | DEL | 0.790 | 1.898 | 0353 | 0.008* | 0.002* | <0.001* | IFNLR1 |
Significant test result.
Newly identified genes: TNFRSF10D1 and TNFRSF10D2.
Newly identified gene: NPIPB16.
Among the adaptive introgressed CNV candidates, many map near or within genes associated with metabolism (e.g., ACOT1 and ACOT2), development and cell cycle or cell signaling (e.g., TNFRSF10D, CDK11A, and CDK11B), or immune response (e.g., IFNLR1); however, the patterns are complex. For example, whereas the ACOT1 locus harbors a deletion polymorphism common in East Asians (31, 32), we find a ~30-kbp duplication of ACOT1 in only 12 SGDP samples, including three Melanesians, thus indicating a multi-allelic CNV (figs. S11 and S12). ACOT1 is involved in regulating cellular balance between free fatty acids and acyl-CoAs, which are critical for energy expenditure and neuronal function (31). Although the ACOT1 deletion allele is common across populations, we found that >84% of Melanesians retain the ACOT1 sequences (fig. S12). Furthermore, the major Melanesian haplotype occurs at a much lower frequency in other populations (<11%) and shows extended haplotype homozygosity (EHH), a signature of positive selection (figs. S11, S13, and S14). Although a similar EHH pattern was observed in other non-Africans, most individuals in those populations carry a different allele at the core (figs. S11 and S14). Notably, the introgression signal in Melanesians at this region is located on the minor haplotype, not the major haplotype where we observe the strongest signature of selection (figs. S13 and S14). The core SNVs (rs4903119 and rs8015976; fig. S11) on the major haplotype are also associated with eQTL differences in ACOT1, ACOT2, and the adjacent gene, HEATR4 (GTEx Portal accessed on 24 June 2019; https://gtexportal.org), although additional work will be required to fully define these associations and their potential biological consequences.
It is also noteworthy that our analysis identified CNVs and structural variants with strong signals of selection that have been observed in other human populations (table S9) (29). For example, we identify a deletion-linked haplotype at the APOBEC3A and APOBEC3B locus that is fixed in Melanesians but relatively rare in other populations (figs. S15 to S19). This deletion allele has been reported at high frequency among Oceanians (32) and is associated with the risk of HIV-1 acquisition (33) as well as breast and ovarian cancers in some Eurasian populations (34). At another immunity-related locus, the alpha-defensin (DEFA1-T1) gene family, we find that 87.5% of Melanesians have more DEFA1-T1 copies than other populations (figs. S20 to S23). They also carry a distinctive haplotype that is rare elsewhere (figs. S23 to S25). This locus is one of the most structurally dynamic regions in the human genome, where recurrent rearrangements have occurred during primate evolution and have been associated with diseases such as immunoglobulin A nephropathy (35, 36). At chromosome 17q21.31, we observe signals of selection and introgression. A large inversion and recurrent duplications in this region have been associated with positive selection and predisposition to disease in Europeans (37, 38). Among Melanesians, we find a nearly fixed haplotype (97%) that is more reminiscent of the ancestral haplotype, which is devoid of both the large inversion and the duplication alleles (figs. S26 to S28). The Melanesian haplotype shows multiple signals of positive selection, including significantly negative Tajima’s D (−2.14, P = 0.007), low nucleotide diversity (π < 4.3 × 10⁻⁵, P = 0.042), and elevated EHH across this region (figs. S29 to S32).
Although each of these loci will require more detailed investigation, we focus here on two of the largest and most complex copy number polymorphisms discovered among the Melanesians. Given that the DNA of the Melanesian genomes in the SGDP panel comes from cell lines, which are subject to somatic artifacts, we designed and performed experiments using additional blood-derived Melanesian DNA samples for several CNVs (fig. S33), as well as the two most complex CNV loci reported here, to safeguard against cell line artifacts.
Adaptive introgression of the Melanesian–Denisovan–specific duplication at chromosome 16p11.2
The top two Melanesian-stratified CNVs (P = 2.5 × 10⁻³²) are a 5-kbp (chr16:21,596,722–21,601,720) duplication variant and a 73.5-kbp (chr16:22,710,041–22,783,558) duplication variant (fig. S34) originating from chromosome 16p12.2. Both events are largely restricted to Melanesians and the Denisovan archaic genome (Fig. 2A) and are thought to be involved in a single >225-kbp complex duplication (DUP16p12) introgressed from the Denisovan genome (9). This region has been difficult to correctly sequence and assemble, and only recently has the sequence structure of the ancestral locus (>1.1 Mbp) been correctly resolved [KV880768.1, National Center for Biotechnology Information (NCBI) BioProject: PRJNA31257; fig. S35] (39). Unless otherwise stated, we use this patch of sequence to define the ancestral locus.
Fig. 2. Evidence for adaptive Denisovan introgression of the chromosome 16p12.2 duplication at 16p11.2 in Melanesians.

(A) Copy number (CN) estimates of DUP16p12 for the SGDP populations and three archaic samples. Pie charts indicate the CN frequency of populations (right) and the population fraction of CN genotypes (bottom). NDL, Neanderthals; DNS, Denisovans; SIB, Siberians; SA, South Asians; MEL, Melanesians; ME, Middle Easterners; EUR, Europeans; EA, East Asians; AMR, Native Americans; AFR, sub-Saharan Africans. (B) Geographic distribution for the DUP16p12 duplication genotypes of 242 independent blood-derived DNA samples from Melanesia. The CN color scheme matches that in (D). (C) FISH experiments using fosmid clones from 16p12.2 confirm an additional copy of DUP16p12 (red fosmid clone, 174222_ABC10_2_1_000044550500_M3 at 16p12.2; table S13; fig. S38) in a Melanesian cell line (GM10541, CN3) as opposed to a European cell line (GM12878, CN2). (D) (Top) Signals of adaptive introgression in the Melanesians at 16p11.2—the locus in which the DUP16p12 duplication was inserted. The heat map shows the CN distribution at chromosome 16p11.2. Fosmid clones (green: ABC10_000044688200_G16; blue: ABC10_000043626100_E12; table S13) indicate the region where the integration of DUP16p12 occurred at the 16p11.2 locus. (Bottom) PBS (left y axis) for SNVs (dots) and fD [horizontal lines, representing windows of 100 SNVs, computed using Denisovans as the archaic reference, right axis] at DUP16p12. Colored circles (blue) and/or horizontal lines (purple) indicate significant test statistics (P < 0.05). Note that introgression signals at both 16p12.2 and 16p11.2 disappear if Neanderthals are used as the archaic reference in the fD computation (figs. S36 and S47).
By using a series of polymerase chain reaction (PCR)-restriction digest assays to genotype an independent set of 242 blood-derived DNA samples from diverse Melanesians across eight different population groups (Fig. 2B and table S11), we confirmed that this duplication allele is present at high frequency in Melanesians. Although DUP16p12 is present at high frequency in all groups [allele frequency (AF) > 0.79], introgression is nearly complete among lowland populations of West and East New Britain, Papua New Guinea (Fig. 2B and table S11). Leveraging paralogous sequence variants that distinguish the duplicated loci, we applied the fD statistic and found significant signals for archaic introgression at both loci (P < 0.033 and < 0.001; Fig. 1, Table 1, and table S10) using Denisovans, but not Neanderthals (P = 0.178; fig. S36), as the source of admixture.
Because the elevated PBS and Tajima’s D at 16p12.2 (fig. S37) are driven by paralogous sequence variants that are not fully resolved, we sought to further investigate evidence for selection of DUP16p12 at its true genomic integration site. We performed a series of fluorescence in situ hybridization (FISH) experiments using probes tiled along the short arm of chromosome 16 in Melanesian cell lines (Fig. 2C, figs. S38 and S39, and tables S12 and S13) (29). Our data localized the derived Melanesian duplication to chromosome 16p11.2 between genomic coordinates of 28.93 and 30.09 Mbp (Fig. 2D). In addition, we generated long-read, high-coverage (75×) whole-genome sequences from a Melanesian individual (HGDP00550; cell line from the HGDP-CEPH panel) who carries the DUP16p12 variant. Using the long-read data, we further narrowed the insertion location of this duplication to a 200-kbp interval (29.48 to 29.68 Mbp) adjacent to an NPIP (nuclear pore-interacting protein) core duplicon (fig. S40) (29). This is a complex region of >500 kbp of segmental duplication where a Homo sapiens-specific duplication emerged ~280,000 years ago and, as a result, predisposes the region to recurrent structural rearrangements associated with autism and developmental delay (15, 40).
To sequence-resolve the DUP16p12 copy number polymorphism, we generated a Melanesian large-insert bacterial artificial chromosome (BAC) library (GM10539). From these BACs, we constructed two haplotypes of 222 and 133 kbp, partially confirming the structure of DUP16p12 (9) (fig. S41 and S42). To fully assemble the entire locus ab initio, we used the haplotypes as the initial seeds to pull down long-read Melanesian whole-genome sequence data and iteratively applied the Segmental Duplication Assembler method (41) (fig. S43 and table S14). The procedure generated a ~1.8-Mbp sequence contig spanning more than 900 kbp of complex segmental duplications (Fig. 3A). We confirmed the organization and sequence accuracy (99.86%) for 220 kbp of this assembly for which we have finished BAC sequences derived from an unrelated Melanesian sample (fig. S44). Notably, the sequence-resolved assembly shows that the actual length of DUP16p12 duplication polymorphism is ~383 kbp, which is longer than previously thought (9). Sequence and phylogenetic analyses suggest that the variant originated from a series of complex structural changes involving duplication, deletion, and inversion events ~0.5 to 2.5 million years ago (Mya) within the Denisovan ancestral lineage, which subsequently inserted into chromosome 16p11.2 (chr16:29,640,235–29,640,459) between 0.2 to 0.5 million years ago (Fig. 3B, figs. S45 and S46, and table S15).
Fig. 3. Reconstruction of the structure and evolutionary history for the Melanesian–Denisovan duplication at chromosome 16p11.2.

(A) Structural comparison of chromosome 16p11.2 (human genome reference GRCh37; top), the structure-resolved Melanesian contig (middle) at 16p11.2, and the ancestral locus of DUP16p12 at 16p12.2 (KV880768.1; NCBI BioProject: PRJNA31257; bottom). Colored boxes denote annotated human segmental duplications, and lines connecting the sequences show regions of homology. Duplicated segments specific to the Melanesian genome (red dashed box) are indicated if derived from unique (colored arrows) or previous duplication (colored rectangles) sequences. The region of recurrent genome rearrangements associated with autism is highlighted (pink shaded area). (B) Schematic model for the evolution of the DUP16p12 duplication. The schematic depicts structural changes over time, leading to the Melanesian architecture. Evolutionary timing was estimated on the basis of a series of phylogenetic analyses using structure-resolved sequences from 16p12.2 and 16p11.2 loci (31). The absence of intermediate genomes makes the order of some structural changes uncertain. (C) A new member of the NPIPB gene family, NPIPB16 (1206 amino acids), in the Melanesian DUP16p12 sequence with predicted sites of positive selection. dN/dS analyses show positively selected amino acid substitutions at NPIPB16 lineages (blue circles) compared with other NPIPB genes. Note that the cluster of massive amino acid changes (red circles) at position 1236 to 1284 (alignment space) is predicted to result from two indel events in the C terminus of NPIPB16 as opposed to a series of independent amino acid substitution events (fig. S51).
Within the sequence immediately flanking the 16p11.2 duplication block near the DUP16p12 insertion breakpoint, we observe significantly elevated PBS (P < 0.012) and fD (P < 0.021, archaic = Denisovan) values (Fig. 2D). Once again, the introgression signal at 16p11.2 is absent when Neanderthals are used as the archaic reference [P(fD; archaic = Neanderthal) > 0.193; fig. S47], consistent with a Denisovan origin. To infer the timing of the introgression event, we constructed DUP16p12 haplotypes for the Denisovan and Melanesian genomes by remapping the short-read data to the assembled Melanesian contig and KV880768.1 in addition to the human reference. We reconstructed the phylogeny of DUP16p12 using ~10-kbp sequences, where at least five high-quality Denisovan reads are present, and showed that the introgression event likely occurred ~0.06 to 0.17 million years ago (fig. S48).
The Melanesian duplication polymorphism harbors extra copies of segmental duplication sequences that are absent from most human populations, including an additional member of the NPIP family (42). To explore the NPIP coding potential at this locus, we generated full-length nonchimeric (FLNC) transcript data using Melanesian (GM10539 and GM10541) fibroblast cell lines (29). We identified FLNC transcripts that maintain the same open reading frame (ORF) and encode a previously unidentified member of the NPIPB family, NPIPB16 (1206 amino acids), mapping exclusively to this duplication polymorphism (Fig. 3C). This Melanesian copy shows elevated pairwise dN/dS ratios (i.e., the number of nonsynonymous substitutions per nonsynonymous site to the number of synonymous substitutions per synonymous site) when compared with other closely related NPIPB genes (RefSeq release 109) (figs. S49 and S50). Using a phylogenetic branch site test (43), we identified 32 sites as likely positively selected, including a cluster of 28 amino acid differences that occur in the last exon of NPIPB16 (Fig. 3C). Multiple sequence alignment analyses reveal that this cluster is due to two indel events of a repeat motif (GAGCGTCTGCGGG). The first indel upstream of the cluster alters the frame, whereas the second indel located downstream subsequently restores the original NPIP frame. These compensatory mutations resulted in a novel sequence at the C terminus of NPIPB16 (fig. S51), as opposed to the other four amino acid replacement events. Notably, at 30 of the 32 sites where there is sequence coverage (more than five reads), the Denisovan genome carries the same alleles as in the Melanesian NPIPB16, suggesting that most of these events emerged in the Denisovan lineage.
Taken together, our findings suggest that the 383-kbp duplication polymorphism in Melanesians introgressed from Denisovan-like hominins and that it is likely an adaptive CNV. This helps to explain why this polymorphism has become nearly fixed within the Melanesian populations (>80%) despite its large size, which is typically regarded as selectively disadvantageous (8, 44). Our analyses support a model where the locus on chromosome 16p11.2 served as an acceptor site for large independent duplication events twice in the recent history of the Homo genus—once in the H. sapiens lineage and once in the ancestral Denisovan lineage where novel duplicate genes have emerged. Notably, the Melanesian-specific gene NPIPB shows ~3% amino acid divergence and evidence of positive selection despite its recent origin. Introgression has generated an amalgam of these two duplications, creating a massive duplication block (~900 kbp) in Melanesian and related populations. Given the localization of this duplication polymorphism to the recurrent autism-associated breakpoint region, we predict that these changes in the genomic architecture and the additional NPIPB homologous segments (orange triangles in Fig. 3; see also table S16) will affect the frequency of recurrent rearrangements associated with autism in these populations.
Introgression of Neanderthal CNVs at chromosome 8p21.3 shows signals of positive selection
Another signal of selection (PBS/FST) and introgression (P < 0.005) in Melanesians maps to a 76-kbp region on chromosome 8 (chr8:22, 969,611–23,045,069; Fig. 4, A and B, and fig. S52). Within this region, there are two stratified CNVs: a 6-kbp deletion (DELMEL-NDL, chr8:22,982,302–22,988,251; CNV stratification P < 8.9 × 10⁻¹¹) and a 31-kbp duplication (DUP10D, chr8:22,991,347–23,022,738; CNV stratification P < 1.5 × 10⁻⁶) encompassing TNFRSF10D (tumor necrosis factor receptor superfamily 10D). The copy number estimates of both structural variants (DELMEL-NDL and DUP10D) are highly correlated among Melanesian samples (Pearson’s correlation r = −0.64, P < 0.05) but not in other SGDP populations (fig. S53). Multiple lines of evidence, including signals of excess heterozygosity, sequence read-depth analyses, and FISH assays, confirm that the duplication variant DUP10D is the major allele among Melanesians (AF = 0.66) but is also found among a subset of Africans (AF = 0.12) as well as in the three archaic genomes where it is heterozygous (AF = 0.5) (Fig. 4B and figs. S53 to S55). The deletion allele DELMEL-NDL shows a restricted distribution, as it is observed among Melanesians (AF = 0.437), the two Neanderthals (AF = 1.0), and at low frequency among South Asians (AF = 0.013). Using a PCR assay, we confirmed the presence of the DELMEL-NDL deletion allele in two independent sets of cell line and blood-derived Papuan DNA samples (fig. S56 and table S12) (29).
Fig. 4. Highly stratified CNVs at 8p21.3 in Melanesians and evidence for gene duplication and fusion followed by adaptive evolution at the TNFRSF10D locus.

(A) Manhattan plot for the P values of window-based FST test. The horizontal dashed line indicates the genome-wide Bonferroni-corrected significance. (B) (Top) Distribution of heterozygous sites (short black vertical bars) for a subset of the SGDP samples. The gray box at the top shows the location of DELMEL-NDL, whereas the blue-red box indicates the derived TNFRSF10D form, a fusion of TNFRSF10D1 (blue) and TNFRSF10D2 (red), as shown in Fig. 3C. (Bottom) Distributions of fD and PBS statistics, as well as CN trajectories of all samples across the region. (C) Comparison (Miropeats) of the major human allele versus chimpanzee genome structure, showing the tandem organization of the DUP10D variant and the predicted gene models. (D) Branch-site test of positive selection (dN/dS) using FLNC transcript data shows significant selection signals (P = 0.005) compared with the null model and a cluster of positively selected amino acid substitutions at the transmembrane domain of TNFRSF10D. Coding-sequence phylogeny shows significant positive selection (orange; dN/dS ratios >1; P < 0.05) on specific branches. Note that the orangutan paralogous sequences form a single clade as a result of interlocus gene conversion (fig. S60).
To understand the evolution of DUP10D, we computed its copy number among great apes (28) and samples from the 1000 Genomes Project (1KG) (10). The DUP10D variant is present among all nonhuman primates examined and segregates at low frequencies across the 1KG populations (<0.025) but is completely absent from others, such as the Europeans (figs. S53 to S55 and S57). We used BACs to sequence the DUP10D locus from chimpanzees, gorillas, orangutans, and rhesus macaques (29). Our sequence comparison analyses showed that all nonhuman ape species share the same tandem organization for the two copies of TNFRSF10D (TNFRSF10D1 of 30.3 kbp and TNFRSF10D2 of 33.0 kbp) (Fig. 4C and fig. S58). The absence of the tandem structure from the human reference genome and most extant humans suggests that the single-copy structure of TNFRSF10D emerged specifically in the human lineage.
Using the chimpanzee sequence, we inferred the evolutionary breakpoints at chr8:23, 003,123–23,003,255 (GRCh37) partially overlapping the fifth intron and exon of TNFRSF10D. We predict that the most common derived form of TNFRSF10D in humans is a product of a nonallelic homologous recombination event between two ancestral genes (TNFRSF10D1 and TNFRSF10D2). The resulting gene fusion creates a hybrid consisting of the first five exons of TNFRSF10D2 and the last four exons of TNFRSF10D1. Thus, two-thirds of TNFRSF10D1 (~18.4 kbp) and one-third of TNFRSF10D2 (~11.9 kbp) are absent from most humans (figs. S58 and S59). Bayesian phylogenetic reconstruction of the loci show that two independent duplication events of TNFRSF10D occurred in primate evolution: one in the lineage leading to the Old World monkey and the other in the ancestral lineage of all apes ~27.6 million years ago (95% highest posterior density: 19.9 to 36.1 million years ago; fig. S60). In contrast, we estimate that the gene fusion occurred 1.1 to 1.5 million years ago in the ancestral Homo lineage leading to modern humans, Neanderthals, and Denisovans, where it rose to high frequency among most human populations, with the exception of Melanesians.
We assessed the coding potential of the three different TNFRSF10D models by sequencing full-length transcripts from Melanesian (GM10541, CN3), European (GM12878, CN2), and chimpanzee (PanTro, CN4) cell line samples (29). In chimpanzee cells, we identified a six- and a nine-exon gene model corresponding to TNFRSF10D1 and TNFRSF10D2, respectively (figs. S61 and S62). In contrast, the European CN2 sample possesses only the fusion gene, TNFRSF10D, whereas the heterozygous Melanesian sample shows all three gene models, including the two additional models present in chimpanzee (fig. S61). Although ORF analyses indicate that TNFRSF10D1 carries a premature stop codon in exon 2, which truncates the canonical protein at the 59th amino acid position, a protein with 217 amino acids is still predicted, owing to the use of a second start codon in exon 2 (fig. S62). In contrast, TNFRSF10D2 maintains an ORF with all nine exons consistent with the annotation in the human reference assembly (ENST00000312584). The more common human fusion gene effectively deletes the TNFRSF10D1 premature stop codon (fig. S62) and thus restores the canonical ORF.
To further assess the functional importance of the TNFRSF10D duplicates, we examined FLNC transcript data from Melanesian (GM10541), European (GM12878), and chimpanzee fibroblast cell lines (29) and inferred orthologous gene models from TNFRSF10D1 and TNFRSF10D2 using gorilla, orangutan, and rhesus macaque BAC sequences. We observed a significant excess of amino acid substitutions for the three gene models, especially among the African great ape lineages (fig. S63) (29). Using a branch-site test (43), we find evidence of positive selection for both the fusion gene and the TNFRSF10D1 copy on the human lineage and, more broadly, for both D1 and D2 in other nonhuman apes (P = 0.005; Fig. 4D and figs. S64 and S65). Specifically, we identify a cluster of positively selected sites corresponding to the predicted transmembrane domain of the genes (Fig. 4D and fig. S64).
In contrast to the TNFRSF10D duplication, the DELMEL-NDL variant is absent from all nonhuman apes, suggesting that it is derived (fig. S53). Using a PCR assay (table S17) and seven tagging SNVs [r2 > 0.9 and normalized coefficient of linkage disequilibrium (D′) > 0.9; table S18], we show that the DELMEL-NDL variant is largely restricted to the 1KG South Asian populations where it occurs at low frequencies (<0.07; Fig. 5A and figs. S57 and S66). All three Neanderthal genomes, including the low-coverage Mezmaiskaya1 (24), are homozygous for the DELMEL-NDL haplotype, suggesting that this deletion is fixed in Neanderthals (table S18). We identify strong Neanderthal introgression signals at DELMEL-NDL among Melanesians [P(fD, archaic = Neanderthal) = 0.003 and P(S*) = 0.043; Fig. 4B and fig. S67], as opposed to Denisovan introgression [P(fD, archaic = Denisovan) = 0.06; fig. S68]. Consistent with this, we find that all 15 DELMEL-NDL-linked SGDP haplotypes are more closely related to the Neanderthal haplotypes than any other human haplotype (fig. S69), forming a monophyletic clade in both the haplotype network (Fig. 5B) and maximum likelihood estimated phylogenetic tree (log-likelihood = −21,578; fig. S70) (31). The time to the most recent common ancestor of the Neanderthal and Melanesian DELMEL-NDL-linked haplotypes is 40,000 years ago (95% CI: 0 to 122,000 years ago) and that of all human DELMEL-NDL-linked haplotypes is 120,000 years ago (95% CI: 0 to 241,000 years ago)—both are much younger than the divergence of modern humans and Neanderthals. It is worth noting that the haplotype sharing of the 18.5-kbp sequence between modern humans and Neanderthals is unlikely under a simple model of incomplete lineage sorting (ILS) with reasonable demographic parameters (P = 0.0403) (29).
Fig. 5. Complex evolutionary history and evidence of adaptive archaic introgression at 8p21.3 in Melanesians.

(A) Geographic distribution of the DELMEL-NDL tag SNV, rs367585898, using the 1KG data. (B) Median-joint network showing that all deletion-linked haplotypes form a single clade. Colors represent different haplotypes (DEL and DUP refer to DELMEL-NDL and DUP10D, respectively). Edge width indicates the number of pairwise differences between the joined haplotypes. (C) A highly unusual PBS of DELMEL-NDL in the Melanesians, compared with those computed using variants with similar age in neutral coalescent simulations, supports the hypothesis of positive selection favoring this introgressed variant. CDF, cumulative distribution function. (D) (Top) Schematic model for the evolution of the DELMEL-NDL and DUP10D variants among great ape lineages. Dashed and dotted lines correspond to contemporary and historical lineages, respectively. (Bottom) Pie charts show the numbers of individuals from the 1KG and SGDP panels with or without the two CNVs.
Because the large frequency difference of the DELMEL-DEL haplotype between Melanesians and other populations can be due to the action of natural selection, we specifically tested this hypothesis. Using the deletion variant as a proxy for the beneficial allele and controlling the age of the variant in coalescent simulations (29), we find that the observed PBS value of the DELMEL-DEL deletion allele is significantly higher than expected under a null model of neutral evolution (PBS = 0.933, P = 0.0082; Fig. 5C). Among Melanesians, the deletion allele is always associated with DUP10D. This 6-kbp deletion corresponds to a histone H3 at lysine 27 (H3K27) acetylation peak (skeletal muscle tissue), which by ChIA-PET (chromatin interaction analysis by paired-end tag) analysis associates with multiple members of the tumor necrosis factor receptor superfamily—a gene family critical for apoptosis (45).
From these observations, we developed a model to account for the recent evolution of this 8p21.3 locus (Fig. 5D). Our data support a copy number reduction of TNFRSF10D to create a fusion gene approximately 1.2 to 1.5 million years ago in the ancestral Homo lineage. The presence of the ancestral TNFRSF10D1 and TNFRSF10D2 in some, but not all, modern human populations likely emerged as a result of ILS. A 6-kbp deletion (DELMEL-NDL) located ~5 kbp distal to the TNFRSF10D locus in a putative regulatory region subsequently originated in the Neanderthal lineage, which then introgressed back into the human lineage <120,000 years ago through contact with ancestral non-Africans. We predict that the unusually high frequency of the DELMEL-NDL-linked haplotype in Melanesians is a result of natural selection. The ChIA-PET data suggest that this deletion may affect the expression of nearby genes, such as TNFRSF10C and TNFRSF10D (WashU Epigenome Browser: https://epigenomegateway.wustl.edu).
Discussion
Despite the growing body of evidence for adaptive introgression in humans (5–7), the extent and relative contributions of adaptive introgressed CNVs in human evolution remain largely unexplored. Leveraging sequences from archaic and modern human genomes identifies adaptive introgressed CNV loci, which we resolved and characterized. The enrichment of selective and adaptive introgressed CNVs highlights their potential role in human evolution. Although we cannot rule out potential “hitchhiking” effects due to positive selection acting on nearby genes, the lack of other functional mutations of large effect (i.e., nonsynonymous variants) around our candidate loci suggests that these selection signals are driven by the stratified CNVs identified here and possibly by the genes carried within.
One possible confounding factor in such an analysis is ILS; however, we believe that this has had limited effect for several reasons. First, the time to the most recent common ancestor estimates between the Melanesian and archaic haplotypes at the 16p11.2 and 8p21.3 loci is less than 170,000 years, which is inconsistent with ILS. Second, we account for Melanesian demographic history in determining thresholds of significance for the individual population genetic tests applied here. Finally, tests of positive selection using dN/dS are generally unaffected by ILS (46, 47) and thus cannot account for the signals of positive selection we observe. It should be noted that SNVs that tag the CNV genotypes at the candidate loci of selection in Melanesians are generally specific to Melanesians, with relatively little association in other SGDP populations (9). For example, in the case of the APOBEC3A and APOBEC3B deletion variant, we find 266 SNVs from the 110-kbp region in almost perfect linkage disequilibrium with the deletion allele in Melanesians, but among other East Asian populations the association is weaker (fig. S19).
Although our limited understanding of genotype-phenotype relationships makes it difficult to predict functional consequences of the CNVs at chromosomes 16p11.2 and 8p21.3, we note that chromosome 16p11.2 harbors adaptive signals associated with human-specific gene duplication expansion that may affect iron regulation in human embryonic development (15). This locus also exhibits an enrichment of complex recurrent structural rearrangements, which predisposes humans to the second most common genetic cause of autism, accounting for ~1% of patients (15, 40). In the case of the 8p21.3 CNVs, the Melanesian DUP10D allele is accompanied by a nearby deletion (DELMEL-NDL) that originated in Neanderthals and overlaps with known regulatory signals in human skeletal muscle myoblasts (H3K27Ac markers, UCSC Genome Browser). Notably, TNFRSF10D has been reported as one of the primate-specific genes preferentially expressed in progenitor cells of the human fetal neocortex (48).
Large genomic gains and losses have the potential to create genes that can affect organismal phenotypes. With our increasing understanding of gene flow between various archaic forms and our ancestors, it is tempting to hypothesize that CNV introgression from other hominins may have played a key role in helping humans migrating out of Africa adapt to new environments by serving as a reservoir of beneficial alleles. In addition, this study highlights the substantial large-scale genetic variation that remains to be characterized in the human population and the need for development of additional reference genomes that better capture the diversity of our species and complete our understanding of human genes (11).
Materials and methods summary
We downloaded paired-end Illumina data for 266 fully publicly available human genomes via the SGDP website (27) and called SNVs and indels using the HaplotypeCaller function in Genome Analysis Toolkit (GATK, v3.5). After quality control filtering, these variants were merged with genotypes from the three archaic genomes (http://cdna.eva.mpg.de/)using BCFtools (v1.5). For the SGDP samples, CNV calls were generated using WHAMG, LUMPY (v0.2.13), DELLY2 (v0.7.2), digital comparative genomic hybridization (dCGH), and Genome STRiP (v2.00.1611). We applied only dCGH to the three archaic genomes, owing to the lack of paired-end data in these genomes. Population-stratified CNVs were identified using VST, MWU, and Dmedian statistics, whereas signals of positive selection and archaic introgression were determined using the PBS, fD, and S* statistics (2, 30, 49). Significance of these test results was determined from coalescent simulations based on the best-fit demographic models inferred from ∂a∂i (50) and ADMIXTURE (51). Phylogenetic analyses were performed with a combination of RAxML (v8.2.10), BEAST (v2.5.0), and PAML (v14.9). We used FISH, sequencing of BAC clone inserts, and long-read sequencing data to validate CNVs and assess the breakpoints of complex rearrangements. The high-coverage long-read sequence data from the Melanesian sample was generated using PacBio single-molecule, real-time (SMRT) sequencing technology. We followed the Iso-Seq protocol and used PacBio sequencing (52) to generate the FLNC transcript data. Detailed descriptions of materials and methods are available in the supplementary materials (29).
Supplementary Material
ACKNOWLEDGMENTS
We thank J. Friedlaender, M. Brilliant, and T. Carter for providing access to the Papua New Guinea DNA samples housed at the Marshfield Clinic Research Institute in the Center for Precision Medicine Research; J. Akey for providing additional Papuan DNA samples; T. Brown for assistance in editing this manuscript; J. Friedlaender for helpful comments in the preparation of this manuscript; and D. S. Gordon for help with submitting our data to the NCBI database.
Funding: This work was supported, in part, by U.S. National Institutes of Health (NIH) grant R01HG002385 to E.E.E. S.C. was supported by a National Health and Medical Research Council (NHMRC) C. J. Martin Biomedical Fellowship (1073726). E.E.E. is an investigator of the Howard Hughes Medical Institute.
Footnotes
Competing interests:
E.E.E. is on the scientific advisory board of DNAnexus, Inc. J.G.U. is an employee of Pacific Biosciences, Inc.
Data and material availability:
All data used in this study, including long-read genomic data (HGDP00550), assembled BAC contigs, and Iso-Seq capture transcript data, are deposited in NCBI under BioProject ID PRJNA522307; these data are available to anyone for the purposes of reproducing or extending the analysis. The study design and research protocol were reviewed by Institutional Review Board (49910) at the University of Washington School of Medicine.
SUPPLEMENTARY MATERIALS
REFERENCES AND NOTES
- 1.Tishkoff SA et al. , Convergent adaptation of human lactase persistence in Africa and Europe. Nat. Genet 39, 31–40 (2007). doi: 10.1038/ng1946 [DOI] [PMC free article] [PubMed] [Google Scholar]
- 2.Yi X et al. , Sequencing of 50 human exomes reveals adaptation to high altitude. Science 329, 75–78 (2010). doi: 10.1126/science.1190371 [DOI] [PMC free article] [PubMed] [Google Scholar]
- 3.Fumagalli M et al. , Greenlandic Inuit show genetic signatures of diet and climate adaptation. Science 349, 1343–1347 (2015). doi: 10.1126/science.aab2319 [DOI] [PubMed] [Google Scholar]
- 4.Ilardo MA et al. , Physiological and genetic adaptations to diving in sea nomads. Cell 173, 569–580.e15 (2018). doi: 10.1016/j.cell.2018.03.054 [DOI] [PubMed] [Google Scholar]
- 5.Mendez FL, Watkins JC, Hammer MF, A haplotype at STAT2 Introgressed from neanderthals and serves as a candidate of positive selection in Papua New Guinea. Am. J. Hum. Genet 91, 265–274 (2012). doi: 10.1016/j.ajhg.2012.06.015 [DOI] [PMC free article] [PubMed] [Google Scholar]
- 6.Huerta-Sanchez E et al. , Altitude adaptation in Tibetans caused by introgression of Denisovan-like DNA. Nature 512, 194–197 (2014). doi: 10.1038/nature13408 [DOI] [PMC free article] [PubMed] [Google Scholar]
- 7.Racimo F et al. , Archaic Adaptive Introgression in TBX15/WARS2. Mol. Biol. Evol 34, 509–524 (2017). [DOI] [PMC free article] [PubMed] [Google Scholar]
- 8.Conrad DF et al. , Origins and functional impact of copy number variation in the human genome. Nature 464, 704–712 (2010). doi: 10.1038/nature08516 [DOI] [PMC free article] [PubMed] [Google Scholar]
- 9.Sudmant PH et al. , Global diversity, population stratification, and selection of human copy-number variation. Science 349, aab3761(2015). doi: 10.1126/science.aab3761 [DOI] [PMC free article] [PubMed] [Google Scholar]
- 10.Sudmant PH et al. , An integrated map of structural variation in 2,504 human genomes. Nature 526, 75–81 (2015). doi: 10.1038/nature15394 [DOI] [PMC free article] [PubMed] [Google Scholar]
- 11.Audano PA et al. , Characterizing the major structural variant alleles of the human genome. Cell 176, 663–675.e19 (2019). doi: 10.1016/j.cell.2018.12.019 [DOI] [PMC free article] [PubMed] [Google Scholar]
- 12.Perry GH et al. , Diet and the evolution of human amylase gene copy number variation. Nat. Genet 39, 1256–1260 (2007). doi: 10.1038/ng2123 [DOI] [PMC free article] [PubMed] [Google Scholar]
- 13.Xue Y et al. , Adaptive evolution of UGT2B17 copy-number variation. Am. J. Hum. Genet 83, 337–346 (2008). doi: 10.1016/j.ajhg.2008.08.004 [DOI] [PMC free article] [PubMed] [Google Scholar]
- 14.Hardwick RJ et al. , A worldwide analysis of beta-defensin copy number variation suggests recent selection of a high-expressing DEFB103 gene copy in East Asia. Hum. Mutat 32, 743–750 (2011). doi: 10.1002/humu.21491 [DOI] [PMC free article] [PubMed] [Google Scholar]
- 15.Nuttle X et al. , Emergence of a Homo sapiens-specific gene family and chromosome 16p11.2 CNV susceptibility. Nature 536, 205–209 (2016). doi: 10.1038/nature19075 [DOI] [PMC free article] [PubMed] [Google Scholar]
- 16.Lindeberg S, Nilsson-Ehle P, Vessby B, Lipoprotein composition and serum cholesterol ester fatty acids in nonwesternized Melanesians. Lipids 31, 153–158 (1996). doi: 10.1007/BF02522614 [DOI] [PubMed] [Google Scholar]
- 17.Flint J et al. , High frequencies of alpha-thalassaemia are the result of natural selection by malaria. Nature 321, 744–750 (1986). doi: 10.1038/321744a0 [DOI] [PubMed] [Google Scholar]
- 18.Katzmarzyk PT, Leonard WR, Climatic influences on human body size and proportions: Ecological adaptations and secular trends. Am. J. Phys. Anthropol 106, 483–503 (1998). doi: 10.1002/(SICI)1096-8644(199808)106:4<483::AID-AJPA4>3.0.CO;2-K [DOI] [PubMed] [Google Scholar]
- 19.Malaspinas AS et al. , A genomic history of Aboriginal Australia. Nature 538, 207–214 (2016). doi: 10.1038/nature18299 [DOI] [PMC free article] [PubMed] [Google Scholar]
- 20.Bergstrom A et al. , A Neolithic expansion, but strong genetic structure, in the independent history of New Guinea. Science 357, 1160–1163 (2017). doi: 10.1126/science.aan3842 [DOI] [PMC free article] [PubMed] [Google Scholar]
- 21.Reich D et al. , Genetic history of an archaic hominin group from Denisova Cave in Siberia. Nature 468,1053–1060 (2010). doi: 10.1038/nature09710 [DOI] [PMC free article] [PubMed] [Google Scholar]
- 22.Skoglund P et al. , Genomic insights into the peopling of the Southwest Pacific. Nature 538, 510–513 (2016). doi: 10.1038/nature19844 [DOI] [PMC free article] [PubMed] [Google Scholar]
- 23.Vernot B et al. , Excavating Neandertal and Denisovan DNA from the genomes of Melanesian individuals. Science 352, 235–239 (2016). doi: 10.1126/science.aad9416 [DOI] [PMC free article] [PubMed] [Google Scholar]
- 24.Prufer K et al. , A high-coverage Neandertal genome from Vindija Cave in Croatia. Science 358, 655–658 (2017). doi: 10.1126/science.aao1887 [DOI] [PMC free article] [PubMed] [Google Scholar]
- 25.Meyer M et al. , A high-coverage genome sequence from an archaic Denisovan individual. Science 338, 222–226 (2012). doi: 10.1126/science.1224344 [DOI] [PMC free article] [PubMed] [Google Scholar]
- 26.Prufer K et al. , The complete genome sequence of a Neanderthal from the Altai Mountains. Nature 505, 43–49 (2014). doi: 10.1038/nature12886 [DOI] [PMC free article] [PubMed] [Google Scholar]
- 27.Mallick S et al. , The Simons Genome Diversity Project: 300 genomes from 142 diverse populations. Nature 538, 201–206 (2016). doi: 10.1038/nature18964 [DOI] [PMC free article] [PubMed] [Google Scholar]
- 28.Prado-Martinez J et al. , Great ape genetic diversity and population history. Nature 499, 471–475 (2013). doi: 10.1038/nature12228 [DOI] [PMC free article] [PubMed] [Google Scholar]
- 29.Materials and methods are available as supplementary materials.
- 30.Martin SH, Davey JW, Jiggins CD, Evaluating the use of ABBA-BABA statistics to locate introgressed loci. Mol. Biol. Evol 32, 244–257 (2015). doi: 10.1093/molbev/msu269 [DOI] [PMC free article] [PubMed] [Google Scholar]
- 31.Tillander V, Alexson SEH, Cohen DE, Deactivating Fatty Acids: Acyl-CoA Thioesterase-Mediated Control of Lipid Metabolism. Trends Endocrinol. Metab 28, 473–484 (2017). doi: 10.1016/j.tem.2017.03.001 [DOI] [PMC free article] [PubMed] [Google Scholar]
- 32.Kidd JM, Newman TL, Tuzun E, Kaul R, Eichler EE, Population stratification of a common APOBEC gene deletion polymorphism. PLOS Genet. 3, e63(2007). doi: 10.1371/journal.pgen.0030063 [DOI] [PMC free article] [PubMed] [Google Scholar]
- 33.An P et al. , APOBEC3B deletion and risk of HIV-1 acquisition. J. Infect. Dis 200, 1054–1058 (2009). doi: 10.1086/605644 [DOI] [PMC free article] [PubMed] [Google Scholar]
- 34.Smith NJ, Fenton TR, The APOBEC3 genes and their role in cancer: Insights from human papillomavirus. J. Mol. Endocrinol 62, R269–R287 (2019). doi: 10.1530/JME-19-0011 [DOI] [PubMed] [Google Scholar]
- 35.Qi YY et al. , DEFA gene variants associated with IgA nephropathy in a Chinese population. Genes Immun. 16, 231–237 (2015). doi: 10.1038/gene.2015.1 [DOI] [PubMed] [Google Scholar]
- 36.Mohajeri K et al. , Interchromosomal core duplicons drive both evolutionary instability and disease susceptibility of the Chromosome 8p23.1 region. Genome Res. 26, 1453–1467 (2016). doi: 10.1101/gr.211284.116 [DOI] [PMC free article] [PubMed] [Google Scholar]
- 37.Steinberg KM et al. , Structural diversity and African origin of the 17q21.31 inversion polymorphism. Nat. Genet 44, 872–880 (2012). doi: 10.1038/ng.2335 [DOI] [PMC free article] [PubMed] [Google Scholar]
- 38.Stefansson H et al. , A common inversion under selection in Europeans. Nat. Genet 37,129–137 (2005). doi: 10.1038/ng1508 [DOI] [PubMed] [Google Scholar]
- 39.Antonacci F et al. , A large and complex structural polymorphism at 16p12.1 underlies microdeletion disease risk. Nat. Genet 42, 745–750 (2010). doi: 10.1038/ng.643 [DOI] [PMC free article] [PubMed] [Google Scholar]
- 40.Weiss LA et al. , Association between microdeletion and microduplication at 16p11.2 and autism. N. Engl. J. Med 358, 667–675 (2008). doi: 10.1056/NEJMoa075974 [DOI] [PubMed] [Google Scholar]
- 41.Vollger MR et al. , Long-read sequence and assembly of segmental duplications. Nat. Methods 16, 88–94 (2019). doi: 10.1038/s41592-018-0236-3 [DOI] [PMC free article] [PubMed] [Google Scholar]
- 42.Johnson ME et al. , Positive selection of a gene family during the emergence of humans and African apes. Nature 413, 514–519 (2001). doi: 10.1038/35097067 [DOI] [PubMed] [Google Scholar]
- 43.Yang Z, PAML 4: Phylogenetic analysis by maximum likelihood. Mol. Biol. Evol 24,1586–1591 (2007). doi: 10.1093/molbev/msm088 [DOI] [PubMed] [Google Scholar]
- 44.Coe BP et al. , Neurodevelopmental disease genes implicated by de novo mutation and copy number variation morbidity. Nat. Genet 51, 106–116 (2019). doi: 10.1038/s41588-018-0288-4 [DOI] [PMC free article] [PubMed] [Google Scholar]
- 45.Pan G, Ni J, Yu G, Wei YF, Dixit VM, TRUNDD, a new member of the TRAIL receptor family that antagonizes TRAIL signalling. FEBS Lett. 424, 41–45 (1998). doi: 10.1016/S0014-5793(98)00135-5 [DOI] [PubMed] [Google Scholar]
- 46.Scally A et al. , Insights into hominid evolution from the gorilla genome sequence. Nature 483, 169–175 (2012). doi: 10.1038/nature10842 [DOI] [PMC free article] [PubMed] [Google Scholar]
- 47.Pollard DA, Iyer VN, Moses AM, Eisen MB, Widespread discordance of gene trees with species tree in Drosophila: Evidence for incomplete lineage sorting. PLOS Genet. 2, e173(2006). doi: 10.1371/journal.pgen.0020173 [DOI] [PMC free article] [PubMed] [Google Scholar]
- 48.Florio M et al. , Evolution and cell-type specificity of human-specific genes preferentially expressed in progenitors of fetal neocortex. eLife 7, e32332(2018). doi: 10.7554/eLife.32332 [DOI] [PMC free article] [PubMed] [Google Scholar]
- 49.Plagnol V, Wall JD, Possible ancestral structure in human populations. PLOS Genet. 2, e105(2006). doi: 10.1371/journal.pgen.0020105 [DOI] [PMC free article] [PubMed] [Google Scholar]
- 50.Gutenkunst RN, Hernandez RD, Williamson SH, Bustamante CD, Inferring the joint demographic history of multiple populations from multidimensional SNP frequency data. PLOS Genet. 5, e1000695(2009). doi: 10.1371/journal.pgen.1000695 [DOI] [PMC free article] [PubMed] [Google Scholar]
- 51.Alexander DH, Novembre J, Lange K, Fast model-based estimation of ancestry in unrelated individuals. Genome Res. 19, 1655–1664 (2009). doi: 10.1101/gr.094052.109 [DOI] [PMC free article] [PubMed] [Google Scholar]
- 52.Dougherty ML et al. , Transcriptional fates of human-specific segmental duplications in brain. Genome Res. 28, 1566–1576 (2018). doi: 10.1101/gr.237610.118 [DOI] [PMC free article] [PubMed] [Google Scholar]
Associated Data
This section collects any data citations, data availability statements, or supplementary materials included in this article.