Abstract
In nature, plants experience large fluctuations in light intensity and they need to balance the absorption and utilization of this energy accordingly. Non-photochemical quenching (NPQ) is a rapidly-switchable mechanism which protects plants from photodamage caused by high light exposure by dissipating the energy absorbed in excess as heat. It is triggered by the ΔpH across the thylakoid membrane and requires the presence of the protein PsbS and the xanthophyll zeaxanthin. However, the site and mechanism of the quencher(s) remain equivocal. Here, we constructed a mutant of Arabidopsis thaliana which lacks LHCII, the main antenna complexes of plants, to verify its contribution to NPQ. The mutant has normally stacked thylakoid membranes, displays no upregulation of other LHCs but shows a relative decrease in PSI which compensates for the decrease of the PSII antenna. The mutant exhibits a ~60% reduction in NPQ, while the remaining NPQ resembles that of the Chl b-less mutant, which lacks all PSII peripheral antenna complexes. We thus report that PsbS-dependent NPQ mainly occurs within LHCII, but there is an additional quenching site within the PSII core.
Introduction
Photosystem II (PSII) is the multimeric pigment-protein complex responsible for catalyzing the first steps of oxygenic photosynthesis. It uses light energy to induce stable charge separation in the reaction center (RC), initiating a series of downhill redox reactions that ultimately drive the synthesis of organic molecules from inorganic carbon.
In vascular plants, PSII is organized into supercomplexes consisting of a core and a peripheral antenna1. The core is composed of the RC complex and two antenna proteins, CP43 and CP47, which bind chlorophylls (Chls) a and carotenoids2. The peripheral antenna is made up of Light-Harvesting Complexes (LHCs), a family of integral membrane proteins which bind Chls a, Chls b and carotenoids3. LHCII, the major complex, is a trimer composed of the isoforms Lhcb1, Lhcb2 and Lhcb34. There are 1-3 trimers per PSII core and together they coordinate ~65% of total PSII chlorophyll1,5. The minor antennae, CP24, CP26 and CP29, are monomers present in a 1:1 ratio per PSII core and together coordinate ~20% of total PSII Chl1. These antenna complexes increase the absorption cross section of the core by harvesting light and transferring the excitation energy to the RC6. However, due to natural fluctuations in light intensity, the amount of light absorbed often exceeds the capacity of the electron transfer reactions. In this situation, the excess of excitation energy may result in the formation of reactive oxygen species which can irreversibly damage PSII and cause a sustained decline in photosynthetic efficiency7. To prevent this from occurring, most photosynthetic organisms have evolved mechanisms to dissipate excess excitation energy as heat, a process termed non-photochemical quenching (NPQ)8.
In vascular plants, activation of NPQ requires (1) acidification of the thylakoid lumen9 (2) protonation of the protein PsbS10,11, and (3) the xanthophyll zeaxanthin12,13. It is unclear what role PsbS plays following protonation, although the fact that it has no bound pigments suggests that it is not acting as a direct quencher14,15. The role of zeaxanthin is also unclear; it has been proposed to play either a direct role in quenching16 or an indirect role, inducing conformational or organizational changes in the PSII antenna8.
The precise location of quenching in the PSII supercomplex has been the subject of an intense debate since the 1980s. A predominant idea in the literature is that it occurs in LHCII. This was first proposed by Horton and Ruban following the observation that in vitro aggregates of LHCII are highly quenched17. This type of quenching was shown to have characteristics similar to NPQ as it was enhanced by low pH and zeaxanthin18–20. More recently, the formation of LHCII clusters was shown to occur in vivo using freeze-fracture electron microscopy of intact membranes21. This clustering was induced by high light, reversible in the dark and enhanced by the presence of PsbS and zeaxanthin21,22.
An alternative model, is that of zeaxanthin-dependent quenching in the minor antennae. The proposal originated from the observation that CP29 and CP26 could be reversibly protonated and that the minor antennae appeared to have a relatively high affinity for zeaxanthin23–25. It has also been suggested that the two models are not necessarily mutually exclusive. Holzwarth et al. (2009) proposed a two-site quenching model in which the first site (Q1) is PsbS-dependent and is formed in functionally detached LHCII, and a second site (Q2) is zeaxanthin-dependent and formed in the minor antennae26.
Despite the availability of knock-down and knock-out plants for each LHC, the contribution of each of the complexes to NPQ has remained unclear27–29. Due to the location of CP24, CP26, and CP29 between the core and LHCII, the effect of deleting the minor antennae on NPQ is distorted by concomitant structural changes in the PSII supercomplex27,30. Similarly, knock-down of LHCII has previously resulted in the upregulation of CP26 and the formation of Lhcb3/CP26 trimers29. These proxy trimers have been said to partially take on the role of LHCII, including the role in energy dissipation, explaining the mere ~30% reduction in NPQ8,31.
In the present study we have used amiRNA knock down in Arabidopsis thaliana to effectively silence Lhcb1 and Lhcb2 and thereby remove LHCII trimers in vivo. In these plants, named NoLHCII, we see no upregulation of other LHCs or the formation of proxy trimers. With this system we are able to directly verify the contribution of LHCII to NPQ.
NoLHCII is a mutant of Arabidopsis lacking LHCII trimers
LHCII trimers are composed of varying combinations of the three isoforms, Lhcb1, Lhcb2, and Lhcb3. We have crossed two amiRNA knockdown lines, amiLhcb1and amiLhcb232 for effective silencing of the eight genes encoding the two most abundant isoforms, Lhcb1 and Lhcb2. While Lhcb3 remains, this isoform is unable to homotrimerise and accounts for only ~10% of WT LHCII under normal growth conditions4,33.
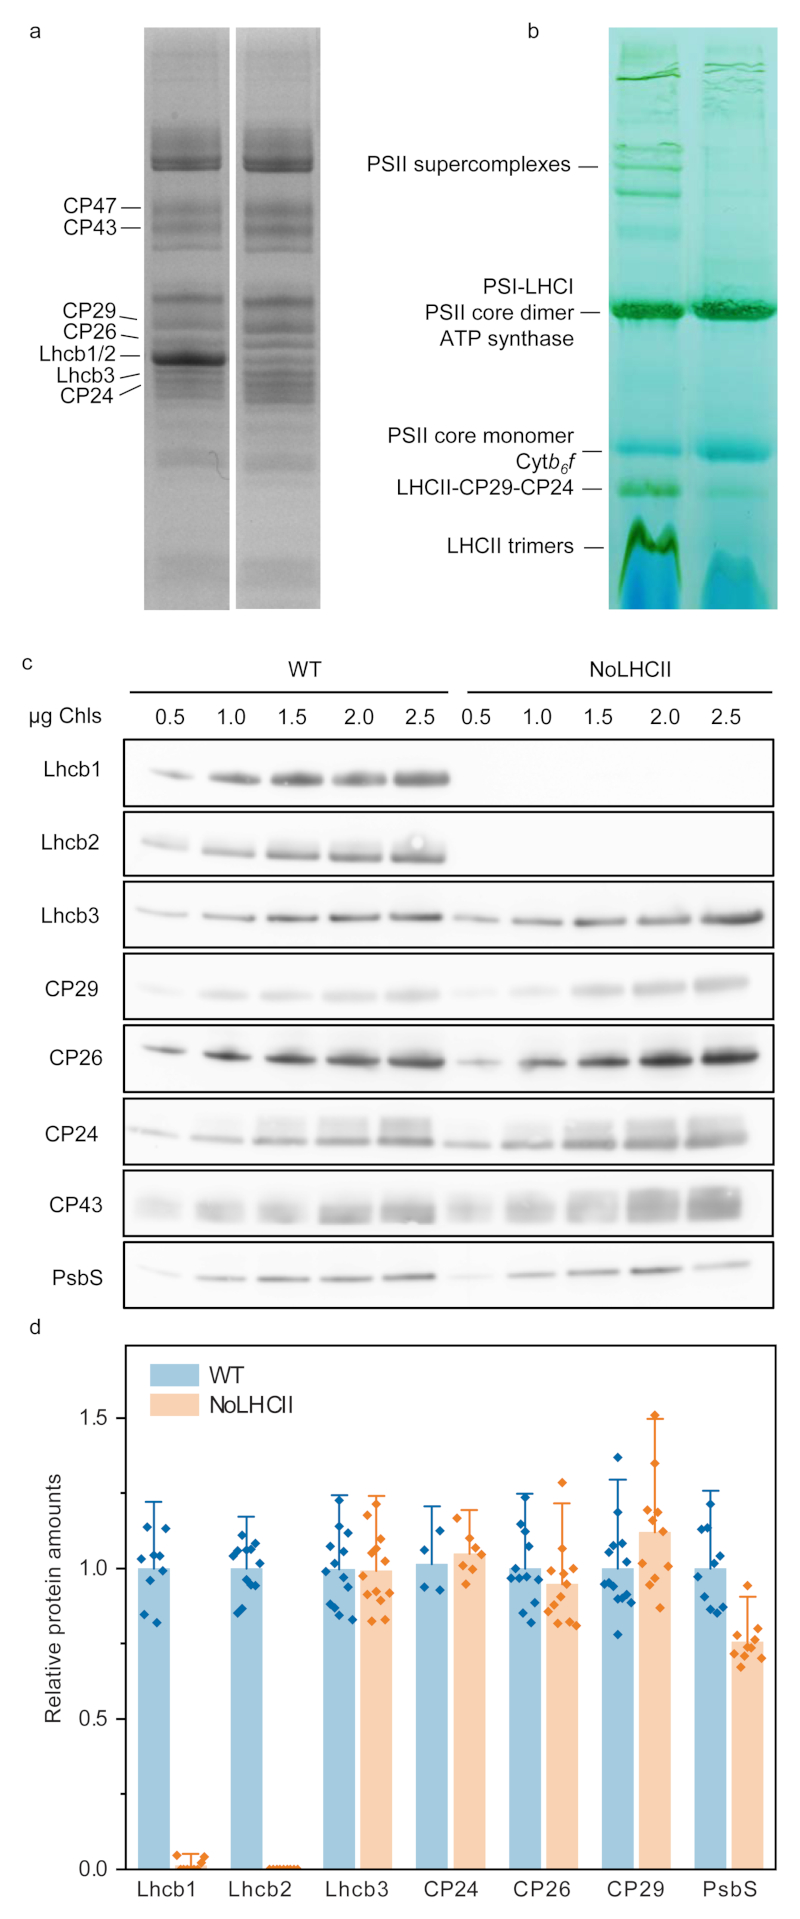
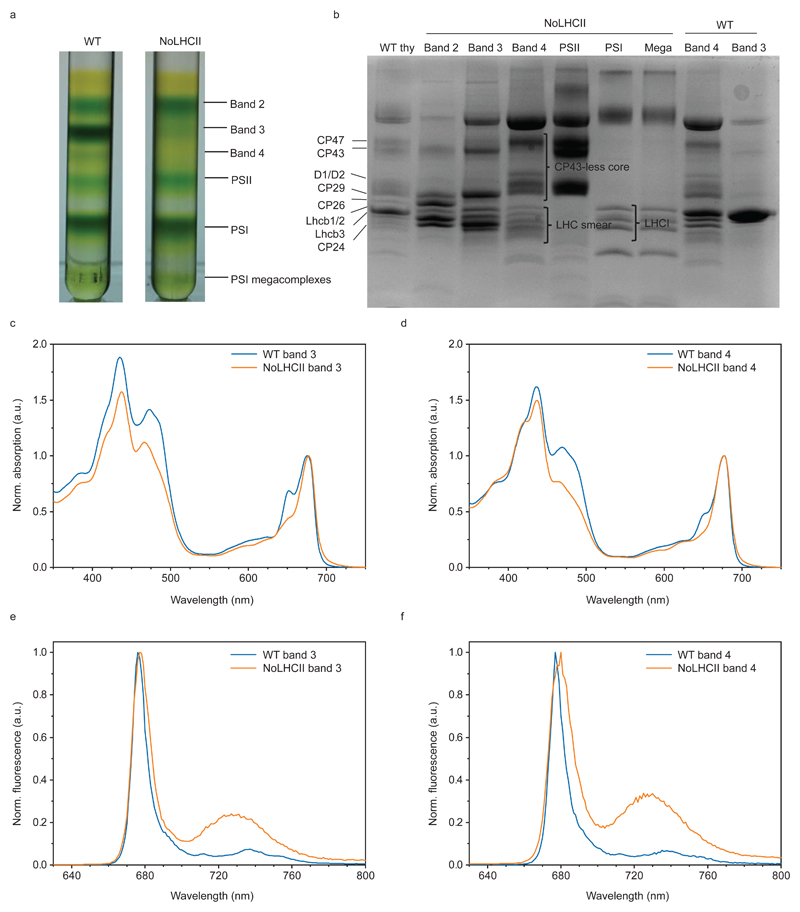
The micro-antisense silencing was effective at reducing Lhcb1 and Lhcb2 to <5% and <1% of that of WT (Figure 1a, c, d). The absence of LHC trimers and larger PSII supercomplexes was confirmed by blue native PAGE (Figure 1b). The band which appears at the same level as the LHCII-CP29-CP24 assembly in WT was found to be a PSII core repair intermediate (CP43-less PSII core) co-migrating with small quantities of loose PSI antenna complexes (LHCI) (Extended Data 1). All other PSII antenna proteins remained in a similar stoichiometry with the PSII core (Figure 1c, d).
Figure 1.
Biochemical characterization of NoLHCII. (a) Coomassie-stained SDS-PAGE of WT and NoLHCII thylakoids. (b) BN-Page of WT and NoLHCII thylakoid membranes solubilized with 1% α-DM. (c) Immunoblots of WT and NoLHCII PSII antenna proteins. Thylakoids were loaded onto the SDS-Page gel in increasing amounts of Chl content to check for signal linearity. Non-linear signals were excluded from the analysis. (a-c) Experiments were repeated independently three times with similar results. (d) Results of immunoblot analysis. Signal intensity was normalized to the corresponding WT signal and to the quantity of PSII core (CP43). The bar graph shows the mean + s.d. Each individual data point is overlayed.
NoLHCII phenotype
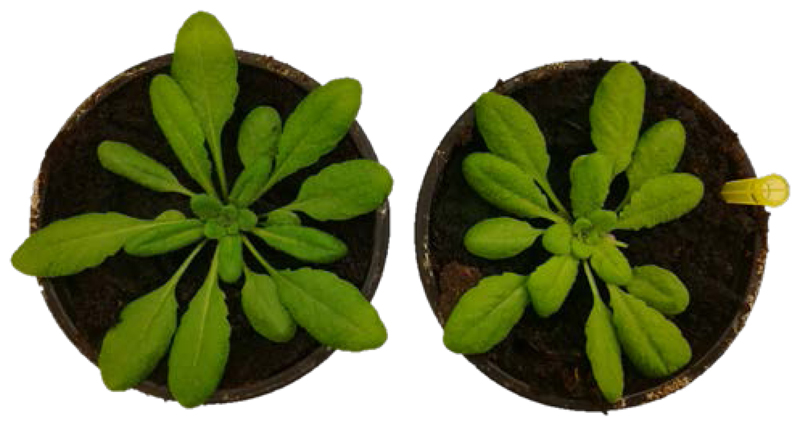
When grown in a climate chamber under controlled conditions NoLHCII plants exhibit a pale green phenotype and a slightly smaller rosette size than WT (Figure 2). The loss of LHCII results in a 42% decrease in Chl content per leaf area, an increase in Chl a/b ratio and an overall reduction in leaf absorption (Table 1). The maximal photochemical yield of PSII (FV/FM) was 0.75 ± 0.02 in NoLHCII versus 0.82 ± 0.01 in wild type.
Figure 2.
Phenotype of WT (left) and NoLHCII (right) after growing for 4 weeks under 120 μmol photons m−2 s−1, in 12/12 hour light/dark cycle. This experiment was repeated independently three times with similar results.
Table 1. Measurements of key photosynthetic parameters of Arabidopsis WT and NoLHCII.
| Chl a/b | Chl/Car | Rel. Chl/leaf area | Leaf absorbance | FV/FM |
|---|---|---|---|---|
| WT 3.45 ± 0.01 | 3.62 ± 0.02 | 1 .00 ± 0.08 | 0.86 ± 0.01 | 0.82 ± 0.01 |
| NoLHCII 4.40 ± 0.01 | 3.76 ± 0.01 | 0.58 ± 0.05 | 0.79 ± 0.01 | 0.75 ± 0.02 |
Values are mean ± s.d. (n = 5 biologically independent samples).
Functional antenna size
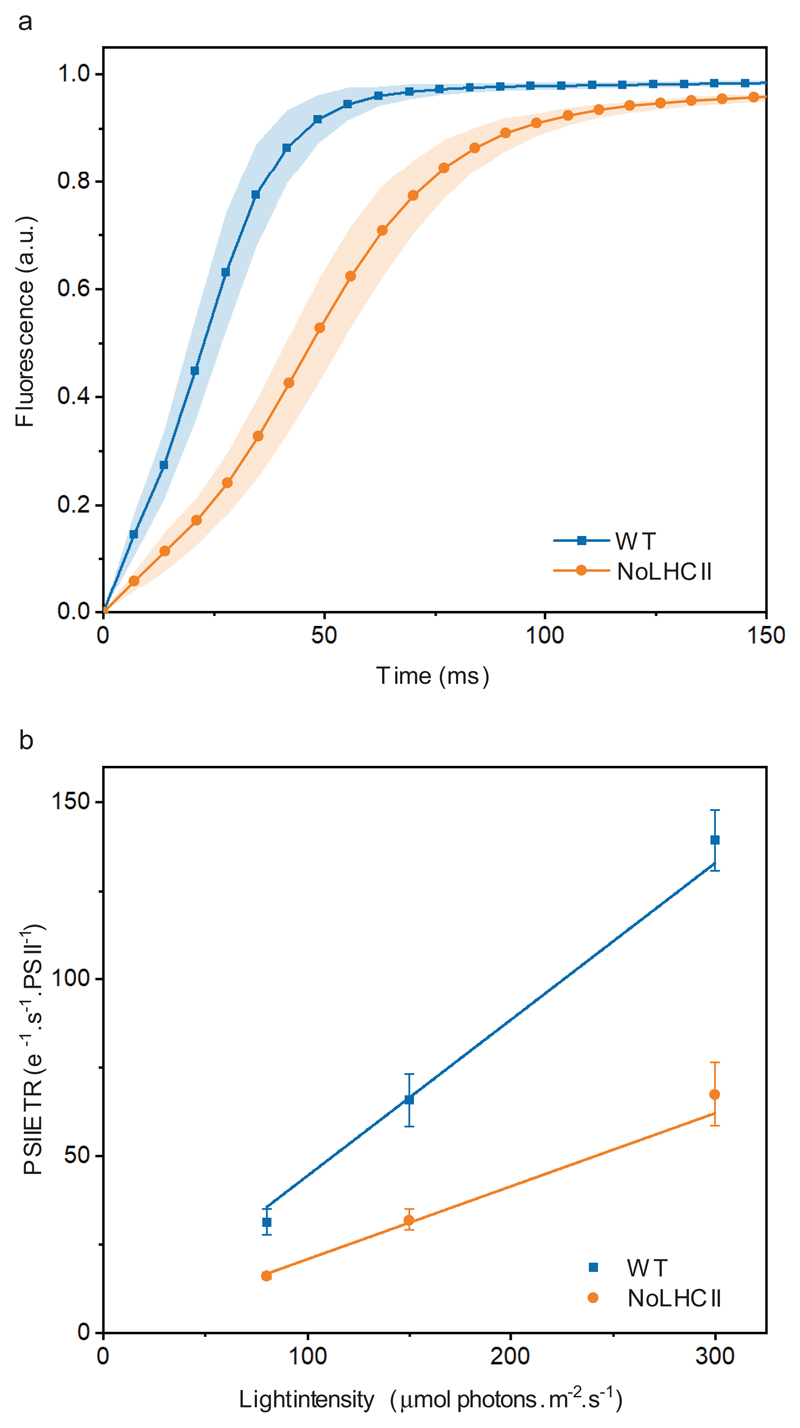
To assess the functional antenna size of PSII, fluorescence induction measurements were performed on DCMU (3-(3,4-dichlorophenyl)-1,1-dimethylurea)-infiltrated leaves (Figure 3a). In the presence of DCMU, the rise to the fluorescence maximum (FM) represents a single, stable charge separation in PSII, the rate of which is directly proportional to light intensity and functional antenna size34,35. Electron transport rates for both WT and NoLHCII increase linearly with light intensity, however the slope of this linear fit is reduced in NoLHCII, corresponding to a 53 ± 1.3% decrease in PSII functional antenna size (Figure 3b, Supplementary Table 1).
Figure 3.
Functional antenna size of PSII. (a) Chl fluorescence induction curves of both WT and NoLHCII measured in the presence of DCMU using sub-saturating light of 80 μmol photons m−2 s−1. (b) The light-limited, maximal PSII electron transport rate (ETR) of WT and NoLHCII determined using sub-saturating light of 80, 150 and 300 μmol photons m−2 s−1. See Supplementary Table 1 for the fitting parameters. The data in both panels represent the mean ± s.d. (n = 5 biologically independent experiments)
Adjustment of PSI/PSII stoichiometry
The even distribution of excitation energy reaching PSI and PSII is critical for maintaining a high efficiency of photosynthesis. To account for the 53% reduction in PSII antenna size, one might expect a decrease in the PSI:PSII reaction center ratio. This was tested using the electrochromic shift (ECS) of carotenoid absorption, which is proportional to the number of light-induced charge separations occurring in both PSI and PSII36. The relative contributions of each photosystem can be calculated from the difference in signal measured in the presence or absence of PSII inhibitors, DCMU and hydroxylamine. Using this technique, we found that NoLHCII has a PSI:PSII ratio of 0.41 ± 0.07 compared to 0.75 ± 0.08 in WT (mean ± s.d.; n = 4) (Supplementary Figure 1). Thus, the smaller cross-section of PSII is compensated by a relatively lower PSI content.
Thylakoid ultrastructure
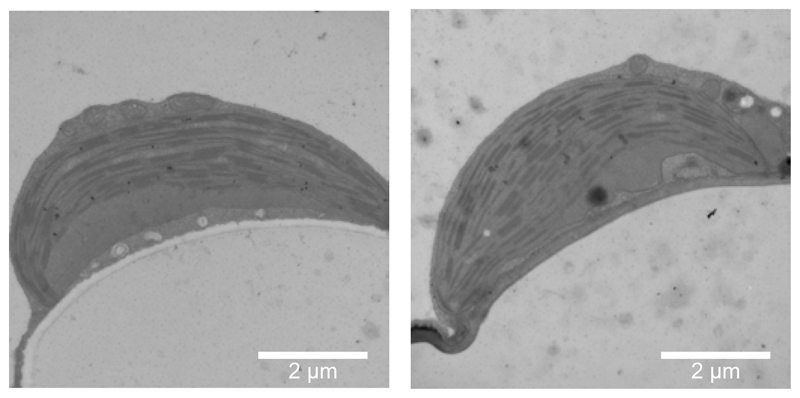
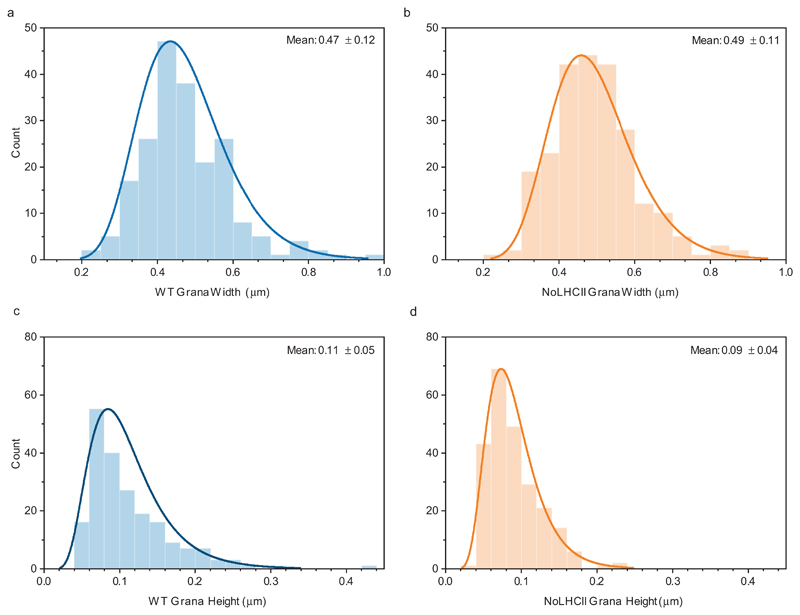
PSII supercomplexes are largely localized in the stacked regions of the thylakoid membrane called the grana, while PSI is localized in the unstacked region called the stroma lamellae37. Absence of grana can lead to a mixing of PSI and PSII and the photochemical quenching of excitation energy by PSI in what is termed “spillover”38. Currently there is contradictory information regarding the importance of LHCII to the formation of grana stacks39,40, therefore it was essential to check the thylakoid ultrastructure in NoLHCII plants. Upon inspection of chloroplasts using transmission electron microscopy we found that the extent of thylakoid stacking was similar in both WT and NoLHCII (Figure 4). There is a small but significant decrease in NoLHCII grana height, but no significant change to the width of these stacks (Extended Data 2).
Figure 4.
Electron micrographs of representative WT (left) and NoLHCII (right) chloroplasts. This experiment was repeated on three biologically independent samples with similar results.
NPQ without LHCII
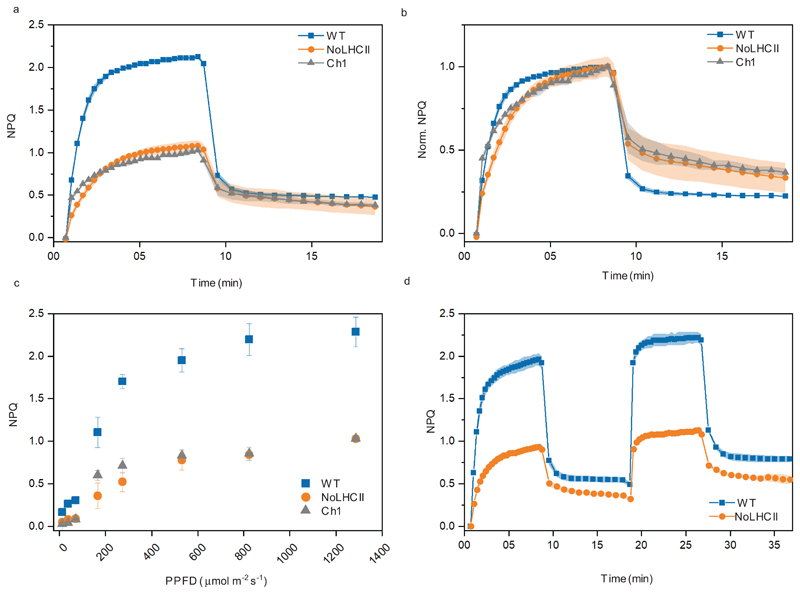
The capacity of NoLHCII to dissipate excess energy was measured by the non-photochemical quenching of chlorophyll fluorescence under high light intensities. Compared to WT, NoLHCII plants exhibit a ~60% reduction in the steady-state level of NPQ (Figure 5a) and this has similar, although slightly slower, induction kinetics to WT and is largely reversible (Figure 5b).
Figure 5.
NPQ characteristics of WT, NoLHCII and Ch1 plants. (a) NPQ kinetics when illuminated with 1287 μmol photons m−2 s−1. (b) Normalised NPQ kinetics. (c) Steady-state NPQ levels measured in a range of actinic light intensities. (d) NPQ kinetics with two periods of light induction, both at 1287 μmol photons m−2 s−1. (a-d) The data represent the mean ± s.d (n = 3 biologically independent experiments).
Given the significant difference in functional antenna size, we measured steady-state NPQ levels over a range of light intensities to ensure light absorption was not a limiting factor in NPQ induction (Figure 5c). The amplitude of NPQ is found to be saturating in light intensities of 1287 μmol photons m−2 s−1 in both WT and NoLHCII. When the kinetics of NPQ are compared to WT under the same excitation intensity per PSII, similar results are observed (Supplementary Figure 2).
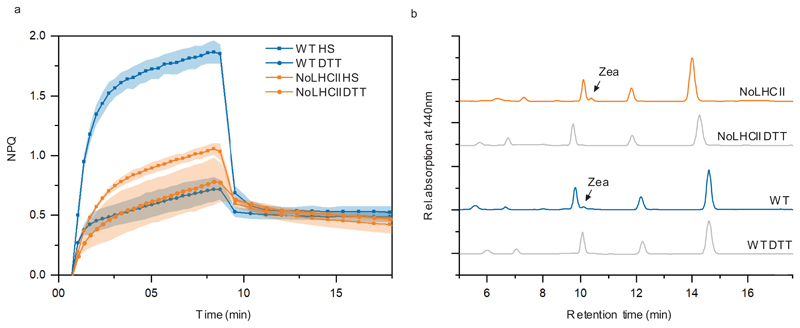
The level of NPQ is also known to be affected by the quantity of PsbS and zeaxanthin in the thylakoid membrane10,41. Immunoblot analysis of WT and NoLHCII thylakoids indicated there were no significant differences in the level of PsbS relative to the PSII core (Figure 1c, d) and HPLC analysis showed no significant difference in the amount of zeaxanthin in WT and NoLHCII leaves during maximum NPQ induction (Extended Data 3). Overall, the data suggest that the reduction of NPQ can be attributed to the loss of quenching sites in LHCII.
To determine the origin of the remaining quenching we also measured NPQ in the Chl-b less mutant Ch1 (Figure 5a-c). Due to the lack of Chl b, almost all PSII peripheral antenna fail to accumulate in the thylakoid membrane42,43. The minor antenna complex, CP26, is the only PSII antenna protein present, although this was shown to be an apoprotein, which did not contain chlorophylls or contribute to the functional antenna43. We therefore expect that any quenching present in the Ch1 mutant is arising from the PSII core. The NPQ of these two mutants is remarkably similar, apart from the initial onset of NPQ which appears to be slightly faster in Ch1 than NoLHCII, they both reach the same total level and follow similar kinetics of recovery in darkness (Figure 5a-c). This suggests that they both share a common, light-inducible quenching mechanism involving the PSII core.
To test if this quenching was zeaxanthin-dependent, we measured NPQ over two illumination periods separated by a period of dark recovery (Figure 5d). Zeaxanthin is formed during the first illumination period and is immediately present upon the onset of the second illumination due to the comparatively slow conversion of zeaxanthin back to violaxanthin in the dark44. The presence of zeaxanthin in the membrane causes an almost instantaneous rise to maximal NPQ and this is observed in both WT and NoLHCII suggesting that zeaxanthin is playing an active role in NPQ in these plants. This was confirmed via a reduction in NPQ following vacuum infiltration of NoLHCII leaves with dithiotheitol (DTT), a reducing agent which prevents the conversion of violaxanthin to zeaxanthin by inhibition of violaxanthin de-epoxidase (Extended Data 4)45,46.
Discussion & conclusions
NPQ is an important mechanism for plants to protect themselves under rapidly fluctuating light intensities. Since the discovery of NPQ in plant chloroplasts approximately 50 years ago47,48, the precise location of quenching has still not been unequivocally proven. Currently, there is debate as to whether it is occurring in LHCII8,49, the minor antennae50 or both26,51 but there has also been suggestion of a quenching mechanism in the PSII core43. To disentangle the contributions of these three components of the PSII supercomplex to NPQ we compare the steady-state NPQ levels of WT plants, plants devoid of LHCII (NoLHCII) and plants lacking both LHCII and minor antenna (Ch1).
To measure the contribution of LHCII to quenching we have developed an Arabidopsis mutant which is devoid of LHCII trimers. In these plants we observe a ~60% decrease in NPQ, which we attribute to the loss of quenching sites in LHCII. This is due to the fact that (a) we did not observe any significant changes to the levels of PsbS, zeaxanthin, or grana stacking which have been shown to affect the level of NPQ10,38,41, and (b) the level of NPQ saturates under increasing light intensities, ruling out reduced light harvesting capacity as a factor limiting NPQ induction. This decrease in NPQ is much larger than what was observed in the LHCII knockdown lines generated by Andersson et al. (2003)29. The difference can be explained by the fact that we did not observe upregulation of the minor antenna complexes, or the formation of trimers in our plants.
In the absence of LHCII there is still a significant amount of NPQ occurring and this must originate from a quenching site in the minor antenna and/or the PSII core. To determine the contribution of each, we also measured NPQ in the Chl-b less mutant, Ch1, which lacks all PSII peripheral antenna42,43. This mutant has previously been shown to have NPQ which was tentatively attributed to a RC quenching mechanism within the PSII core43. The capacity to perform NPQ is almost identical in NoLHCII and Ch1, suggesting that the core is the main contributor to NPQ in our mutant.
A quenching site in the core is in line with the recent paper by Farooq et al. (2018) whereby measuring ultrafast time-resolved fluorescence of intact leaves, the authors observe the immediate appearance and disappearance of a distinct quenching mechanism in response to the closing and reopening of the PSII RC52. This phenomenon can only be explained if there is a quenching site close to the RC, which can rapidly respond to signatures of the open and closed states52.
The absence of rapid and reversible quenching in the PsbS KO mutant10,11,53 suggests that the quenching in the core is a PsbS-dependent process. Accordingly, we envisage a scenario in which PsbS docks to the core antenna complexes, CP43 or CP47, and influences its surrounding environment to produce a quenching site. This is supported by the biochemical analysis of PsbS interaction partners54. The data reveal a strong interaction with LHCII trimers and PSII core proteins, particularly CP47, in the dark-adapted state, which is further enhanced in the NPQ-activated state. Moreover, the recently resolved structure of the C2S2M2 PSII supercomplex, shows a cleft between CP24 and CP47, which is able to fit PsbS in manual docking simulations1.
Our results also indicate that the minor antenna complexes can only have a limited effect on quenching. Recently, a triple knockout mutant lacking all minor antennae was shown to have the same total level of NPQ as WT, but altered kinetics of NPQ formation, with a transient period of fluorescence recovery in the first few minutes of illumination51. From this it was concluded that an early phase of NPQ was catalysed within the monomeric LHC proteins. However, due to the role of the minor antennae in structurally and energetically connecting LHCII to the PSII core, there is a large pool of poorly connected LHCII, possessing long fluorescence lifetimes in this mutant30. It has since been suggested that the disruption of the PSII supercomplex, rather than the specific loss of quenching sites in the minor antennae is the cause of the altered NPQ kinetics in this mutant55.
To conclude, our results show that the majority of NPQ occurs in LHCII, but there is an additional site of PsbS-dependent quenching in the PSII core, most likely in the core antenna complexes CP43 and/or CP47.
Methods
Plant material and growth conditions
NoLHCII plants were generated by crossing hemizygous amiLhcb1 and homozygous amiLhcb2 mutant lines32. We used plants from a single line in the third generation, as subsequent generations displayed increasing expression of both Lhcb1 and Lhcb2. Four-week-old plants lacking Lhcb1 could be identified by a distinctive pale green phenotype, each of these plants was then systematically screened by Western blotting using Lhcb1 and Lhcb2 antibodies (Agrisera, Sweden). Plants containing less than 5% Lhcb1 and 1% Lhcb2 were used for further analyses.
Arabidopsis thaliana WT (Col-0) and NoLHCII were grown under 120 μmol photons m−2 s−1, 21 °C/18 °C, 12/12 day/night cycle for 4-6 weeks. Ch1 plants (chlorophyll b-lacking mutants)42 were grown under the same conditions but for 8-10 weeks. To induce light stress, 5-week-old WT and NoLHCII plants were exposed to 1200 μmol photons m−2 s−1 for 30 minutes and leaves were frozen immediately in liquid nitrogen.
Thylakoid membrane isolation and sucrose density gradients
Thylakoid membrane preparations were performed as described previously56. WT and NoLHCII thylakoids, solubilized with 0.6% α-DM at a concentration of 0.5 mg Chl/mL, were loaded on sucrose density gradients, made by freezing and thawing 0.5 M sucrose, 0.03% α-DM and 20 mM Hepes (pH 7.5), and centrifuged at 41000 rpm for 14 hours at 4°C. The bands were harvested with a syringe.
Gel electrophoresis and immunoblotting
SDS-page gels were performed using a Tricine-SDS PAGE system described in57 with a 4% stacking and 12% running gel.
Immunoblotting was performed using antibodies from Agrisera and protein levels were determined using Image Studio™ Lite (LI-COR, US). Five different quantities (0.5, 1.0, 1.5, 2.0 and 2.5 μg) of total thylakoid Chl were loaded for each sample to confirm that the antibody signal was linearly proportional to sample quantity. The values were normalized to both CP43 (PSII core subunit) and to their respective WT level.
BN-PAGE was performed as in58 with a 4% stacking and 4–12.5% resolving gel polymerized from a 32:1 bis-acrylamide/acrylamide mixture. A total of 8 μg of Chl was loaded per lane, with a final Chl concentration of 0.5 mg/mL and final detergent concentration of 1% α-DDM.
Pigment analysis
Pigments were extracted from frozen leaves in 80% acetone. Room temperature absorption spectra were recorded on a Varian Cary 4000 UV–vis spectrophotometer. Chl a/b and Chl/carotenoid ratios were calculated by fitting the absorption spectrum of the pigment extract with the spectra of the individual pigments. The relative amount of carotenoids was determined by HPLC as described by59 with modifications as reported in56.
Transmission spectra of intact leaves were measured on the Varian Cary 4000 UV–vis spectrophotometer equipped with an integrating sphere. The transmission was integrated over 350-700 nm and 1-%T was used to calculate leaf absorbance. Fluorescence spectra at 77 K were recorded using a cold finger filled with liquid nitrogen in a Fluorolog 3.22 spectrofluorimeter (Jobin Yvon-Spex, Japan).
PSI/PSII ratio
The PSI/PSII ratio was determined using the JTS-10 spectrometer (BioLogic, France) in the absorption mode, using the electrochromic signal36. In brief, charge separation by the Photosystems forms a homogenous, trans-thylakoid electric field which shifts the absorption spectra of carotenoids present in the membrane. These changes are observable in the blue-green region of the spectrum. PSI and PSII charge separation capacity was estimated by applying a single turnover, saturating laser flash (fluorescent dye emitting at ~630 nm pumped with a 5 ns full width at half maximum (FWHM) Nd:YAG laser flashes at 532 nm; Minilite II, Continuum, USA) and measuring the amplitude of the ECS signal at 520 nm shortly after (300 μs) the flash to avoid slower electron transfer events contributing to the ECS signal. The signal was corrected for small changes by subtracting the signal at 546 nm (see Supplementary Figure 1 for the raw data; both wavelengths were selected by filtering white detecting LEDs with 10 mm thick, 10 nm FWHM filters; Schott, Germany; The actinic light was blocked from reaching the detectors with 3 mm thick BG39 bandpass filters (Schott) at both detection wavelengths). To deconvolute the contribution of each photosystem to the ECS signal, measurements were performed on leaves infiltrated with 10 mM HEPES (pH 7) and 150 mM sorbitol solution (PSII+PSI signal) and with PSII inhibitors (200 μM DCMU and 1 mM hydroxylamine in HEPES-sorbitol; PSI signal only). The maximal photochemical yield of PSII (FV/FM) was systematically verified to attain values below 0.02, thus confirming successful PSII inhibition.
Functional antenna size measurements
Fluorescence induction kinetics were measured using the JTS-10 spectrometer (BioLogic) in fluorescence mode. Dark-adapted leaves were infiltrated with HEPES-sorbitol solution (see above) containing 200 μM DCMU. White light from detecting LEDs was filtered through 10 mm thick, 10 nm FWHM, 520 nm filter (Schott) to obtain the fluorescence signal. Red actinic light from LEDs peaking at 630 nm at various sub-saturating intensities (80, 150 and 300 μmol photons m−2 s−1) was used to induce fluorescence yield changes. It was systematically verified with a pulse of saturating light (~ 3000 photons s-1 PSII-1) that the DCMU quantity was saturating and the FM (maximal yield of PSII fluorescence, when the QA quinone is fully reduced) was successfully reached even at low light intensity.
The reciprocal of the integrated area above the DCMU fluorescence curve translates to the average time needed for photon absorption and a single, stable charge separation by a PSII i.e. the PSII electron transport rate (ETR)34,35. Because the light intensity is sub-saturating, PSII ETR directly depends on its functional antenna size34,35. The PSII ETRs were plotted as a function of light intensity, linearly fitted (forced through (0,0)) and the slopes of the fit were compared to yield functional antenna size differences between the mutants. The fitting was done using Origin (OriginLab, USA).
It is important to note that the DCMU addition increases the F0 due to a conversion of a fraction of the centers which exist in darkness in a [QA; QB.-] state to a [QA-; DCMU] state (e.g. 34). It is thus crucial to use the actual F0 value (in the absence of DCMU) as a starting point for the calculation of the areas above the curve. Here, we have done that by linearly extrapolating the initial slope of the fluorescence rise from the F0’(DCMU) level to the F0 recorded in dark-adapted plants (see 35 for details).
Electron microscopy
Leaf strips were cut from 5-week-old plants that had been dark adapted overnight. The strips were immediately fixed in a solution containing 2% (v/v) glutaraldehyde and 2% (v/v) paraformaldehyde in 0.1 M Caco buffer (pH 7.4) in the dark for 2 hours at room temperature and then at 4°C overnight. The samples were then treated and imaged according to 60 but substituting 0.1 M PBS buffer with 0.1 M Caco buffer (pH 7.4). Measurement of grana height and width were performed using ImageJ61.
Chlorophyll fluorescence and NPQ
Chlorophyll fluorescence was measured with the Dual PAM-100 apparatus (Walz, Germany). Plants were dark-adapted for one hour before measurement to ensure all PSII RCs were open. A measuring beam of 3 μmol photons m−2 s−1 was applied at a frequency of 20 Hz to obtain the minimal level of fluorescence (F0). A saturating light pulse of 12,000 μmol photons m–2 s–1 with a duration of 190 ms was applied to determine maximal fluorescence (FM). The difference between FM and F0 is defined as the variable fluorescence (Fv) and the ratio of Fv/FM was used to estimate the maximal photochemical yield of PSII.
NPQ was induced with actinic light intensities of 13-1287 μmol photons m−2 s−1, the exact values are indicated in the main text. Saturating light pulses of the same intensity and duration as above were applied to determine the maximal fluorescence in the light adapted state (FM’). To follow NPQ kinetics, a saturating pulse was applied every 20 seconds for 8 minutes and then once per minute for 10 minutes to follow NPQ recovery in darkness. NPQ is calculated according to the equation (FM–FM′)/FM′ and estimates the rate constant for heat loss from PSII. Please see Supplementary Figure 3 for example fluorescence traces with annotations. All measurements were performed on leaves still attached to the plant and repetitions were performed on different plants.
Extended Data
Extended Data Figure 1.
Extended Data Figure 2.
Extended Data Figure 3.
Extended Data Table 1.
| Sample | A | N | V | L | Z | β-C | Z+A | (Z+0.5*A)/(Z+A+V) |
|---|---|---|---|---|---|---|---|---|
| WT DARK | - | 4.45 ± 0.19 | 4.5 ± 0.22 | 16.54 ± 0.23 | - | 4.53 ± 1.83 | - | - |
| NoLHCII DARK | - | 2.43 ± 0.18 | 5.2 ± 0.31 | 12.77 ± 0.22 | - | 7.79 ± 0.50 | - | - |
| WT HL | 1.38 ± 0.41 | 4.23 ± 0.42 | 2.18 ± 0.09 | 17.69 ± 1.10 | 1.58 ± 0.32 | 6.05 ± 2.44 | 2.95 ± 0.34 | 0.44 ± 0.04 |
| NoLHCII HL | 1.18 ± 0.38 | 2.28 ± 0.36 | 3.07 ± 0.64 | 14.9 ± 0.81 | 2.1 ± 0.32 | 8.63 ± 2.6 | 3.28 ± 0.36 | 0.43 ± 0.07 |
Supplementary Material
Acknowledgements
L. Roy is acknowledged for constructing the knockdown line and S. Jansson for the gift of the amiLhcb1 and amiLhcb2 seeds. A. Rubert Albiol is acknowledged for her help in selecting the knockdown line and H. van Amerongen for helpful discussion. Electron microscopy was performed at the Vrije Universiteit Electron Microscopy Facility. R.C. received financial support from the Netherlands Organization for Scientific Research (NWO) (86510013) and the European Commission (EC) (214113). W.J.N. was supported by a European Commission Marie Curie Actions Individual Fellowship (799083). L.N. also received financial support from the New Zealand Government through the Royal Society of New Zealand-Rutherford Foundation.
Footnotes
Reporting Summary. Further information on research design is available in the Nature Research Reporting Summary linked to this article.
Data availability. All data generated or analysed during this study are included in this published article (and its Supplementary Information files).
Author contribution
R.C. conceived the project. L.N. and W.J.N performed the experiments. Data were analyzed and interpreted by L.N., W.J.N. and R.C. The manuscript was written by L.N. with contributions by W.J.N. and R.C.
Competing interests
The authors declare no competing interests.
References
- 1.Su X, et al. Structure and assembly mechanism of plant C2S2M2-type PSII-LHCII supercomplex. Science. 2017;357:815–820. doi: 10.1126/science.aan0327. [DOI] [PubMed] [Google Scholar]
- 2.Barber J. Photosysten II: the water slitting enzyme of photosynthesis and the origin of oxygen in our atmosphere. Q Rev Biophys. 2016;49:e14. doi: 10.1017/S0033583516000093. [DOI] [PubMed] [Google Scholar]
- 3.Nicol L, Croce R. Light harvesting in higher plants and green algae. In: Croce R, van Grondelle R, van Amerongen H, van Stokkum I, editors. Light Harvesting in Photosynthesis. CRC Press; 2018. pp. 73–90. [DOI] [Google Scholar]
- 4.Caffarri S, Croce R, Cattivelli L, Bassi R. A look within LHCII: Differential analysis of the Lhcb1-3 complexes building the major trimeric antenna complex of higher-plant photosynthesis. Biochemistry. 2004;43:9467–9476. doi: 10.1021/bi036265i. [DOI] [PubMed] [Google Scholar]
- 5.Kouřil R, Wientjes E, Bultema JB, Croce R, Boekema EJ. High-light vs. low-light: Effect of light acclimation on Photosystem II composition and organization in Arabidopsis thaliana. Biochim Biophys Acta - Bioenerg. 2013;1827:411–419. doi: 10.1016/j.bbabio.2012.12.003. [DOI] [PubMed] [Google Scholar]
- 6.Croce R, van Amerongen H. Natural strategies for photosynthetic light harvesting. Nat Chem Biol. 2014;10:492–501. doi: 10.1038/nchembio.1555. [DOI] [PubMed] [Google Scholar]
- 7.Powles SB. Photoinhibition of photosynthesis induced by visible Light. Annu Rev Plant Physiol. 1984;35:15–44. [Google Scholar]
- 8.Ruban AV, Johnson MP, Duffy CDP. The photoprotective molecular switch in the Photosystem II antenna. Biochim Biophys Acta - Bioenerg. 2012;1817:167–181. doi: 10.1016/j.bbabio.2011.04.007. [DOI] [PubMed] [Google Scholar]
- 9.Briantais J-M, Vernotte C, Picaud M, Krause GH. A quantitative study of the slow decline of chlorophyll a fluorescence in isolated chloroplasts. Biochim Biophys Acta - Bioenerg. 1979;548:128–138. doi: 10.1016/0005-2728(79)90193-2. [DOI] [PubMed] [Google Scholar]
- 10.Li X-P, Muller-Moule P, Gilmore AM, Niyogi KK. PsbS-dependent enhancement of feedback de-excitation protects Photosystem II from photoinhibition. Proc Natl Acad Sci U S A. 2002;99:15222–7. doi: 10.1073/pnas.232447699. [DOI] [PMC free article] [PubMed] [Google Scholar]
- 11.Li X-P, et al. Regulation of photosynthetic light harvesting involves intrathylakoid lumen pH sensing by the PsbS protein. J Biol Chem. 2004;279:22866–74. doi: 10.1074/jbc.M402461200. [DOI] [PubMed] [Google Scholar]
- 12.Yamamoto HY, Nakayama TOM, Chichester CO. Studies on the light and dark interconversions of leaf xanthophylls. Arch Biochem Biophys. 1962;97:168–173. doi: 10.1016/0003-9861(62)90060-7. [DOI] [PubMed] [Google Scholar]
- 13.Demmig-Adams B. Carotenoids and photoprotection in plants: A role for the xanthophyll zeaxanthin. Biochim Biophys Acta - Bioenerg. 1990;1020:1–24. [Google Scholar]
- 14.Dominici P, et al. Biochemical properties of the PsbS subunit of Photosystem II either purified from chloroplast or recombinant. J Biol Chem. 2002;277:22750–22758. doi: 10.1074/jbc.M200604200. [DOI] [PubMed] [Google Scholar]
- 15.Fan M, et al. Crystal structures of the PsbS protein essential for photoprotection in plants. Nat Struct Mol Biol. 2015;22:729–735. doi: 10.1038/nsmb.3068. [DOI] [PubMed] [Google Scholar]
- 16.Holt NE, et al. Carotenoid cation formation and the regulation of photosynthetic light harvesting. Science. 2005;307:433–436. doi: 10.1126/science.1105833. [DOI] [PubMed] [Google Scholar]
- 17.Horton P, et al. Control of the light-harvesting function of chloroplast membranes by aggregation of the LHCII chlorophyll-protein complex. FEBS Lett. 1991;292:1–4. doi: 10.1016/0014-5793(91)80819-o. [DOI] [PubMed] [Google Scholar]
- 18.Horton P, Ruban AV, Walters RG. Regulation of light harvesting in green plants. Annu Rev Plant Physiol. Plant Mol Biol. 1996;47:655–684. doi: 10.1146/annurev.arplant.47.1.655. [DOI] [PubMed] [Google Scholar]
- 19.Horton P, Ruban AV, Wentworth M. Allosteric regulation of the light-harvesting system of Photosystem II. Philos Trans R Soc Lond B Biol Sci. 2000;355:1361–70. doi: 10.1098/rstb.2000.0698. [DOI] [PMC free article] [PubMed] [Google Scholar]
- 20.Ruban AV, Phillip D, Young AJ, Horton P. Carotenoid-dependent oligomerization of the major chlorophyll a/b light harvesting complex of Photosystem II of plants. Biochemistry. 1997;36:7855–7859. doi: 10.1021/bi9630725. [DOI] [PubMed] [Google Scholar]
- 21.Johnson MP, et al. Photoprotective energy dissipation involves the reorganization of Photosystem II light-harvesting complexes in the grana membranes of spinach chloroplasts. Plant Cell. 2011;23:1468–79. doi: 10.1105/tpc.110.081646. [DOI] [PMC free article] [PubMed] [Google Scholar]
- 22.Goral TK, et al. Light-harvesting antenna composition controls the macrostructure and dynamics of thylakoid membranes in Arabidopsis. Plant J. 2012;69:289–301. doi: 10.1111/j.1365-313X.2011.04790.x. [DOI] [PubMed] [Google Scholar]
- 23.Walters RG, Ruban AV, Horton P. Higher plant light-harvesting complexes LHCIIa and LHCIIc are bound by dicyclohexylcarbodiimide during inhibition of energy dissipation. Eur J Biochem. 1994;226:1063–1069. doi: 10.1111/j.1432-1033.1994.01063.x. [DOI] [PubMed] [Google Scholar]
- 24.Morosinotto T, Baronio R, Bassi R. Dynamics of chromophore binding to Lhc proteins in vivo and in vitro during operation of the xanthophyll cycle. J Biol Chem. 2002;277:36913–20. doi: 10.1074/jbc.M205339200. [DOI] [PubMed] [Google Scholar]
- 25.Pesaresi P, Sandonà D, Giuffra E, Bassi R. A single point mutation (E166Q) prevents dicyclohexylcarbodiimide binding to the photosystem II subunit CP29. FEBS Lett. 1997;402:151–6. doi: 10.1016/s0014-5793(96)01518-9. [DOI] [PubMed] [Google Scholar]
- 26.Holzwarth AR, Miloslavina Y, Nilkens M, Jahns P. Identification of two quenching sites active in the regulation of photosynthetic light-harvesting studied by time-resolved fluorescence. Chem Phys Lett. 2009;483:262–267. [Google Scholar]
- 27.de Bianchi S, Dall’Osto L, Tognon G, Morosinotto T, Bassi R. Minor antenna proteins CP24 and CP26 affect the interactions between Photosystem II subunits and the electron transport rate in grana membranes of Arabidopsis. Plant Cell. 2008;20:1012–28. doi: 10.1105/tpc.107.055749. [DOI] [PMC free article] [PubMed] [Google Scholar]
- 28.de Bianchi S, et al. Arabidopsis mutants deleted in the light-harvesting protein Lhcb4 have a disrupted Photosystem II macrostructure and are defective in photoprotection. Plant Cell. 2011;23:2659–79. doi: 10.1105/tpc.111.087320. [DOI] [PMC free article] [PubMed] [Google Scholar]
- 29.Andersson J, et al. Absence of the Lhcb1 and Lhcb2 proteins of the light-harvesting complex of Photosystem II - effects on photosynthesis, grana stacking and fitness. Plant J. 2003;35:350–61. doi: 10.1046/j.1365-313x.2003.01811.x. [DOI] [PubMed] [Google Scholar]
- 30.Dall’Osto L, Ünlü C, Cazzaniga S, van Amerongen H. Disturbed excitation energy transfer in Arabidopsis thaliana mutants lacking minor antenna complexes of Photosystem II. Biochim Biophys Acta - Bioenerg. 2014;1837:1981–88. doi: 10.1016/j.bbabio.2014.09.011. [DOI] [PubMed] [Google Scholar]
- 31.Ruban AV, et al. Plants lacking the main light-harvesting complex retain Photosystem II macro-organization. Nature. 2003;421:648–652. doi: 10.1038/nature01344. [DOI] [PubMed] [Google Scholar]
- 32.Pietrzykowska M, et al. The light-harvesting chlorophyll a/b binding proteins Lhcb1 and Lhcb2 play complementary roles during state transitions in Arabidopsis. Plant Cell. 2014;26:3646–3660. doi: 10.1105/tpc.114.127373. [DOI] [PMC free article] [PubMed] [Google Scholar]
- 33.Jackowski G, Kacprzak K, Jansson S. Identification of Lhcb1/Lhcb2/Lhcb3 heterotrimers of the main light-harvesting chlorophyll a/b–protein complex of Photosystem II (LHC II) Biochim Biophys Acta - Bioenerg. 2001;1504:340–345. doi: 10.1016/s0005-2728(00)00262-0. [DOI] [PubMed] [Google Scholar]
- 34.Lazár D, Pospíšil P. Mathematical simulation of chlorophyll a fluorescence rise measured with 3-(3',4'-dichlorophenyl)-1,1-dimethylurea-treated barley leaves at room and high temperatures. Eur Biophys J. 1999;28:468–477. doi: 10.1007/s002490050229. [DOI] [PubMed] [Google Scholar]
- 35.Tian L, et al. Photoprotection in Chlamydomonas: pH dependence, kinetics and light-harvesting regulation. PNAS. 2019 doi: 10.1073/pnas.1817796116. In press. [DOI] [PMC free article] [PubMed] [Google Scholar]
- 36.Bailleul B, Cardol P, Breyton C, Finazzi G. Electrochromism: a useful probe to study algal photosynthesis. Photosynth Res. 2010;106:179–189. doi: 10.1007/s11120-010-9579-z. [DOI] [PubMed] [Google Scholar]
- 37.Dekker JP, Boekema EJ. Supramolecular organization of thylakoid membrane proteins in green plants. Biochim Biophys Acta - Bioenerg. 2005;1706:12–39. doi: 10.1016/j.bbabio.2004.09.009. [DOI] [PubMed] [Google Scholar]
- 38.van der Weij-de Wit CD, Ihalainen JA, van Grondelle R, Dekker JP. Excitation energy transfer in native and unstacked thylakoid membranes studied by low temperature and ultrafast fluorescence spectroscopy. Photosynth Res. 2007;93:173–182. doi: 10.1007/s11120-007-9157-1. [DOI] [PubMed] [Google Scholar]
- 39.Bassi R, Hinz U, Barbato R. The role of the light harvesting complex and Photosystem II in thylakoid stacking in the chlorina-f2 barley mutant. Carlsberg Res Commun. 1985;50:347–367. [Google Scholar]
- 40.Kim E-H, et al. The multiple roles of light-harvesting chlorophyll a/b-protein complexes define structure and optimize function of Arabidopsis chloroplasts: A study using two chlorophyll b-less mutants. Biochim Biophys Acta - Bioenerg. 2009;1787:973–984. doi: 10.1016/j.bbabio.2009.04.009. [DOI] [PubMed] [Google Scholar]
- 41.Niyogi KK, Grossman AR, Björkman O. Arabidopsis mutants define a central role for the xanthophyll cycle in the regulation of photosynthetic energy conversion. Plant Cell. 1998;10:1121–34. doi: 10.1105/tpc.10.7.1121. [DOI] [PMC free article] [PubMed] [Google Scholar]
- 42.Espineda CE, Linford AS, Devine D, Brusslan JA. The AtCAO gene, encoding chlorophyll a oxygenase, is required for chlorophyll b synthesis in Arabidopsis thaliana. Plant Biol. 1999;96:10507–10511. doi: 10.1073/pnas.96.18.10507. [DOI] [PMC free article] [PubMed] [Google Scholar]
- 43.Havaux M, Dall’osto L, Bassi R. Zeaxanthin has enhanced antioxidant capacity with respect to all other xanthophylls in Arabidopsis leaves and functions independent of binding to PSII antennae. Plant Physiol. 2007;145:1506–20. doi: 10.1104/pp.107.108480. [DOI] [PMC free article] [PubMed] [Google Scholar]
- 44.Siefermann D, Yamamoto HY. NADPH and oxygen-dependent epoxidation of zeaxanthin in isolated chloroplasts. Biochem Biophys Res Commun. 1975;62:456–461. doi: 10.1016/s0006-291x(75)80160-4. [DOI] [PubMed] [Google Scholar]
- 45.Yamamoto HY, Kamite L. The effects of dithiothreitol on violaxanthin de-epoxidation and absorbance changes in the 500-nm region. Biochim Biophys Acta - Bioenerg. 1972;267:538–543. doi: 10.1016/0005-2728(72)90182-x. [DOI] [PubMed] [Google Scholar]
- 46.Johnson MP, Pérez-Bueno ML, Zia A, Horton P, Ruban AV. The zeaxanthin-independent and zeaxanthin-dependent qE components of nonphotochemical quenching involve common conformational changes within the Photosystem II antenna in Arabidopsis. Plant Physiol. 2009;149:1061–75. doi: 10.1104/pp.108.129957. [DOI] [PMC free article] [PubMed] [Google Scholar]
- 47.Wraight CA, Crofts AR. Energy-dependent quenching of chlorophyll a fluorescence in isolated chloroplasts. Eur J Biochem. 1970;17:319–327. doi: 10.1111/j.1432-1033.1970.tb01169.x. [DOI] [PubMed] [Google Scholar]
- 48.Murata N, Sugahara K. Control of excitation transfer in photosynthesis. III. Light-induced decrease of chlorophyll a fluorescence related to photophosphorylation system in spinach chloroplasts. Biochim Biophys Acta - Bioenerg. 1969;189:182–192. doi: 10.1016/0005-2728(69)90046-2. [DOI] [PubMed] [Google Scholar]
- 49.Ruban AV. Nonphotochemical chlorophyll fluorescence quenching: Mechanism and effectiveness in protecting plants from photodamage. Plant Physiol. 2016;170:1903–16. doi: 10.1104/pp.15.01935. [DOI] [PMC free article] [PubMed] [Google Scholar]
- 50.Avenson TJ, et al. Zeaxanthin radical cation formation in minor light-harvesting complexes of higher plant antenna. J Biol Chem. 2008;283:3550–8. doi: 10.1074/jbc.M705645200. [DOI] [PubMed] [Google Scholar]
- 51.Dall’Osto L, et al. Two mechanisms for dissipation of excess light in monomeric and trimeric light-harvesting complexes. Nat Plants. 2017;3:17033. doi: 10.1038/nplants.2017.33. [DOI] [PubMed] [Google Scholar]
- 52.Farooq S, et al. Dynamic feedback of the Photosystem II reaction centre on photoprotection in plants. Nat Plants. 2018;4:225–231. doi: 10.1038/s41477-018-0127-8. [DOI] [PubMed] [Google Scholar]
- 53.Li X-P, et al. A pigment-binding protein essential for regulation of photosynthetic light harvesting. Nature. 2000;403:391–395. doi: 10.1038/35000131. [DOI] [PubMed] [Google Scholar]
- 54.Correa-Galvis V, Poschmann G, Melzer M, Stühler K, Jahns P. PsbS interactions involved in the activation of energy dissipation in Arabidopsis. Nat Plants. 2016;2:15225. doi: 10.1038/nplants.2015.225. [DOI] [PubMed] [Google Scholar]
- 55.Townsend AJ, et al. The causes of altered chlorophyll fluorescence quenching induction in the Arabidopsis mutant lacking all minor antenna complexes. Biochim Biophys Acta - Bioenerg. 2018;1859:666–675. doi: 10.1016/j.bbabio.2018.03.005. [DOI] [PubMed] [Google Scholar]
- 56.Xu P, Tian L, Kloz M, Croce R. Molecular insights into zeaxanthin-dependent quenching in higher plants. Sci Rep. 2015;5:13679. doi: 10.1038/srep13679. [DOI] [PMC free article] [PubMed] [Google Scholar]
- 57.Schägger H. Tricine–SDS-PAGE. Nat Protoc. 2006;1:16–22. doi: 10.1038/nprot.2006.4. [DOI] [PubMed] [Google Scholar]
- 58.Järvi S, Suorsa M, Paakkarinen V, Aro E-M. Optimized native gel systems for separation of thylakoid protein complexes: novel super- and mega-complexes. Biochem J. 2011;439:207–214. doi: 10.1042/BJ20102155. [DOI] [PubMed] [Google Scholar]
- 59.Croce R, Canino G, Ros F, Bassi R. Chromophore organization in the higher-plant Photosystem II antenna protein CP26. Biochemistry. 2002;41:7334–43. doi: 10.1021/bi0257437. [DOI] [PubMed] [Google Scholar]
- 60.Fristedt R, et al. RBF1, a plant homolog of the bacterial ribosome-binding factor RbfA, acts in processing of the chloroplast 16S ribosomal RNA. Plant Physiol. 2014;164:201–15. doi: 10.1104/pp.113.228338. [DOI] [PMC free article] [PubMed] [Google Scholar]
- 61.Rueden CT, et al. ImageJ2: ImageJ for the next generation of scientific image data. BMC Bioinformatics. 2017;18:529. doi: 10.1186/s12859-017-1934-z. [DOI] [PMC free article] [PubMed] [Google Scholar]
- 62.Wientjes E, Croce R. The light-harvesting complexes of higher-plant Photosystem I: Lhca1/4 and Lhca2/3 form two red-emitting heterodimers. Biochem J. 2011;433:477–85. doi: 10.1042/BJ20101538. [DOI] [PubMed] [Google Scholar]
Associated Data
This section collects any data citations, data availability statements, or supplementary materials included in this article.


