Abstract
Severe ozone (O3) episodes occur frequently in Shanghai during late-summers. We define geopotential height averaged over the key area region (122.5°E-135°E, 27.5°N -35°N) at 500 hPa as a WPSH_SHO3 index which has high positive correlation with surface O3 concentration in Shanghai. In addition, the index has a significant long-term increasing trend during the recent 60 years. Analysis shows the meteorological conditions under the strong WPSH_SHO3 climate background (compared to the weak background) have several important anomalies: (1) A strong WPSH center occurs over the key area region. (2) The cloud cover is less, resulting in high solar radiation and low humidity, enhancing the photochemical reactions of O3. (3) The near-surface southwesterly winds are more frequent, enhancing the transport of upwind pollutants and O3 precursors from polluted regions to Shanghai and producing higher O3 chemical productions. This study suggests that the global climate change could lead to a stronger WPSH in the key region, enhancing ozone pollution in Shanghai. A global chemical/transport model (MOZART-4) is applied to show that the O3 concentrations can be 30 ppbv higher under a strong WPSH_SHO3 condition than a weak condition, indicating the important effect of the global climate change on local air pollution in Shanghai.
Subject terms: Atmospheric chemistry, Environmental impact
Introduction
With rapid industrialization and urbanization in recent decades, China has been experienced persistent and serious air pollution problem, causing important impacts on human health and ecological environment (like crop damages)1–5. Shanghai, as a rapidly developing megacity in China with a population of over 20 million, is suffering severe ozone pollutions during summer and haze episodes during winter in recent years6–8. The monitoring data in Shanghai demonstrates that the ozone concentrations had a significant long-term increasing trend during recent years9,10, and the monthly mean O3 concentrations increased about 67% from 2006 to 2016. In 2017, ozone pollution duration (148 days yr−1) exceeded PM2.5 pollution duration (60 days yr−1), becoming a primary pollutant for affecting air quality in Shanghai.
In the troposphere, ozone is produced by a complicated chemical process, which initializes by the photochemical reactions of ozone precursors, such as nitrogen oxides (NOX) and volatile organic carbons (VOCS)11–13. As the increase in industrial activity and number of automobiles, the precursors of ozone (O3) and the global budget of oxidization are also significantly increased14,15. Although photochemical process is important to determine ozone concentrations, previous studies suggest that local meteorological parameters such as temperature, solar radiation, relative humidity, horizontal wind speed and direction, and cloud cover also play important roles in controlling ozone concentrations. For example, elevated ozone concentration is usually accompanied with strong solar radiation and small winds, which is favorable for the photochemical production of ozone and the accumulation of ozone and its precursor16. Tie et al. (2009) suggest that radiation, wind speed and wind direction are the most important meteorological factors for causing the variability of surface ozone concentrations in Shanghai. These factors directly affect the photochemical reaction, regional transportation and diffusion process of ozone. Furthermore, synoptic-scale weather pattern, with spatial scale less than 1000 km, is also an important factor in controlling ozone variability17–21. For example, anticyclones (i.e., high pressure systems) produce favorable conditions for ozone production. At the center of anticyclones, it is normally sunny weather, with low wind velocity, causing high O3 production and accumulation22,23. In coastal cities, sea-land breeze can be an important meteorological factor to affect ozone distributions. Tie et al. (2009) finds that the impact of sea breeze on O3 concentration is noticeable in the city of Shanghai under calm weather condition.
It is well known that the West Pacific Subtropical High (WPSH) is evident as a semi-permanent, sub-tropical anticyclone high pressure over the western North Pacific, affecting the summertime weather and climate in China24–26. Despite of the effect on weather conditions (such as summertime precipitation and temperature), WPSH has also important effects on vegetation coverage and other research field27,28. Currently, the impact of the position and intensity of the WPSH on summertime ozone pollution over eastern China have been paid more attention. Most of the previous studies examine the relationship between the WPSH and ozone on a daily scale. For example, He et al.29 focus on an short-term ozone pollution event in Shanghai and finds that ozone mixing ratios in summertime at Chongming (a surface site in the northeast of Shanghai) are often higher during the days when the center of the WPSH locates to the southeast of that site, with a weak intensity. Some results30 show the subsidence air caused by the WPSH plays a crucial role in the formation of high-level O3. Zhao et al.31 studies the impact of WPSH on surface ozone daily variability over eastern China and demonstrates that a stronger WPSH is associated with lower ozone in South China but with higher ozone in North China, suggesting that this south-north difference can be explained by changing moisture transport associated with the WPSH variability.
Generally, the WPSH is closely associated with the timing and spatial distribution of summer ozone concentrations in East Asia and may intensify in a warming climate background32. However, there is s lack of study to analyze the effect of global changes on WPSH and the consequence on the O3 concentrations in the Shanghai region. The focus of this study is to investigate a strong inter-annual variability of ozone pollution and the effect of global climate change on summertime ozone pollution in Shanghai. The paper is organized as follows: in Section 2, we describe the information of the methodology. In Section 3, some results and analysis are analyzed. Section 4 shows a brief conclusion of the results.
Discussion
Gao et al. (2017) and Lin et al. (2017) have demonstrated that the ozone concentrations in Shanghai steadily increase, with a strong seasonal variation. Because the effect of WPSH on O3 concentrations often occurs in summer time, the monthly variation of ozone during 2013 to 2017 in the Shanghai region is analyzed and is presented in Fig. 1. Figure 1 shows that the 8h-averaged ozone (MDA8 O3) concentrations have highest occurrences in late-summer (July and August) compared with those in other months. The new Chinese national ambient air quality standards (CNAAQS2012, GB 3095–2012) has defined the severe, moderate, and slight ozone pollution33. The total pollution days on July and August from 2013 to 2017 are 82 and 56 days, respectively. According to the study by Gao et al. (2017), the ozone concentrations are low in early summer (June), because of the occurrence of frequent precipitation in June which is named Meiyu-Baiu-Changma rain belt in China. Previous studies34 have demonstrate that the seasonal northward shifts of the WPSH are closely associated with the onset and withdrawal of the EASM, during July and August, the ridge of WPSH locate around Yangtze-Huaihe River region, and the weather conditions here are strongly controlled by the main body of WPSH system. As a result, it is important to understand the impact of WPSH on surface ozone in Shanghai during late-summer.
Figure 1.
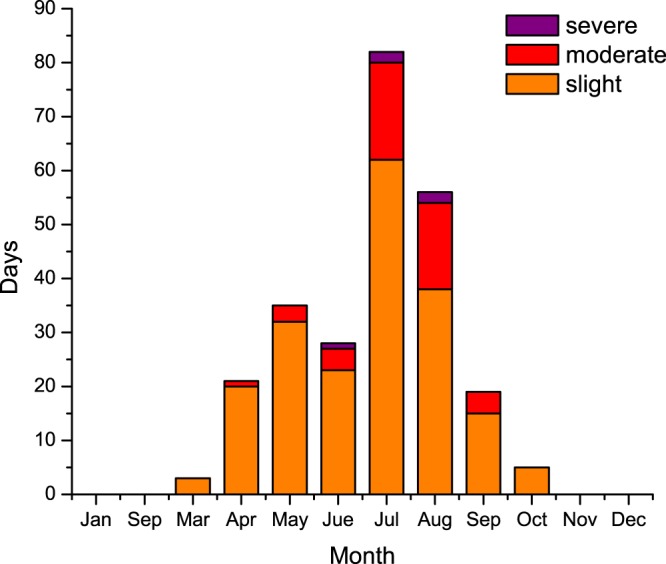
Monthly variation of ozone pollution days in Shanghai during 2013 to 2017 (orange, red and purple columns represent slight, moderate and severe pollutions respectively). The O3 concentrations were measured by the Chinese National Environmental Monitoring Center (CNEMC) in the Shanghai area. The maps were generated by origin software version 8.0.
As we all know, WPSH is a multi-dimensional climate system, its temporal and spatial circulation characteristics are more complex, so it is often simplified by one dimension monitoring index to analyze its effect on ozone. Five operational indices of WPSH based on the 5880 geopotential height (gpm) at 500 hPa, including the area, intensity, ridge lines, northern extension, and western boundaries are announced monthly by the National Climate Center (NCC) in China to describe the WPSH’s evolution35. But the correlations between ozone concentrations in Shanghai and indices on a monthly scale is very poor, Consequently, it is necessary to develop a new objective index, which is not only with clear physical meanings to objectively describe the location and intensity of the WPSH, but also has significant associations with surface ozone in Shanghai. Figure 2 shows the distribution of correlation coefficients between monthly mean MAD8 O3 in Shanghai and the 500 hPa geopotential height over Eastern Asia during late-summer from 2013 to 2017. To obtain correlation analysis data as more as possible, monthly mean data are used rather than late-summer mean data. Correlations between ozone concentrations and 500 hPa geopotential height are positive in most parts of Eastern Asia. The significant positive correlation coefficients with 500 hPa geopotential height (exceeding the 95% confidence level based on student-t test) are located over eastern ocean of China. The significant correlation coefficients related to the geopotential height averaged over the key area region (122.5°E-135°E, 27.5°N-35°N) at 500 hPa shows a maximum positive correlation coefficient (0.78). Thus, we define geopotential height averaged over the key area region at 500 hPa as the new definition index of WPSH’s effect on ozone (called WPSH_SHO3). It not only represents the activity center and intensity of the WPSH over the key area region, but also it has high positive correlation with the surface ozone concentration in Shanghai.
Figure 2.
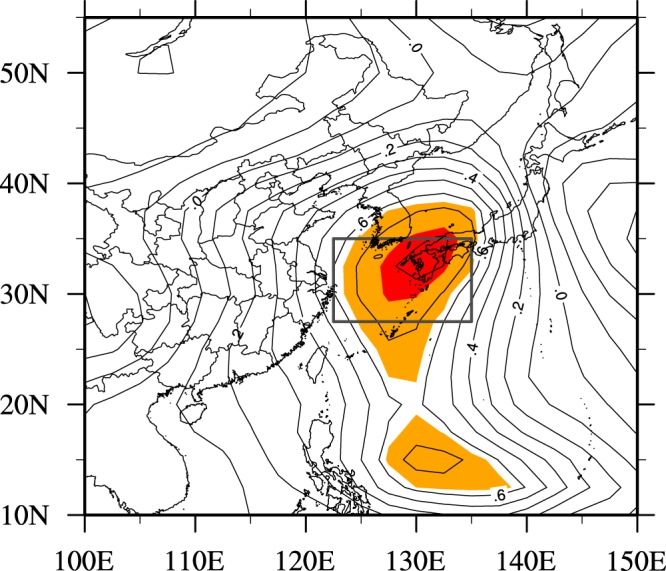
The distribution of correlation coefficients between monthly mean MAD8 O3 in Shanghai and the 500 hPa geo-potential height over Eastern Asia during late-summer from 2013 to 2017 (Black box represents the key region of WPSH. Values of red and orange shades have passed positive 95% and 99% confidence levels based on student-t test, respectively). NCEP Reanalysis data provided by the NOAA/OAR/ESRL PSD, Boulder, Colorado, USA, from their Web site at https://www.esrl.noaa.gov/psd/. The map was generated by NCL software [The NCAR Command Language (Version 6.3.0) [Software]. (2015). Boulder, Colorado: UCAR/NCAR/CISL/TDD. 10.5065/D6WD3XH5].
Figure 3 displays the inter-annual variability of monthly mean O3 (MAD8) in Shanghai and the corresponding WPSH_SHO3 index from 2013 to 2017. The characteristics of the two parameters were highly correlated (except during 2015), with a correlation coefficient of 0.78 (exceeding the 99% confidence level). The high correlation between WPSH_SHO3 index and O3 concentrations indicated that the intensity of the WPSH_SHO3 can be used as an indictor to predict a general tendency of late-summer O3 concentrations in Shanghai.
Figure 3.
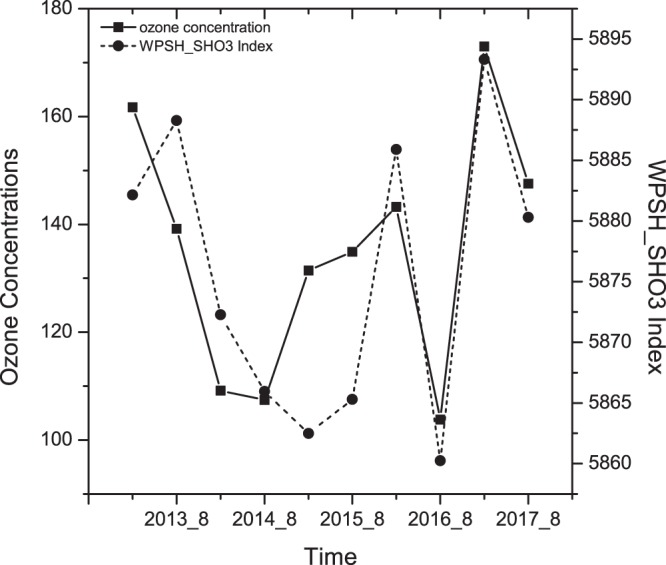
The inter-annual variability of monthly mean MAD8 O3 and WPSH_SHO3 index in Shanghai during late-summer from 2013 to 2017. The O3 concentrations were measured by the Chinese National Environmental Monitoring Center (CNEMC) in the Shanghai area. The map was generated by origin software version 8.0.
West Pacific Subtropical High (WPSH) is mainly affected by large-scale circulations, previous studies36,37 have shown different results of how the ongoing global warming would change the WPSH. To understand the impact of Climate Change on the WPSH and its impact on ozone pollution in Shanghai, Fig. 4 shows the long-term trend of late-summer mean WPSH_SHO3 index from 1958 to 2017. As shown in Fig. 4, the index of WPSH_SHO3 significantly increased during the recent years (1958–2017), with an increasing rate of about 5 gpm decade−1. For example, the WPSH_SHO3 was about 5885 gpm in 2017 and 5855 gpm in 1958, respectively. This rapid increase suggested that the global climate change had strong impacts on the WPSH_SHO3, which might have important effects on air pollutants (such O3) in Shanghai (as shown in Fig. 3).
Figure 4.
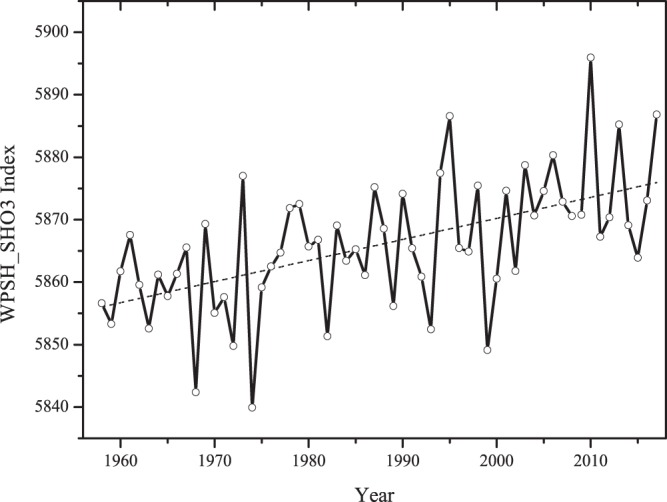
The long-term trend of midsummer mean WPSH_SHO3 index from 1958 to 2017. NCEP Reanalysis data provided by the NOAA/OAR/ESRL PSD, Boulder, Colorado, USA, from their Web site at https://www.esrl.noaa.gov/psd/. The maps were generated by origin software version 8.0.
To systematically study the impact of WPSH_SHO3 on O3 concentrations in Shanghai during late-summers, two different late-summer cases were selected and compared. The first case (Jul. 2017) was a typical strong WPSH case, with the maximum anomalies geopotential height, while the second case (Aug. 2016) was a typical weak WPSH, with the minimum anomalies geopotential height. It is interesting to note that the difference of geopotential height between the two cases is about 30 gpm, which is equivalent to the value between the values of WPSH_SHO3 in 1957 and 2017 (see Fig. 4). As a result, comparing the two extreme cases can provide useful insights to understand the impact of global climate change on WPSH_SHO3 and the corresponding effects on O3 concentrations in Shanghai.
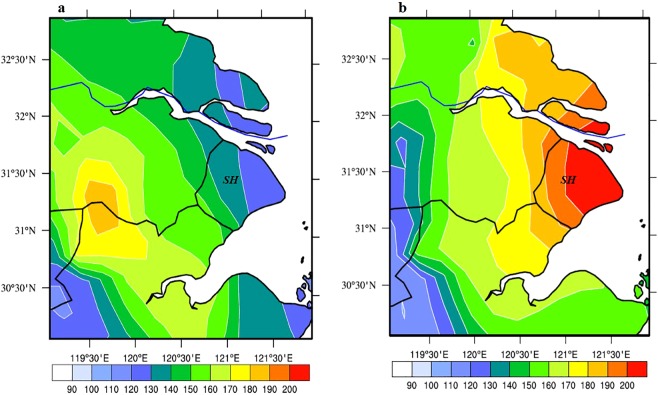
Figure 5 shows the monthly mean O3 (MAD1) concentrations during the strong (Jul. 2017) and the weak (Aug. 2016) WPSH_SHO3 cases in Shanghai and its surrounding regions. The results show that there was significantly difference for the O3 concentrations in these 2 cases. During the weak case, the maximum O3 concentration was located in the inland and the west of Shanghai (SH), with a highest value of >180 μg m−3. As a result, the O3 concentrations in SH were low, ranging from 120–140 μg·m−3. In the contrast, during the strong WPSH case, the maximum O3 concentration was higher than the weak WPSH case, and the highest O3 located in the city of Shanghai (SH), with a highest value of >200 μg m−3. As a result, the O3 concentrations in SH were high, ranging from 180–200 μg m−3, resulting in a large anomaly of O3 concentrations (60 μg m−3) between the strong and the weak WPSH cases in Shanghai.
Figure 5.
Monthly mean O3 (MAD1) concentration in Shanghai and its surrounding areas in the weak WPSH case (Aug. 2016) (a), and the strong WPSH case (Jul. 2017) (b). (The ozone data which is measured by the Urban Air Quality Center in China has been interpolated to a rectilinear grid using bilinear interpolation). The O3 concentrations were measured by the Chinese National Environmental Monitoring Center (CNEMC) at 367 monitoring stations and were interpolated to grid data by using iterative improvement objective analysis. The maps were generated using NCL software [The NCAR Command Language (Version 6.3.0) [Software]. (2015). Boulder, Colorado: UCAR/NCAR/CISL/TDD. 10.5065/D6WD3XH5].
To understand the impact of WPSH_SHO3 on the anomalies of ozone concentrations between strong and weak WPSH cases, detailed meteorological conditions were analyzed.
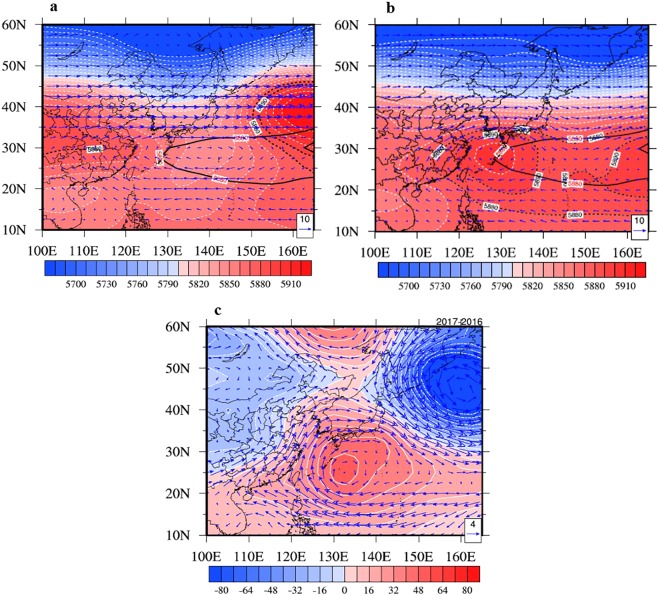
Figure 6 shows the large-scale atmospheric circulations over 500 hPa between the two cases. It shows the mid-level (500 hPa) circulations of weak case (Fig. 6a) and strong case (Fig. 6b) and its anomalies (the monthly mean values in 2017 minus the monthly mean values in 2016, shown in Fig. 6c). Compared to climatological WPSH_SHO3 (solid lines), the WPSH_SHO3 had characteristics with bigger area and stronger intensity under strong WPSH_SHO3 climate background (Fig. 6b). Moreover, there was significant sub-center of WPSH_SHO3 over the key area regions (Fig. 3). In contrast, the weak WPSH_SHO3 had no high center over the West Pacific Ocean (Fig. 6a). As a result, there were significant positive anomalies of geopotential height over 500 hPa in the West Pacific Ocean region, which was approaching the key area region mentioned in Fig. 2. For example, the geopotential height over 500 hPa in the key area region of strong case is about 30–50 gpm higher than weak case.
Figure 6.
The actual mid-level (500 hPa) circulations in Aug. 2016 (a) and Jul. 2017 (b) and its anomalies (c) (dash lines represent actual WPSH_SHO3, solid line represents climatological (1988–2017 mean) WPSH_SHO3, the arrows represent the wind vector and the actual geopotential height are shaded). NCEP Reanalysis data provided by the NOAA/OAR/ESRL PSD, Boulder, Colorado, USA, from their Web site at https://www.esrl.noaa.gov/psd/. The maps were generated by NCL software [The NCAR Command Language (Version 6.3.0) [Software]. (2015). Boulder, Colorado: UCAR/NCAR/CISL/TDD. 10.5065/D6WD3XH5].
Tie et al. (2009) find that radiation and wind (speed and direction) are the most important meteorological factors for affecting surface ozone pollution in Shanghai, which directly affect the photochemical reaction, diffusion and transport of surface ozone. In this study, the anomalies of the large-scale circulations over 925 hPa, relative humidity, solar radiation, and surface daily-max temperature between the weak and strong cases are investigated.
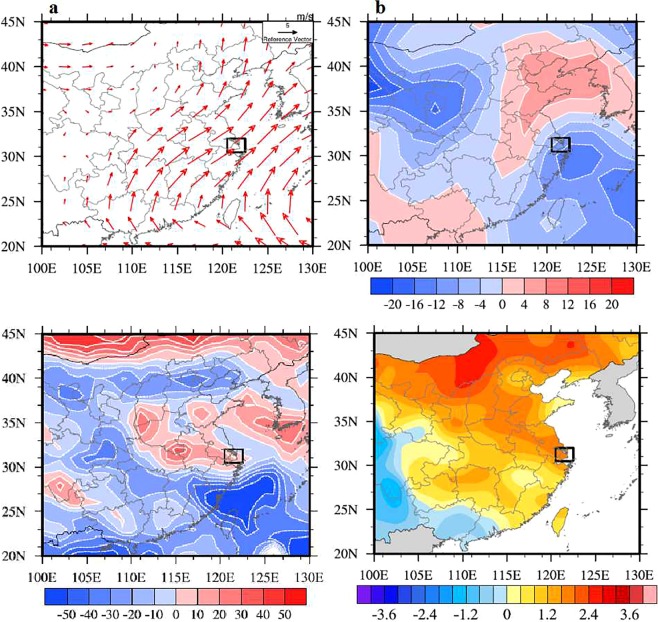
As shown in Fig. 7a, in the strong case (July 2017), there was is a strong anomalous southwesterly winds in Shanghai, which was enhanced by 4–5 m·s−1 over 925 hPa. The surface temperature was higher 3 °C than the weak case (Fig. 7d). The relative humidity was weaker by 20% than the weak case (Fig. 7b), and the radiation was stronger by 20 W•m−2 than the weak case in Shanghai (Fig. 7d). During the southwesterly winds condition, the upwind region is a large-scale forest. As a result, the enhanced southeasterly winds transported upwind biogenic emissions to Shanghai, causing and the increasing the ozone pollution in Shanghai38. However, it’s essential to give some supplementary explanation that although the anomaly of specific humidity was small between the strong case and the weak case, the local solar radiation and temperature were enhanced during the strong case (Fig. 7c,d). As a result, the higher solar radiation and temperature reduced relative humidity (RH). Furthermore, the meteorological conditions, with high temperature, low humidity, and high solar radiation were favorable for producing high-level O3 episodes39. And the possible effects of relative humidity (RH) on the ozone formation can be well explained by Yu (2018), as the paper shows, more air humidity could inhibits O3 formation by lowering air temperature and some complicated chemistry processes, like decreasing the chain length of peroxy radical chemical amplifiers (HO2, RO2, and RC(O)O2), and decreasing the chain length of NO2 by enhancing particle water, and destroys the existing O3 photo-chemically by water vapor through catalytic O3 destruction cycle40. As a result, during the strong WPSH_SHO3 case, the photochemical production of O3 was more active than the weak case.
Figure 7.
Anomalies of monthly mean low level circulation (a), low level relative humidity (units: %) (b), solar radiation (units: W·m-2) (c), and surface daily-max temperature (units: °C) (d) between Jul. 2017 and Aug. 2016 (high minus low). Black box covers the area of Shanghai. NCEP Reanalysis data provided by the NOAA/OAR/ESRL PSD, Boulder, Colorado, USA, from their Web site at https://www.esrl.noaa.gov/psd/. The maps were generated by NCL software [The NCAR Command Language (Version 6.3.0) [Software]. (2015). Boulder, Colorado: UCAR/NCAR/CISL/TDD. 10.5065/D6WD3XH5].
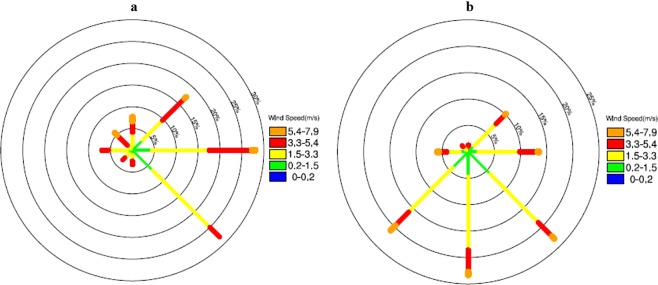
Same characteristics are found in local weather conditions in the Baoshan station in Shanghai. Table 1 and Fig. 8 show the local weather conditions in the city of Shanghai. The average meteorological conditions were calculated for the both strong and weak cases in the Baoshan observation station. As shown in Table 1, the relative humidity was lower in the strong case (65% compared with the 71% in the weak case). The hourly maximum temperature was higher in strong case (30 °C) than the weak case (32 °C). The measured photolysis rate of NO2 (J[NO2]) was higher (1.9 × 10⁻³ s−1) than the weak case (1.1 × 10⁻³ s−1), producing higher ozone photochemical production. Another important factor that increases the O3 concentrations was due to the wind directions. In the strong WPSH_SHO3 case, southwest wind occurred frequently in Shanghai. In the contrast, in the weak WPSH_SHO3 case, east and southeast winds were dominated (Fig. 8), which transported relative clean air from ocean, resulting in lower O3 concentrations in the weak case. In addition, the areas with subtropical high-pressure control (the strong WPSH_SHO3 case) are dominated by subsidence air flow, producing weak convection and cumulus clouds. Under less cloud conditions, solar radiation is high, which may greatly enhance the photochemical reactions of O3.
Table 1.
Local weather conditions of the strong WPSH_SHO3 and weak WPSH_SHO3 conditions in the Baoshan station.
| RH (%) | Tmax (°C) | J[NO2] (10−3 s−1) | Wind speed (m s−1) | |
|---|---|---|---|---|
| 2016 | 71.3 | 29.8 | 1.1 | 2.7 |
| 2017 | 65.4 | 32.4 | 1.9 | 2.5 |
The J[NO2] was measured at the Pudong monitoring site of Shanghai Meteorological Service and other data were measured at Shanghai Baoshan Climate Observatory.
Figure 8.
The wind rose maps in the weak case (a) and the strong case (b) over Baoshan station (color bars represent different wind speed). The wind direction and wind speed data were measured at Shanghai Baoshan Climate Observatory. The maps were generated using NCL software [The NCAR Command Language (Version 6.3.0) [Software]. (2015). Boulder, Colorado: UCAR/NCAR/CISL/TDD. 10.5065/D6WD3XH5].
In order to better investigate the effects of the WPSH_SHO3 on the O3 pollution in Shanghai, a global chemical transport model (MOZART-4) is applied to calculate the distribution of ozone concentrations under the different WPSH_SHO3 conditions (the strong case in Jul. 2017 and the weak case in Aug. 2016). The detailed model description is shown in section 2.3. First we conduct a model validation by comparing the model result with the measurement.
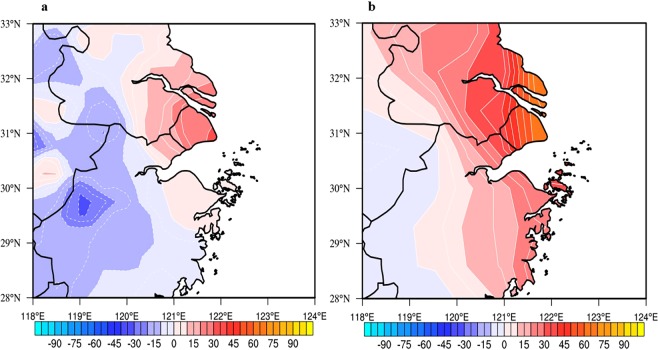
Figure 9 shows the comparisons between the model results of MOZART-4 and the observed anomalies of monthly mean O3 concentrations between Jul. 2017 and Aug. 2016. The results suggest that the observations and the simulated results present a similar in the spatial distribution. For example, there were positive O3 anomalies in Shanghai and the northwest of Shanghai, while there were negative O3 anomalies in the west of Shanghai. However, the magnitude anomalies were higher in the simulation than the measured results. In Shanghai, both measured and modeled O3 showed strong positive anomalies, ranging from 20 to 60 μg·m−3. Because this study is focus on the O3 anomalies in Shanghai, the model simulation provides a base for the further studies.
Figure 9.
The O3 concentration (μg·m−3) anomalies in the Shanghai region in the strong and weak cases (Jul. 2017 and Aug. 2016), which were derived from observation data (a) and MOZART-4 (b). The maps were generated using NCL software [The NCAR Command Language (Version 6.3.0) [Software]. (2015). Boulder, Colorado: UCAR/NCAR/CISL/TDD. 10.5065/D6WD3XH5].
Because there are several important factors in controlling the O3 concentrations, such as diffusion (DIF), (b) advection (ADV), and (c) gas-phase chemistry (CHEM), model analysis can quantify these individual effects, and better understand the effect of the WPSH_SHO3 on the O3 pollution in Shanghai.
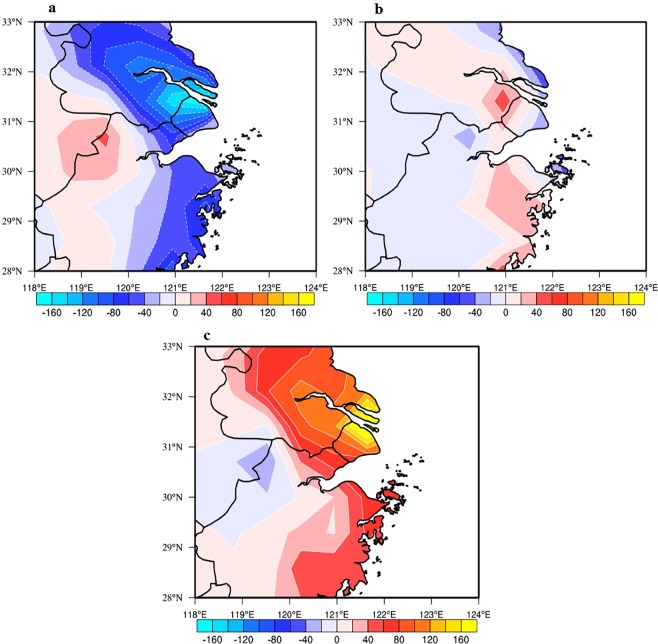
Figure 10 shows the calculated anomalies of the contributions of individual processes to O3 formation in the Shanghai region under the different WPSH_SHO3 conditions. In the strong WPSH_SHO3 case, the vertical diffusion produced significant reduction for the O3 concentrations at the surface. This was due to the fact that with less cloud condition, the solar radiation was stronger, producing higher thermal turbulence and vertical diffusion. As a result, the surface O3 concentrations were vertical mixed in the upper planetary boundary layer, causing the decrease of O3 concentrations at surface layer in Shanghai (with a maximum reduction of 80–160 μg·m−3·day−1, shown in Fig. 10a). As we mentioned before, the wind direction in the strong case was favorable for the O3 concentrations, which resulted in about 20–40 μg·m−3·day−1 increase of surface O3 concentrations (Fig. 10b). The highest enhancement of O3 concentrations was due to the process of photochemistry. As shown in Fig. 10c, the maximum increase of O3 concentrations in Shanghai ranges about 100–180 μg·m−3·day−1, resulting from the higher O3 chemical productivity. In total, the surface O3 concentrations were higher in the strong WPSH_SHO3 case than the weak WPSH_SHO3 case in Shanghai.
Figure 10.
Anomalies of the contributions of individual processes to O3 formation (μg·m−3·day−1) in the Shanghai region in the strong and weak cases calculated by MOZART-4. The contributors include the (a) total diffusion (DIF), (b) advection (ADV) and (c) gas-phase chemistry (CHEM). The maps were generated using NCL software [The NCAR Command Language (Version 6.3.0) [Software]. (2015). Boulder, Colorado: UCAR/NCAR/CISL/TDD. 10.5065/D6WD3XH5].
Conclusions
It is well known that WPSH is a strongest subtropical anticyclone high pressure system controlling monthly weather conditions in YRD during late-summer and may intensify in a warming climate background. To systemically study the impact of WPSH on inter-annual variability of ozone pollution in Shanghai under the climate change background, intensive surface measurements of ozone and meteorological data and the NCEP/NCAR re-analyzed meteorological data are used in the analysis. The highlights of this study are as follows:
To better understand the relationship between WPSH and O3 in Shanghai, we define geopotential height averaged over a key area (122.5°E-135°E, 27.5°N-35°N) at 500 hPa. In this region, the correlation coefficients between related to ozone concentration in Shanghai shows a maximum positive value (0.78). As a result, the WPSH’s in this region (defined as WPSH_SHO3) can better represent the effect of WPSH on the O3 concentrations in Shanghai, and are used in this study.
Long-term trend analysis shows that the WPSH_SHO3 index significantly increased from 1960 to 2017, with a rate of 5 gpm decade−1, resulting from the global climate change.
To quantify the effect of the increasing WPSH_SHO3 on the O3 concentrations in Shanghai, two cases (i.e., a weak WPSH_SHO3 case - occurred in Jul. 2017, and a strong WPSH_SHO3 – occurred in Aug. 2016) are selected and analyzed in this study. The results show that in the strong WPSH_SHO3 case, the lower relative humidity, higher temperature, less cloud, and higher solar radiation produced higher ozone photochemical production than the weak WPSH_SHO3 case. In addition the wind directions in the strong case were dominated by southwest wind. In the contrast, in the weak WPSH_SHO3 case, east and southeast winds were dominated, which transported relative clean air from ocean, resulting in lower O3 concentrations in the weak case.
Because there are several important factors in controlling the O3 concentrations, such as diffusion (DIF), (b) advection (ADV), and (c) gas-phase chemistry (CHEM), The MOZART model is applied to study the individual contributions to the surface O3 in Shanghai. The results show that in the strong WPSH_SHO3 case, the vertical diffusion produced significant reduction for the O3 concentrations at the surface. This was due to the fact that with less cloud condition, the solar radiation was stronger, producing higher thermal turbulence and vertical diffusion as well as the planetary boundary layer heights. As a result, the surface O3 concentrations were vertical mixed in the upper planetary boundary layer, causing the decrease of O3 concentrations at surface layer in Shanghai.
Materials and Methods
Measured surface chemical observations
Two measured surface O3 datasets are used in the study: (1) Hourly averaged O3 concentrations from 2013 to 2017 are measured by the Urban Air Quality Center in China, operated by the Chinese Environmental Production Ministration (CEPM), at 367 monitoring stations (http://106.37.208.233:20035). Based on the hourly average O3 concentrations, maximum average 8-hour ozone values (MDA8) and maximum average 1-hour ozone values (MDA1) are calculated in the Shanghai area. The monthly mean MDA8 O3 and MDA1 O3 concentrations from late-summer in 2013 to 2017 are further calculated. (2) The hourly photolysis rate of NO2 (J[NO2]) is measured and analyzed at the Pudong monitoring site of Shanghai Meteorological Service.
Meteorological data
To make a comprehensive analysis of WPSH, four different meteorological data sets are used in this study: (1) The hourly surface meteorological parameters at Shanghai Baoshan Climate Observatory (including temperature, relative humidity, 10 m wind direction and wind speed) are measured and analyzed. The measurements in this site are used for the international meteorological data exchange sponsored by World Meteorological Organization (WMO). Thus these data can well depict the local meteorological characteristics in Shanghai. (2) Surface temperature at 160 Chinese monitoring sites are obtained from the National Climate Center of China. (3) The climate data of five WPSH indices (including area, intensity, ridge position, northern boundary position and western ridge point index) are obtained from the National Climate Center of China. (4) The large-scale weather conditions, such as general circulation are used the data from the National Center for Environmental Prediction (NCEP) and National Center for Atmospheric Research (NCAR) reanalysis data41. The data have a horizontal resolution of 2.5° × 2.5°, including the geo-potential height, specific humidity and winds data. In addition, the solar radiation data with a horizontal resolution of 1.875° × 1.904° is also used in this article.
Global chemistry transport model (Mozart-4) description
A global chemistry transport model (MOZART-4; Model for Ozone and Related chemical Tracers, version-4) is used in this study. The detailed model description is shown by Emmons et al.42, and the detailed aerosol modules are shown by Tie et al.43. The MOZART-4 model is a global chemical transport model. The model is designed to study the global distributions of tropospheric trace gases and aerosol particles. In this study, the horizontal resolution of the model is 0.7° × 0.7°, with 42 vertical levels. Advection of tracers is performed using the flux-formed semi-Lagrangian advection scheme44. The deep convection scheme developed by Zhang and McFarlane45 is included in the model. The model transport is driven by the European Centre for Medium-Range Weather Forecasts (ECMWF) assimilated wind fields, with 0.5° × 0.5° horizontal resolution46. The meteorological data is interpolated to fit the model horizontal resolution by using a bilinear interpolation method. The MOZART model with such configurations has been successfully employed by Chang et al.47 to investigate the impact of El Niño event on regional air quality of China. The MOZART-4 model is applied to calculate the contributions of individual processes to O3 formation, including the total diffusion (DIF), advection (ADV) and gas-phase chemistry (CHEM).
Acknowledgements
This work is sponsored by the Ministry of Science and Technology of China (Grant No. 2018YFC0213800), the National Natural Science Foundation of China (Grant No. 91644223, 41430424), Science and Technology Research and Development project of Shanghai meteorological service (Grant No. MS201807) and the Shanghai Sailing Program (Grant No. 18YF1421200). We thank NCAR for making available the NCAR Command Language. We are grateful to the editors and reviewers for their very helpful comments and suggestions.
Author contributions
L.-Y.C., X.T. and J.-M.X. designed the study. L.-Y.C., J.-M.X. and W.G. performed the analyses and analyzed the data. L.-Y.C. and X.T. wrote the paper. All authors contributed to the paper.
Data availability
All data is available on-line and free of charge. NCEP Reanalysis data provided by the NOAA/OAR/ESRL PSD, Boulder, Colorado, USA, from their Web site at https://www.esrl.noaa.gov/psd/. The ECMWF ERA-Interim reanalysis data is available at the European Centre for Medium-Range Weather Forecasts. The WPSH indices (including area, intensity, ridge position, northern boundary position and western ridge point index) can be obtained from the National Climate Center of China. The observational data of surface O3 concentrations is available at http://106.37.208.233:20035. The photolysis rate of NO2 (J[NO2]) and surface meteorological parameters (including temperature, relative humidity, 10 m wind direction and wind speed) can be obtained from Shanghai Meteorological Service48.
Competing interests
The authors declare no competing interests.
Footnotes
Publisher’s note Springer Nature remains neutral with regard to jurisdictional claims in published maps and institutional affiliations.
Contributor Information
Jianming Xu, Email: metxujm@163.com.
Xuexi Tie, Email: tiexx@ieecas.cn.
References
- 1.Tie X, et al. Atmos. Environ. 2009. Measurement and modeling of O3 variability in Shanghai, China: application of the WRF-Chem model; pp. 4289–4302. [Google Scholar]
- 2.Tie X, et al. Effect of heavy haze and aerosol pollution on rice and wheat productions in China. Sci. Rep. 2016;6:29612. doi: 10.1038/srep29612. [DOI] [PMC free article] [PubMed] [Google Scholar]
- 3.Fuhrer J, et al. Current and future ozone risks to global terrestrial biodiversity and ecosystem processes. Ecology and Evolution. 2016;6:8785–8799. doi: 10.1002/ece3.2568. [DOI] [PMC free article] [PubMed] [Google Scholar]
- 4.Tai APK, Martin MV. Impacts of ozone air pollution and temperature extremes on crop yields: Spatial variability, adaptation and implications for future food security. Atmospheric Environment. 2017;169:11–21. doi: 10.1016/j.atmosenv.2017.09.002. [DOI] [Google Scholar]
- 5.Tie X, et al. Severe Pollution in China Amplified by Atmospheric Moisture. Sci. Rep. 2017;7:15760. doi: 10.1038/s41598-017-15909-1. [DOI] [PMC free article] [PubMed] [Google Scholar]
- 6.Tie X, et al. Chemical characterization of air pollution in Eastern China and the Eastern United States. Atmos. Environ. 2006;40:2607–2625. doi: 10.1016/j.atmosenv.2005.11.059. [DOI] [Google Scholar]
- 7.Geng FH, Zhao CS, Tang X, Lu GL, Tie X. Analysis of ozone and VOCs measured in Shanghai: a case study. Atmos. Environ. 2007;41:989–1001. doi: 10.1016/j.atmosenv.2006.09.023. [DOI] [Google Scholar]
- 8.Xu JM, et al. The meteorological modulation on PM2.5 inter-annual oscillation during 2013 to 2015 in Shanghai, China. Science of the Total Environment. 2016;572:1138–1149. doi: 10.1016/j.scitotenv.2016.08.024. [DOI] [PubMed] [Google Scholar]
- 9.Gao W, et al. Long-term trend of O3 in a mega City (Shanghai), China: Characteristics, causes, and interactions with precursors. Science of the Total Environment. 2017;603–604:425–433. doi: 10.1016/j.scitotenv.2017.06.099. [DOI] [PubMed] [Google Scholar]
- 10.Lin YF, et al. Temporal-Spatial Characteristics and Impact Factors of Ozone Pollution in Shanghai. Environmental Monitoring in China. 2017;33:60–67. [Google Scholar]
- 11.National Research Council (NRC). Rethinking the Ozone Problem in Urban and Regional Air Pollution. The National Academies Press, Washington, DC (1991).
- 12.Sillman S. The use of NOy, H2O2, and HNO3 as indicators for ozone-NOx hydrocarbon sensitivity in urban locations. J. Geophys. Res. 1995;100:14175–14188. doi: 10.1029/94JD02953. [DOI] [Google Scholar]
- 13.Tie X, et al. Megacity impacts on regional ozone formation: observations and WRF-Chem modeling for the MIRAGE-Shanghai field campaign. Atmos. Chem. Phys. 2013;13:5655–5669. doi: 10.5194/acp-13-5655-2013. [DOI] [Google Scholar]
- 14.Huang JP, et al. The global oxygen budget and its future projection. Science Bull. 2018;63:1180–1186. doi: 10.1016/j.scib.2018.07.023. [DOI] [PubMed] [Google Scholar]
- 15.Huang JP, et al. Dryland climate change recent progress and challenges. Rev. of Geophys. 2017;55:719–778. doi: 10.1002/2016RG000550. [DOI] [Google Scholar]
- 16.Steiner AL, et al. Observed suppression of ozone formation at extremely high temperatures due to chemical and biophysical feedbacks. Proc. Natl. Acad. Sci. USA. 2010;107:19685–19690. doi: 10.1073/pnas.1008336107. [DOI] [PMC free article] [PubMed] [Google Scholar]
- 17.Turner AJ, et al. Summertime cyclones over the Great Lakes Storm Track from 1860–2100: variability, trends, and association with ozone pollution. Atmos. Chem. Phys. 2013;13:565–578. doi: 10.5194/acp-13-565-2013. [DOI] [Google Scholar]
- 18.Zhu J, Liang XZ. Impacts of the Bermuda High on regional climate and ozone over the United States. J. Climate. 2013;26:1018–1032. doi: 10.1175/JCLI-D-12-00168.1. [DOI] [Google Scholar]
- 19.Shen L, Mickley LJ, Tai APK. Influence of synoptic patterns on surface ozone variability over the eastern United States from 1980 to 2012. Atmos. Chem. Phys. 2015;15:10925–10938. doi: 10.5194/acp-15-10925-2015. [DOI] [Google Scholar]
- 20.Wang YX, et al. Influence of the Bermuda High on inter-annual variability of summertime ozone in the Houston –Galveston- Brazoria region. Atmos. Chem. Phys. 2016;16:15265–15276. doi: 10.5194/acp-16-15265-2016. [DOI] [Google Scholar]
- 21.Tie X, Cao JJ. Understanding Variability of Haze in Eastern China. J. Fundam Renewable Energy Appl. 2017;7:6. doi: 10.4172/2090-4541.1000241. [DOI] [Google Scholar]
- 22.Gao J, Wang T, Ding A, Liu C. Observational study of ozone and carbon monoxide at the summit of mount Tai (1534 m a.s.l.) in central-eastern China. Atmos. Environ. 2005;39:4779–4791. doi: 10.1016/j.atmosenv.2005.04.030. [DOI] [Google Scholar]
- 23.Ding AJ, et al. Ozone and fine particle in the western Yangtze River Delta: an overview of 1yr data at the SORPES station. Atmos. Chem. Phys. 2013;13:5813–5830. doi: 10.5194/acp-13-5813-2013. [DOI] [Google Scholar]
- 24.Ding YH. Monsoons over China. Adv. Atmos. Sci. 1994;11:252–252. doi: 10.1007/BF02666553. [DOI] [Google Scholar]
- 25.Zhou TJ, Yu RC. Atmospheric water vapor transport associated with typical anomalous summer rainfall patterns in China. J. Geophys. Res. 2005;110:D08104. [Google Scholar]
- 26.Qi L, He JH, Zhang ZQ, Guan ZY. West Pacific subtropical high double ridges and intraseasonal variability of the South China Sea summer monsoon. Theoretical and applied limatology. 2010;100:385–396. doi: 10.1007/s00704-009-0188-8. [DOI] [Google Scholar]
- 27.Qu WJ, Wang J, Gao SH, Wu TW. Effect of the strengthened western Pacific subtropical high on summer visibility decrease over eastern China since 1973. Journal of geophysical research: atmospheres. 2013;118:7142–7156. [Google Scholar]
- 28.Huang M, et al. Links between Western Pacific Subtropical High and vegetation growth in China. J. Geogr. Sci. 2018;28:3–14. doi: 10.1007/s11442-018-1455-3. [DOI] [Google Scholar]
- 29.He JW, Wang YX, Hao JM, Shen LL. Variations of surface O3 in August at a rural site near Shanghai: Influences from the West Pacific Subtropical high and anthropogenic emissions. Environ. Sci. Pollut. Res. 2012;19:4016–4029. doi: 10.1007/s11356-012-0970-5. [DOI] [PubMed] [Google Scholar]
- 30.Shu L, et al. Integrated studies of a regional ozone pollution synthetically affected by subtropical high and typhoon system in the Yangtze River Delta region, China. Atmos. Chem. Phys. 2016;16:15801–15819. doi: 10.5194/acp-16-15801-2016. [DOI] [Google Scholar]
- 31.Zhao ZJ, Wang YX. Influence of the West Pacific subtropical high on surface ozone daily variability in summertime over eastern China. Atmospheric Environment. 2017;170:197–204. doi: 10.1016/j.atmosenv.2017.09.024. [DOI] [Google Scholar]
- 32.Li W, Li L, Ting M, Liu Y. Intensification of Northern Hemisphere subtropical highs in a warming climate. NATURE GEOSCIENCE. 2012;5:830–834. doi: 10.1038/ngeo1590. [DOI] [Google Scholar]
- 33.Ministry of Environmental Protection of the People’s Republic of China. General Administration of Quality Supervision, Inspection and Quarantine of the People’s Republic of China, National ambient air quality standards: CNAAQS2012, GB 3095-2012 (2012).
- 34.Tao, S. Y. & Chen L. X. A review of recent research on the East Asian summer monsoon in China, Monsoon Meteorology, Oxford University Press (1987).
- 35.Huang JY, Wang SW. Investigations on variations of the subtropical high in the Western Pacific during historic times. Climatic Change. 1985;7:427–440. doi: 10.1007/BF00139057. [DOI] [Google Scholar]
- 36.Liu Y, Li W, Zuo J, Hu ZZ. Simulation and projection of the western pacific subtropical high in CMIP5 models. J. Meteor. Res. 2014;28:327–340. doi: 10.1007/s13351-014-3151-2. [DOI] [Google Scholar]
- 37.He C, et al. Enhanced or Weakened Western North Pacific Subtropical High under Global Warming? Sci. Rep. 2015;5:16771. doi: 10.1038/srep16771. [DOI] [PMC free article] [PubMed] [Google Scholar]
- 38.Geng FH, et al. Effect of isoprene emissions from major forests on ozone formationin the city of Shanghai, China. Atmos. Chem. Phys. 2011;11:10449–10459. doi: 10.5194/acp-11-10449-2011. [DOI] [Google Scholar]
- 39.Lam KS, Wang TJ, Wu CL, Li YS. Study on an ozone episode in hot season in Hong Kong and transboundary air pollution over Pearl River Delta region of China. Atmos. Environ. 2005;39:1967–1977. doi: 10.1016/j.atmosenv.2004.11.023. [DOI] [Google Scholar]
- 40.Yu SC. Fog geoengineering to abate local ozone pollution at ground-level by enhancing air moisture. Environ Chem Lett. 2018;17:565–580. doi: 10.1007/s10311-018-0809-5. [DOI] [Google Scholar]
- 41.Kalnay E, et al. The NCEP /NCAR 40-year reanalysis project. Bulletin of the American Meteorological Society. 1996;77:437–471. doi: 10.1175/1520-0477(1996)077<0437:TNYRP>2.0.CO;2. [DOI] [Google Scholar]
- 42.Emmons LK, et al. Description and evaluation of the Model for Ozone and Related chemical Tracers, version4 (MOZART-4) Geoscientific Model Development. 2010;3:43–67. doi: 10.5194/gmd-3-43-2010. [DOI] [Google Scholar]
- 43.Tie X, et al. Assessment of the global impact of aerosols on tropospheric oxidants. J. Geophys. Res. 2005;110:D03204–D03235. doi: 10.1029/2004JD005359. [DOI] [Google Scholar]
- 44.Lin SJ, Rood RB. Multidimensional flux-form semi-Lagrangian transport schemes. Mon. Wea. Rev. 1996;124:2046–2070. doi: 10.1175/1520-0493(1996)124<2046:MFFSLT>2.0.CO;2. [DOI] [Google Scholar]
- 45.Zhang GJ, McFarlane NA. Sensitivity of climate simulations to the parameterization of cumulus convection in the Canadian Climate Center General circulation model. Atmos. Ocean. 1995;33:407–446. doi: 10.1080/07055900.1995.9649539. [DOI] [Google Scholar]
- 46.Simmons A, Uppala S, Dee D, Kobayashi S. ERA-Interim: New ECWMF reanalysis products from 1989 onwards. ECWMF Newsletter. 2007;110:25–35. [Google Scholar]
- 47.Chang LY, Xu JM, Tie XX, Wu JB. Impact of the 2015 EI Niño event on winter air quality in China. Sci. Rep. 2016;6:34275. doi: 10.1038/srep34275. [DOI] [PMC free article] [PubMed] [Google Scholar]
- 48.The NCAR Command Language (Version 6.3.0) [Software]. Boulder, Colorado: UCAR/NCAR/CISL/TDD, 10.5065/D6WD3XH5 (2015).
Associated Data
This section collects any data citations, data availability statements, or supplementary materials included in this article.
Data Availability Statement
All data is available on-line and free of charge. NCEP Reanalysis data provided by the NOAA/OAR/ESRL PSD, Boulder, Colorado, USA, from their Web site at https://www.esrl.noaa.gov/psd/. The ECMWF ERA-Interim reanalysis data is available at the European Centre for Medium-Range Weather Forecasts. The WPSH indices (including area, intensity, ridge position, northern boundary position and western ridge point index) can be obtained from the National Climate Center of China. The observational data of surface O3 concentrations is available at http://106.37.208.233:20035. The photolysis rate of NO2 (J[NO2]) and surface meteorological parameters (including temperature, relative humidity, 10 m wind direction and wind speed) can be obtained from Shanghai Meteorological Service48.


