

Abstract
Olive is a long-living perennial species with a wide geographical distribution, showing a large genetic and phenotypic variation in its growing area. There is an urgent need to uncover how olive phenotypic traits and plasticity can change regardless of the genetic background. A two-year study was conducted, based on the analysis of fruit and oil traits of 113 cultivars from five germplasm collections established in Mediterranean Basin countries and Argentina. Fruit and oil traits plasticity, broad‐sense heritability and genotype by environment interaction were estimated. From variance and heritability analyses, it was shown that fruit fresh weight was mainly under genetic control, whereas oleic/(palmitic + linoleic) acids ratio was regulated by the environment and genotype by environment interaction had the major effect on oil content. Among the studied cultivars, different level of stability was observed, which allowed ranking the cultivars based on their plasticity for oil traits. High thermal amplitude, the difference of low and high year values of temperature, negatively affected the oil content and the oleic acid percentage. Information derived from this work will help to direct the selection of cultivars with the highest global fitness averaged over the environments rather than the highest fitness in each environment separately.
Subject terms: Natural variation in plants, Plant breeding
Introduction
Cultivated olive (Olea europaea L. subsp. europaea var. europaea) covering more than eight million hectares, is one of the main oil crops worldwide. The crop, traditionally cultivated in the Mediterranean Basin, where it still represents 92% of the entire world supply (International Olive Council data), is now experiencing a great expansion to new and different areas of south-western Asia, Oceania, South Africa, and the Americas1–3. The Mediterranean area, considered particularly sensitive to global climate change, represents a hotspot region where the effects of new climate conditions will threaten the agro-ecosystems, with serious impacts on plant/environment interactions4–6. Thus, olive cultivation is going to face the challenges posed by the new climate constraints, that will benefit some olive-producing areas, and will adversely affect others6,7. In this context, knowledge about the olive reaction to the new climate scenarios represents relevant information for defining new adaptation strategies8.
The ability of plants to face environmental changes, expressing different phenotypes under various climate constraints, is known as phenotypic plasticity9,10. The term is used to describe the physiological, morphological and developmental variability of a given genotype in response to different environments11,12. The extent of genotype plasticity may increase or reduce plant adaptation towards specific conditions13–19. The genotypic variation, within each crop species, could contribute to overcome local constraints through the selection of individuals suitable for each condition. In fact, plant crop species show different responses across different climates20. The new olive plantation areas, outside the Mediterranean countries, require greater knowledge on the performance of this crop under different climatic conditions21,22. Global warming can affect olive yield and oil quality, therefore the study of oil composition comparing new and traditional cultivation areas can provide useful information to optimize the crop productivity23.
Olive trees are able to survive and produce under different and complex agro-ecological conditions, because of the high genetic variability within the species20,23–29. Therefore, it may work as a reference plant species among several fruit perennial crops. Olive cultivation could contribute mitigating the effects of climate change as: water scarcity, increasing temperatures and meteorological disorders30,31. While the increase of mean temperatures in recent years has made possible to extend the olive cultivation to northern latitudes, the trend of further increases in temperatures could cause the progression of pre-desertification conditions in Mediterranean countries, making its cultivation more arduous6,32,33. On the contrary, sudden thermal drops, that could occur in areas highly suited to olive growing, could lead to the lower crop yields3,34. In fact, the olive cultivation area has changed over the millennia, depending on several factors, among which the climate conditions played a main role35,36.
In olive, fruit oil content and composition is the result of a complex interaction between genotypic, environmental and agronomical factors34–36. Genotype by environment (G × E) interaction results by variable phenotypes, but informative data on the correlation between genotype and phenotype and on the effectiveness of empirical selection are still missing1,37–40. G × E interaction also makes it difficult to choose cultivars well adapted to new and untested climate conditions9. Fruit size, oil content and oil quality are target objectives of the olive breeding41–44. Deep knowledge of the possible environmental effects on these traits would be useful to allow for an effective selection of high performing genotypes. Regarding oil quality, the unsaturated fatty acids (FAs) are the most important component of olive oil, followed by secondary metabolites, such as phenols45,46. Olive oil accumulates in the drupe mesocarp (more than 95%) and just a minimal percentage in the seed47. This feature determines a greater susceptibility of fatty acid composition to thermal variations concerning seed oleaginous crops48. Olive oil contains up to 83% of the monounsaturated oleic acid, followed by linoleic (3.5–21%), palmitic (7.5–20%), stearic (0.5–5%) and linolenic acid (<1%). The low content of saturated FAs in olive oil and the high percentage of monounsaturated FAs makes it an excellent source of fat, able to reduce cardiovascular diseases49.
Among the climatic factors that affect FAs composition, temperature plays an essential role by regulating FA desaturases50–52 and, therefore, variations in temperature may cause modifications in FAs composition53.
Several studies have evaluated the effect of climate conditions on fruit maturation and oil composition in restricted sets of cultivars and locations53–55, nevertheless, it has been observed that during oil accumulation, olive varieties could have different responses to temperature in terms of FAs composition38,51,52,54,56. Moreover, other experiments, under controlled temperature conditions, demonstrated that oil content is sensitive to temperature changes. In fact, by increasing the daily mean temperature between 16 °C and 32 °C, oil content decreases23. Analyzing oil accumulation on six olive cultivars at different locations, a negative correlation was observed between oil content and mean temperature37 and between maximum daily temperature during oil accumulation within a narrow range (29–31.5 °C) of temperatures18,57.
A comprehensive study testing a large number of cultivars in different locations with diverse climate conditions has never been previously reported. This work represents the first extensive study on the evaluation of a very large set of olive cultivars (113) during two growing seasons from five locations geographically and climatically different in Italy, Spain, Morocco, Lebanon, and Argentina. These cultivars were assessed for FAs composition, oil content and fruit traits. Results should address the following questions: (i) how do cultivars respond to different environments? (ii) How different environments may affect fruit and oil traits in olive? (iii) How knowledge on cultivar plasticity for FAs composition may be applied to optimize orchard management and breeding strategies to improve olive adaptation under new climate constrains?
Results
The environmental effect on trait plasticity in a common set of cultivars
A wide range of variation was observed for all analyzed traits. The traits included: fruit fresh weight (FrFW), fruit moisture (FrM), oil content in fruit dry weight (OCFrDW), palmitic acid (C16:0, expressed in percentage), oleic acid (C18:1), linoleic acid (C18:2) and oleic/(linoleic + palmitic) acids ratio (OLP) for the common set of 14 cultivars evaluated in six environments (Fig. 1, Supplementary Table S1). Among the studied characters, FrFW, C18:2, and OLP were the most variables within each environment, while FrM and C18:1 showed the lowest variability (Supplementary Table S1).
Figure 1.

Violin graphs representing trait variation in each environment (three sites x two seasons). Each plot shows the distribution of data for fourteen cultivars from the minimum to the maximum level, with horizontal inner lines showing the data median. The white boxplots representing the lower and upper limits of the first and third quartiles. The outliers are indicated with black dots. The horizontal width of the violin depends on the data density.
The highest average value of FrFW trait was related to Morocco15 (Morocco 2015) and Morocco16 (3.4 and 3.3 g, respectively), while in Morocco15 was detected the highest variability of this trait (55%) (Fig. 1A, Supplementary Table S1).
The highest average values of FrM were found in Spain15 (63.5%), whereas its main variation was related to Morocco15 (Fig. 1B and Supplementary Table S1).
The highest average values of OCFrDW were related to Morocco15 (45.8%), while the highest variation was related to Morocco16 (Fig. 1C, Supplementary Table S1).
The highest average values of C16:0 were registered for Morocco15 and Spain16 (17.5 and 16.1%, respectively), although the highest variation was registered in Morocco16 (Fig. 1D, Supplementary Table S1).
For C18:1, the highest average value was observed in Italy16 (79.1%), while the highest variation was found for the Morocco15 (12.2%) (Fig. 1E, Supplementary Table S1). A general lower variability for FAs composition was observed in Italy15 and Italy16, related to IOGC in Italy respect to the rest of locations, particularly for C18:1.
The highest average values of C18:2 were found for Morocco15 (15.2%), whereas its highest variation was related to Spain15 (Fig. 1F, Supplementary Table S1).
Finally, the OLP ratio had the highest values in Italy15 and Italy16, while approximately the same ratios were observed in the other four environments. The highest variation of OLP among different environments was related to Spain15 with 42.6% (Fig. 1G, Supplementary Table S1).
The genotype effect on trait plasticity in a common set of cultivars
The same dataset of 14 cultivars in six environments was used to investigate the cultivar variability (Fig. 2 and Supplementary Table S2). In this sense, the highest average value of FrFW was registered for cv. ‘Oblica’ (Fig. 2A and Supplementary Table S2). The highest variation for FrFW, in six different environments, was registered for cvs. ‘Picual’ and ‘Leccino’ (48.6 and 33.8%, respectively) whereas cv. ‘Bianchera’ was the most stable for this trait.
Figure 2.

Scatter plots showing trait variation for each cultivar over six environments (blue - Italy15, light blue - Italy16; green - Morocco15, light green - Morocco16; red - Spain15 and pink - Spain16). Each colored circle is the mean trait value of two trees for each cultivar. The x axis in all graphs represent the independent variable (cultivar), the y axis of the graph corresponds to the trait value.
The highest average values (%) of FrM were related to ‘Oblica’ and ‘Maurino’ cultivars (63.9 and 63.4%, respectively), while ‘Frantoio’ and ‘Moraiolo’ cultivars displayed the lowest ones. Among the 14 cultivars, ‘Arbequina’ and ‘Moraiolo’ were the most unsteady cultivars for this character (CVtrait, 16.8 and 17.4%, respectively) (Fig. 2B and Supplementary Table S2).
The highest average percentages of OCFrDW were related to cvs. ‘Bianchera’ (49.6%) and ‘Carolea’ (47.8%), while ‘Koroneiki’ showed the lowest values among all cultivars. In the six environments under study, ‘Lastovka’ and ‘Moraiolo’ cultivars displayed the highest variation for this trait (Fig. 2C and Supplementary Table S2).
The highest amount of C16:0 was detected for ‘Salonenque’ cultivar (19.0%), while ‘Coratina’ was the cultivar which had the lowest amount (12.7%) (Fig. 2D and Supplementary Table S2). C16:0 had the highest variation in the cvs. ‘Empeltre’ (17.6%) and ‘Arbequina’ (16.4%).
‘Picual’ and ‘Koroneiki’ cultivars showed the highest amount of C18:1, with 79.4 and 77.8% on average, respectively. It is interesting to note that ‘Picual’ not only reached the highest amount of C18:1, but also was the most stable cultivar for this trait in all environments (3.7%) (Fig. 2E and Supplementary Table S2). While ‘Salonenque’ and ‘Oblica’ cultivars showed the highest variation for this trait (16.8% and 14.7%, respectively).
The cultivar ‘Salonenque’ had the highest average amount of C18:2 (20.0%), while the lowest values were detected in ‘Picual’ (3.2%). ‘Coratina’ cultivar showed the highest variation for C18:2 (75.4%), while ‘Carolea’ was the most stable cultivar for this trait (31.6%) (Fig. 2F and Supplementary Table S2).
The highest OLP ratio was found in csv. ‘Picual’ (5.1) and ‘Coratina’ (4.1), while the lowest amount was observed in ‘Salonenque’ cultivar. ‘Oblica’ and ‘Empeltre’ cultivars had the highest percentage of instability for OLP (51.7 and 51.9%, respectively), being ‘Picual’ the most stable one for this trait (Fig. 2G and Supplementary Table S2).
Finally, the most variable traits over six environments were C18:2 and OLP which showed the highest CVm values (40.75% and 32.65%, respectively). In contrast, OCFrFW (8.41%) and C18:1 (9.04%) were the most stable traits over six environments (Supplementary Table S2).
Pearson correlation coefficients among the evaluated traits by cultivar showed significant negative correlation coefficients between C18:1 versus C16:0 and C18:2 (Supplementary Table S3). These results were highly consistent among the different evaluated cultivars.
The complex effect of genotype, environment and their interaction on trait plasticity of all studied cultivars
A full dataset of all cultivars (113) from nine environments (Supplementary Table S4) was used to analyze the variance components using REML models (Table 1). σ²G was the main provider to total variance for FrFW (64.6%) and C16:0 (47.3%), σ²E for FrM (69.9%) and OLP (43.9%), and σ²GxE for OCFrDW (43.6%). The remaining FAs evaluated (C18:1 and C18: 2), both σ²G and σ²E showed similarly high values (from 35.8% to 39.1%). Consequently, broad-sense heritability (H2) ranged from 0.32 to 0.73, over the seven studied traits. FrFW had the highest H2 estimates (0.73); other traits, especially FAs and OLP, had also high values (0.59–0.64), while the lowest one was related to OCFrDW (0.32).
Table 1.
Results of variance analysis (%) and heritability from REML models for 113 cultivars in nine environments.
| FrFW | FrM | OCFrDW | C16:0 | C18:1 | C18:2 | OLP | |
|---|---|---|---|---|---|---|---|
| Genotype (σ²G) | 64.6 | 13.6 | 27.2 | 47.3 | 36.1 | 39.1 | 35.9 |
| Environment (σ²E) | 11.5 | 69.9 | 16.6 | 26.1 | 38.6 | 35.8 | 43.9 |
| Genotype x Environment (σ²GxE) | 18.4 | 10.8 | 43.6 | 11.1 | 14.9 | 15.5 | 12.4 |
| Residual Variance (σ² ε) | 5.5 | 5.7 | 14.6 | 15.6 | 10.4 | 9.6 | 7.7 |
| H2 | 0.73 | 0.45 | 0.32 | 0.64 | 0.59 | 0.61 | 0.64 |
Abbreviations: FrFW, fruit fresh weight, FrM, fruit moisture, OCFrDW, oil content in fruit dry weight, C16:0, palmitic acid, C18:1, oleic acid, C18:2, linoleic acid and OLP, oleic/(linoleic + palmitic) acids ratio.
H2 = broad sense of heritability.
BLUP values obtained for three of the main evaluated traits (OCFrDW, FrFW, and OLP), representative of the overall observed variability, were used to study the relationships among them and to identify promising genotypes regarding these traits. A positive significant correlation was obtained between genotypic BLUP values for OCFrDW and FrFW. Some of the analyzed cultivars, such as ‘Konservolia’, ‘Chalkidikis’ and ‘Domat’ had higher OCFrDW and FrFW than the average, while others such as ‘Koroneiki’, ‘Megaritiki’, ‘Pendolino’ and ‘Vera’ showed high negative values (Fig. 3). Correlation between BLUP values for OCFrDW and OLP was not significant, and then the distribution of cultivars for these traits was approximately the same in all BLUP areas (Supplementary Fig. S1).
Figure 3.

The best linear unbiased prediction (BLUP) graph for the effect of genotype on OCFrDW (oil content in fruit dry weight) vs FrFW (fruit fresh weight) interactions.
BLUP values for OCFrDW, FrFW and OLP traits on the different environments were not correlated among them, indicating different best-performing environments for each of the evaluated traits (Supplementary Fig. S2A, B). Thus, the highest BLUPs values for OCFrDW, FrFW, and OLP were obtained in Morocco15, Lebanon15 and Italy16, respectively.
Influence of temperatures on traits variation
Temperature variation in ten environmental conditions (five collections in two years), showed that the highest average of maximum temperatures (Tmax > 27 °C) was in Morocco15 and Morocco16, (WOGB-INRA, Morocco) and in Argentina15 and Argentina16 (OCC-INTA, Argentina), especially during winter and spring months. Although Italy15 and Italy16 (IOGC, Italy), with about 21 °C on average, had the lowest Tmax, and it was almost the lowest during the year (Fig. 4 and Supplementary Table S5). The highest standard deviation for Tmax during the year was related to Spain15 and Spain16 (WOGB-IFAPA, Spain).
Figure 4.
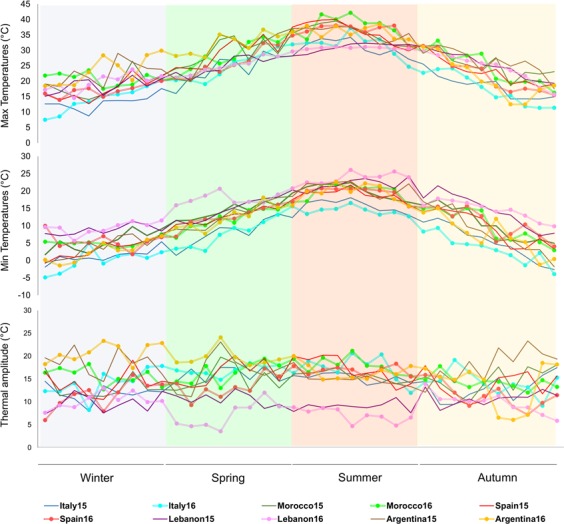
Maximum and minimum average temperature and thermal amplitude (ten days’ interval) for ten environments (five sites x two seasons, each environment showed by different colored lines).
For what concerns the average minimum temperatures, it is interesting to note that in Lebanon15 and Lebanon16 (OC-LARI, Lebanon), minimum temperatures were higher than in other environments, particularly during spring and summer. Furthermore, the Italian environments showed the lowest average of minimum temperatures during the year. Fluctuations between the minimum and maximum daily temperatures reached the highest values in the Argentinean environment, more evident during winter, spring and autumn when the thermal amplitude was higher than 17 °C. The lowest amplitude of temperatures was observed in Lebanon15 and Lebanon16 (10 and 8.6 °C, respectively), during the year and especially in spring and summer (Fig. 4 and Supplementary Table S5).
The whole dataset of 113 cultivars evaluated in nine environments, were used to calculate Pearson’s correlation coefficients between ten-day temperature series and average values of OCFrDW and C18:1 (Fig. 5). Maximum temperature showed a positive correlation with OCFrDW in winter, early spring and autumn, being negatively correlated in late spring and summer. OCFrDW also showed a positive correlation with the minimum temperature throughout the year, being negative with the thermal amplitude. The C18:1 showed a negative correlation with maximum and minimum average temperatures during the year. Negative correlation among C18:1 and temperature amplitude was also obtained in most of the seasons, except in autumn (Fig. 5).
Figure 5.

Pearson correlation coefficients of ten-days-average temperatures with OCFrDW (oil content in fruit dry weight) and C18:1(oleic acid) in all accessions and environments.
The accumulation of thermal time for 14 common cultivars in five environments (Fig. 6) showed that the increment of thermal time (TT °C) from 2,000 to 3,500 °C × day was negatively correlated to C18:1 content (R2 = 0.99). The highest percentage of this fatty acid was found in Italy15 and Italy16, with 2,000–2,100 TT °C × day and the lowest one was related to Morocco15 with 3,580 TT °C × day. On the contrary, both C18:2 and C16:0 showed positive correlations with TT °C × day (R2 = 0.99 and R2 = 0.92, respectively). As expected, OLP had the same accumulation pattern as C18:1, with R2 = −0.99. A high positive correlation was also found between FrFW and TT °C × day from full flowering time to harvesting time (R2 = 0.93). In fact, the lowest FrFW was related to Italy15 and Italy16 and the highest FrFW was achieved in Morocco15. There was no correlation of OCFrDW and FrM with TT °C (Fig. 6).
Figure 6.

Variation pattern of fatty acids composition and FrFW (fruit fresh weight) as a function of the accumulated thermal time (°Cd) from full flowering to harvesting time.
Discussion
Trait variation may be due to heritable differences among cultivars or it may be the result of phenotypic plasticity in trait values across varying environmental conditions58–60. Understanding which of these sources is responsible for trait variability is crucial for predicting plant response to various temperatures and water regimes16,61. The G × E interaction has been largely studied in plant breeding as a mean of producing new cultivars with stable and superior phenotypes62–65. G × E of individual traits has been assessed in numerous plants: annual species, such as wheat, rice, Arabidopsis and soybean66–68; forest trees, as poplar and pine68,69; and, to a lesser extent, fruit trees, including apple, wild cherry, and blueberry68–73.
In the present study, the effect of environment and genotype on trait plasticity was studied separately on a set of 14 cultivars simultaneously present in six different environments (three locations per two seasons). The degree of variation was analyzed for seven traits, like oil content and fatty acids composition, as main characters of interest for the agronomical value of cultivars and breeding progenies18,41,42,74–76. All analyzed cultivars showed different levels of plasticity for each trait, i.e. different environmental influence was observed for each cultivar and trait combination. ‘Arbequina’, one of the most widely cultivated olive varieties in the world, showed the lowest variation for oil content over the six environmental conditions, highlighting its exceptional capacity for oil yield production in different environments. The two cultivars ‘Picual’ and ‘Koroneiki’, with a vast cultivated area, especially in Spain and Greece, respectively, had their maximum fitness for oleic acid (high and stable values) over all environments. Among all analyzed cultivars, ‘Bianchera’, showed high stability for almost all the evaluated traits, while the opposite was observed for cv. Moraiolo. This may indicate that cv. Bianchera possesses higher adaptive capacity, for the studied traits, expressed as the highest global fitness averaged over the environments13,77, rather than the highest fitness in each environment separately78,79 respect to cv. Moraiolo.
An important goal of crop improvement should be to minimize unfavorable G × E interaction and allow advantageous dynamic trait responses9,80. Considering the importance and the economic impact of the olive oil and table olives production, it is becoming urgent to characterize the wide variability of this species, in order to identify those with a stable response in different environments, especially for important traits like oil content and fruit size. The complex effect of genotype, environment and their interaction on trait plasticity has been analyzed on 113 olive cultivars in five sites for two years, for a total of nine different environments. It represents the first concerted effort to gather information on the phenotype plasticity of a particularly large and representative sample of the entire variability of cultivated olive germplasm. Traits of high agricultural importance, related to fruit and olive oil composition, were taken under consideration.
A high variance in the whole dataset for fruit fresh weight due to the genetic background81 and G × E effect for oil content has been observed, while similar high genetic and environmental variance was observed for fatty acids composition. In accordance, G × E interaction was significant for maximum oil content and rate of accumulation, with similar or even higher variance component than the genetic variance, as reported by Navas-Lopez et al.82. Consequently, high values of broad-sense heritability were found for fruit fresh weight and low values for oil content, as previously reported from the analysis of variability between and within olive breeding progenies83. Similarly, the high heritability values obtained for fatty acids and mono-unsaturated fatty acid ratio (OLP) were also reported from studies in olive progenies84. Moreover, the correlation between BLUP values extracted from REML models suggested the possibilities for simultaneous selection for oil content and fruit fresh weight, while the opposite was found for oil content and mono-unsaturated fatty acid ratio. These results should be considered in further comparative trials and future breeding programs, to develop molecular tools useful as early selection criteria. Thus, phenotyping of large olive germplasm set under different environments should lead to a specific characterization of loci of interest with respect to classic approaches based on association or QTL mapping.
The correlation analysis between temperature and oil content and composition demonstrated that the highest values of maximum average temperature during the colder months of the year are positively correlated with an increase of oil content, but correlation becomes negative if temperatures rise substantially during the summer. High values of maximum and minimum temperatures affected negatively the percentage of oleic acid85,86, particularly if they occurred during the warmer months when fruits are developing and oil is accumulating in the mesocarp. High thermal amplitude during summer decreased the quantity of oil on dry weight and negatively affected the quantity of oleic acid during the colder months57. In fact, in the Argentinean environments, the oleic acid content was at the minimum level over all environments. Thus, olive oils arising from warm areas had consistently lower oleic acid content and higher mono-unsaturated fatty acid ratio, independently from cultivars, as previously observed by the analysis of a restricted set of samples and environments37,55. On the other hand, in environments with moderate minimum and maximum temperatures, without significant thermal range variability, as in Italy and Lebanon, oleic acid might go to the maximum levels, confirming other evidence obtained in some Italian environments37,87. The spread of olive orchards out of the Mediterranean area towards new habitats, completely different from the original ones, is limiting the ability of the species to survive and fructify3. Only few cultivars, as is the case of ‘Arbequina’ and some others used in new intensive groves, are able to yield consistently in the new environmental conditions, but often changing negatively their fatty acid profiles3,53,55. It has been widely pointed out that summer temperatures differently influence the fatty acids composition of olive oil37,55,88,89. It has also been shown that an increase in mean daily temperature, above 25 °C, has a negative effect on fruit dry weight, and a linear decrease both in fruit oil concentration and oleic acid proportion observed over the range of 16–32 °C1,23.
From a breeding perspective, it has been suggested that selection criteria should consider adaptive plasticity, particularly in relation to adaptation to climate changes90. Therefore, the use of cultivars with high stability, showing interesting traits such as high values of oil yield and oleic acid content, can decrease fluctuations in olive oil production and standard quality. The richness of olive germplasm should be thoroughly protected, conserving cultivars with phenotypic specializations, that would be able to buffer future environmental extremes due to climate and land-use changes91.
The present study indicates the need to understand how much phenotypic variability can be mainly attributed to genetic control, in order to enhance the prediction of crop performance across diverse environments.
The study offers useful information on the varieties best suited to each environment, depending on the desired trait. These studies on olive germplasm and comparative trials under different environments are essential to predict the behavior of specific varieties in view of widening the area of olive cultivation and future changes in climate scenarios, particularly regarding new environments not previously experienced by the olive crop.
The results obtained in this work should be taken into account to evaluate both genetic and environmental variance components for the traits mainly related to the product composition. Our study revealed complex patterns of phenotypic plasticity in the most important olive traits. Genotype effect on the plasticity of traits among cultivars, in addition to variation in mean trait values, may thus form a component of the adaptation to different climates in this species. The availability of extensive genetic and traits variation among olive cultivars, the knowledge on the response of fatty acids composition to temperature, and the new information on the genomic composition of the species, will facilitate, in the near future, development of new olive genotypes well adapted to different environments through genomics-assisted breeding.
Materials and Methods
Plant material
Fruit samples were collected from trees of cultivars available in five olive germplasm collections located in Italy, Spain, Morocco, Lebanon, and Argentina. Thus, the following collections were included in the study: (i) the World Olive Germplasm Bank (WOGB-IFAPA) of IFAPA (Cordoba, Spain); (ii) the World Olive Germplasm Bank of INRA (WOGB-INRA) (Tassaout, Marrakech, Morocco); (iii) the International Olive Germplasm Collection (IOGC) of Zagaria (Enna, Italy); (iv) the Olive Collection of LARI (OC-LARI) (Abdeh, Lebanon); and (v) the Olive Cultivar Collection of INTA (OCC-INTA) (San Juan, Argentina), to represent non-Mediterranean climate conditions (Supplementary Table S6). The combination of five collection locations and two growing seasons (2015 and 2016) represent nine different environments, (only 2016 data were analyzed from INTA Collection). These environments are represented by: Italy15 and Italy16, related to IOGC in Italy; Morocco15 and Morocco16, related to WOGB-INRA in Morocco; Spain15 and Spain16, correspond to WOGB-IFAPA Spain; Lebanon15 and Lebanon16, belong to OC-LARI Lebanon and Argentina16 related to OCC-INTA, Argentina (Supplementary Table S7). Each collection contributed a different number of cultivars, based on the available genotypes, the economic and ecological importance and the coexistence of the same cultivars in multiple collections. Because of these criteria, the following cultivars were provided by each collection: 57 from WOGB-IFAPA Spain, 65 from WOGB-INRA Morocco, 63 from IOGC Italy, 33 from OC-LARI Lebanon and 12 from OCC-INTA Argentina. The plant material under study included a total of 408 accessions belonging to 113 olive cultivars originating from 16 different countries (Supplementary Table S4). The genetic identity of the selected cultivars was verified through a comparison of each molecular profile based on a revision of all olive collections involved in the European MSCA Before project (data under publication) and by comparison with previously published data from the main olive collections and databases24,92,93. A total of 816 trees were sampled, each accession being represented by two trees for each environment. Fourteen cultivars were in common between IOGC, WOGB-INRA and WOGB-IFAPA germplasm collections.
Two kilograms of fruits were harvested from each of the two selected trees. The fruits were randomly chosen around the canopy and promptly transferred to the laboratory. From each sample, 25 g of fruits were weighed before and after fruit drying for the fresh weight (FrFW) and fruit moisture (FrM), all others were conserved at −20 °C. The harvesting time in the Mediterranean countries was set in November, as the usual harvesting time in this hemisphere, while in Argentina fruits were collected in May.
Measuring oil content and fatty acids profiling
Three sub-samples of around 25 g of fruits were randomly selected to measure FrFW. They were dried in a forced-air oven at 105 °C for 42 h to ensure dehydration and to determine FrM. The same samples have been used to measure the oil content using an NMR Fat Analyzer Bruker Series NMS 100 Minispec (Bruker Optik GmbH, Ettlingen, Germany). The results were expressed as a percentage of dry fruit weight (OCFrDW). The samples were prepared through the same protocol in each collection and all the NMR analysis was performed in one laboratory.
FAs composition was analyzed by FAs methylation of fruit flesh (fruit epicarp and mesocarp)94 with minor changes. 50–100 mg of the flesh were placed in a reaction tube. The methylation solution was prepared by methanol, toluene, 2,2-dimethoxypropane and sulfuric acid in a 39:20:5:2 proportion. In each reaction tube, 4 ml of the methylation solution and 2 ml of heptane were added. Tubes were then transferred in a water bath for two hours to 80 °C when solution temperature reached to the room temperature, 1.5 ml of supernatant were transferred to the gas-chromatograph tube. Separation of fatty acid methyl esters was carried out by Gas–Liquid Chromatography (GLC) with a Split injector and flame ionization detector, using similar equipment and conditions in the different laboratories involved in the work. Fatty acids monitored in this study include palmitic acid (C16:0), oleic acid (C18:1) and linoleic acid (C18:2) expressed as a percentage of total FAs and oleic/(linoleic + palmitic) acids ratio (OLP).
Statistical analysis
Statistical descriptive analyses of the different traits were performed for one balanced and for the whole unbalanced datasets. The balanced dataset includes 14 common cultivars available in the three collections IOGC, WOGB-INRA and WOGB-IFAPA located in Italy, Morocco and Spain, respectively and two seasons (six environments). For these cultivars, variability for seven traits was calculated through Violin Plot Statlet (StatGraphics Centurion, www.statgraphics.com).
The quantitative estimators of phenotypic plasticity95,96, were calculated in two simplified approaches as follows; 1) The environmental effect on trait plasticity in a common set of cultivars was calculated through the coefficient of variation for each trait in each environment (CVtrait); 2) The genotype effect on trait plasticity in a common set of cultivars was calculated through the coefficient of variation over the environments (calculated as standard deviation of means/mean of means, CVm).
The complex effect of genotype, environment and their interaction on trait plasticity of all studied cultivars was carried out on the unbalanced dataset, including all 113 genotypes from five collections and two seasons (nine environments). Trait variation in each environment, as well as overall environments, was calculated as previously described.
Variance components were then estimated according to the statistical model:
where Pijk was the phenotypic value of the k tree of the i genotype in the j environment; µ the overall mean of the progeny; Gi a random effect contributed by the i genotype; Ej a random effect of the j environment; (G × E)ij the interaction between the i genotype and the j environment; and εijk was the random residual error effect.
From this model, variance components among genotypes (σ²G), among environments (σ²E), associated with the G × E interaction (σ²GE), and residual error effect for the measured samples (σ²ε), were obtained. Broad-sense heritability (H²) for all evaluated traits was estimated as the ratio between genotypic and phenotypic variances: σ²G/(σ²G + σ²GE + σ²ε). Best linear unbiased prediction (BLUP) values for genotypes and environments were also estimated from these models. Analyses were performed using R version 3.5.0 software, with REML estimation method under lme4 package for developing mixed linear models (R Core Team, 2018).
The effect of temperature and thermal time on trait variation
Climate data were registered in each collection site along the years 2015 and 2016 when fruits were collected. Among climate variables, temperature data were selected to test their effect on phenotypic plasticity of the functional traits under analysis. Daily average maximum and average minimum temperatures, as well as thermal amplitude, were calculated from hourly data for each site. In this case, data on a new environment (Argentina15) has been included, being 10 the total number of environments under study.
To calculate the accumulation of thermal time in each environment for the 14 common cultivars, linear or bilinear functions were fitted to the relationships between three main fatty acids (C18:1, C18:2 and C16:0), OCFrDW, FrM, FrFW and OLP with thermal time (TT °C × day, from 7 °C to 40 °C). Thermal time was registered from full flowering time to the harvesting time, using the single sine, horizontal cut-off method88,97. Five environments were considered in this case as Spain15 was excluded from the analysis due to missing flowering time data. Pearson correlation coefficient was used to analyze the correlation between climate data (Max, Min, and amplitude temperatures) and average values of the studied traits in each environment.
Supplementary information
Acknowledgements
The research was supported by the European Union’s Horizon 2020 Research and Innovation Program Marie Sklodowska-Curie - Before Project (Grant Agreement No 645595). Special thanks to Ghina Jebbawi and Ghinwa Al Hawi from LARI – Lebanon; INTA, PIO CONICET- SECITI, CONICET, Secretaría de Ciencia, Tecnología e Innovación del Gobierno de San Juan and also to the Libero Consorzio Comunale of Enna, Sicily, for the support provided to these activities.
Author contributions
S.M., R.R., M.B., L.B. and L.L. contributed substantially to the conception and design of the work; L.L., R.R., L.B. and M.B. the acquisition of the work; S.M., R.R., A.M., M.R., R.M., M.T., P.P., V.S., V.M., S.A., F.D., H.Y., N.A., C.C., H.Z., A.A., A.B. and L.L. performed all the biochemical and morphological analysis of the work; S.M., R.R., L.B., R.M. and L.L. drafting the work; S.M., R.R., A.M., M.R., R.M., M.T., P.P., D.M., A.B., M.B., L.B. and L.L. final approval of the version to be published.
Data availability
All information about protocols, materials, and methods described in this manuscript are sufficient to replicate the research. Moreover, we are available to share or give new information to the editor and reviewers, if necessary.
Competing interests
The authors declare no competing interests.
Footnotes
Publisher’s note Springer Nature remains neutral with regard to jurisdictional claims in published maps and institutional affiliations.
Supplementary information
is available for this paper at 10.1038/s41598-019-53169-3.
References
- 1.Rondanini DP, Castro DN, Searles PS, Rousseaux MC. Fatty acid profiles of varietal virgin olive oils (Olea europaea L.) from mature orchards in warm arid valleys of Northwestern Argentina (La Rioja) Grasas y aceites. 2011;62:399–409. doi: 10.3989/gya.125110. [DOI] [Google Scholar]
- 2.Oteros J, et al. Modelling olive phenological response to weather and topography. Agric, Ecosyst & Environ. 2013;179:62–68. doi: 10.1016/j.agee.2013.07.008. [DOI] [Google Scholar]
- 3.Torres M, et al. Olive cultivation in the southern hemisphere: flowering, water requirements and oil quality responses to new crop environments. Front. Plant Sci. 2017;8:1830. doi: 10.3389/fpls.2017.01830. [DOI] [PMC free article] [PubMed] [Google Scholar]
- 4.Moriondo M, et al. Olive trees as bio-indicators of climate evolution in the Mediterranean Basin. Glob. Ecol. Biogeogr. 2013;22:818–833. doi: 10.1111/geb.12061. [DOI] [Google Scholar]
- 5.Valladares F, et al. The effects of phenotypic plasticity and local adaptation on forecasts of species range shifts under climate change. Ecol Lett. 2014;17:1351–1364. doi: 10.1111/ele.12348. [DOI] [PubMed] [Google Scholar]
- 6.Gabaldón-Leal C, et al. Impact of changes in mean and extreme temperatures caused by climate change on olive flowering in southern Spain. Int. J. Climatol. 2017;37:940–957. doi: 10.1002/joc.5048. [DOI] [Google Scholar]
- 7.Ronchail J, et al. Adaptability of Mediterranean agricultural systems to climate change: the example of the Sierra Magina olive-growing region (Andalusia, Spain). Part II: the future. Weather, Climate, and Society. 2014;6:451–467. doi: 10.1175/WCAS-D-12-00045.1. [DOI] [Google Scholar]
- 8.García GA, Dreccer MF, Miralles DJ, Serrago RA. High night temperatures during grain number determination reduce wheat and barley grain yield: a field study. Glob Chang Biol. 2015;21:4153–4164. doi: 10.1111/gcb.13009. [DOI] [PubMed] [Google Scholar]
- 9.Grogan SM, et al. Phenotypic plasticity of winter wheat heading date and grain yield across the US Great Plains. Crop Sci. 2016;56:2223–2236. doi: 10.2135/cropsci2015.06.0357. [DOI] [Google Scholar]
- 10.McKown AD, et al. Geographical and environmental gradients shape phenotypic trait variation and genetic structure in Populus trichocarpa. New Phytol. 2014;201:1263–1276. doi: 10.1111/nph.12601. [DOI] [PubMed] [Google Scholar]
- 11.Bradshaw AD. Evolutionary significance of phenotypic plasticity in plants. Adv Genet. 1965;13:115–155. doi: 10.1016/S0065-2660(08)60048-6. [DOI] [Google Scholar]
- 12.Callahan HS, Pigliucci M, Schlichting CD. Developmental phenotypic plasticity: where ecology and evolution meet molecular biology. Bioessays. 1997;19:519–525. doi: 10.1002/bies.950190611. [DOI] [PubMed] [Google Scholar]
- 13.Ghalambor CK, McKay JK, Carroll SP, Reznick DN. Adaptive versus non-adaptive phenotypic plasticity and the potential for contemporary adaptation in new environments. Funct Ecol. 2007;21:394–407. doi: 10.1111/j.1365-2435.2007.01283.x. [DOI] [Google Scholar]
- 14.Peltonen-Sainio P, Jauhiainen L, Sadras VO. Phenotypic plasticity of yield and agronomic traits in cereals and rapeseed at high latitudes. Field Crops Res. 2011;124:261–269. doi: 10.1016/j.fcr.2011.06.016. [DOI] [Google Scholar]
- 15.Chevin L-M, Gallet R, Gomulkiewicz R, Holt RD, Fellous S. Phenotypic plasticity in evolutionary rescue experiments. Philosophical Transactions of the Royal Society of London B: Biological Sciences. 2013;368:20120089. doi: 10.1098/rstb.2012.0089. [DOI] [PMC free article] [PubMed] [Google Scholar]
- 16.Matesanz S, Gianoli E, Valladares F. Global change and the evolution of phenotypic plasticity in plants: Global change and plasticity. Ann. N. Y. Acad. Sci. 2010;1206:35–55. doi: 10.1111/j.1749-6632.2010.05704.x. [DOI] [PubMed] [Google Scholar]
- 17.Sadras VO, Trentacoste ER. Phenotypic plasticity of stem water potential correlates with crop load in horticultural trees. Tree Physiol. 2011;31:494–499. doi: 10.1093/treephys/tpr043. [DOI] [PubMed] [Google Scholar]
- 18.Trentacoste ER, Puertas CM. Preliminary characterization and morpho-agronomic evaluation of the olive germplasm collection of the Mendoza province (Argentina) Euphytica. 2011;177:99–109. doi: 10.1007/s10681-010-0270-4. [DOI] [Google Scholar]
- 19.Chin AR, Sillett SC. Phenotypic plasticity of leaves enhances water-stress tolerance and promotes hydraulic conductivity in a tall conifer. Am J Bot. 2016;103:796–807. doi: 10.3732/ajb.1600110. [DOI] [PubMed] [Google Scholar]
- 20.McLean EH, et al. Plasticity of functional traits varies clinally along a rainfall gradient in Eucalyptus tricarpa. Plant Cell Environ. 2014;37:1440–1451. doi: 10.1111/pce.12251. [DOI] [PubMed] [Google Scholar]
- 21.Richter S, et al. Phenotypic plasticity facilitates resistance to climate change in a highly variable environment. Oecologia. 2012;169:269–279. doi: 10.1007/s00442-011-2191-x. [DOI] [PubMed] [Google Scholar]
- 22.Lahrouni M, El Abbassi A, El Messoussi S. Olive tree growth dynamics under semi-arid conditions of AlHaouz region in Morocco. J Mater Environ Sci. 2015;6:2428–2436. [Google Scholar]
- 23.García-Inza GP, Castro DN, Hall AJ, Rousseaux MC. Responses to temperature of fruit dry weight, oil concentration, and oil fatty acid composition in olive (Olea europaea L. var.‘Arauco’) Eur J Agron. 2014;54:107–115. doi: 10.1016/j.eja.2013.12.005. [DOI] [Google Scholar]
- 24.Mousavi S, et al. The eastern part of the Fertile Crescent concealed an unexpected route of olive (Olea europaea L.) differentiation. Ann. Bot. 2017;119:1305–1318. doi: 10.1093/aob/mcx027. [DOI] [PMC free article] [PubMed] [Google Scholar]
- 25.Manai-Djebali H, et al. Chemical profiles of five minor olive oil varieties grown in central Tunisia. J Food Compost Anal. 2012;27:109–119. doi: 10.1016/j.jfca.2012.04.010. [DOI] [Google Scholar]
- 26.Lazović B, et al. Characterizing ancient and local olive germplasm from Montenegro. Sci Hort. 2016;209:117–123. doi: 10.1016/j.scienta.2016.06.022. [DOI] [Google Scholar]
- 27.Sakar E, Unver H, Ercisli S. Genetic diversity among historical olive (Olea europaea L.) genotypes from southern Anatolia based on SSR markers. Biochem Genet. 2016;54:842–853. doi: 10.1007/s10528-016-9761-x. [DOI] [PubMed] [Google Scholar]
- 28.Belaj, A. et al. Usefulness of a New Large Set of High Throughput EST-SNP Markers as a Tool for Olive Germplasm Collection Management. Front. Plant Sci. 9 (2018). [DOI] [PMC free article] [PubMed]
- 29.Chalak L, et al. Extent of the genetic diversity in Lebanese olive (Olea europaea L.) trees: a mixture of an ancient germplasm with recently introduced varieties. Genet Resour Crop Evol. 2015;62:621–633. doi: 10.1007/s10722-014-0187-1. [DOI] [Google Scholar]
- 30.Kourgialas NN, Anyfanti I, Karatzas GP, Dokou Z. An integrated method for assessing drought prone areas-Water efficiency practices for a climate resilient Mediterranean agriculture. Sci Total Environ. 2018;625:1290–1300. doi: 10.1016/j.scitotenv.2018.01.051. [DOI] [PubMed] [Google Scholar]
- 31.Lorite IJ, et al. Evaluation of olive response and adaptation strategies to climate change under semi-arid conditions. Agric Water Manag. 2018;204:247–261. doi: 10.1016/j.agwat.2018.04.008. [DOI] [Google Scholar]
- 32.Kavvadias, V. et al. Effects of carbon inputs on chemical and microbial properties of soil in irrigated and rainfed olive groves. In Soil Management and Climate Change 137–150 (Elsevier, 2018).
- 33.López-Bernal, Á. et al. OliveCan: a process-based model of development, growth and yield of olive orchards. Front. Plant Sci. 9 (2018). [DOI] [PMC free article] [PubMed]
- 34.Morales A, Leffelaar PA, Testi L, Orgaz F, Villalobos FJ. A dynamic model of potential growth of olive (Olea europaea L.) orchards. Eur J Agron. 2016;74:93–102. doi: 10.1016/j.eja.2015.12.006. [DOI] [Google Scholar]
- 35.Cañellas-Boltà N, Riera-Mora S, Orengo HA, Livarda A, Knappett C. Human management and landscape changes at Palaikastro (Eastern Crete) from the Late Neolithic to the Early Minoan period. Quat Sci Rev. 2018;183:59–75. doi: 10.1016/j.quascirev.2018.01.010. [DOI] [Google Scholar]
- 36.Sorrel P, Mathis M. Mid-to late-Holocene coastal vegetation patterns in Northern Levant (Tell Sukas, Syria): Olive tree cultivation history and climatic change. Holocene. 2016;26:858–873. doi: 10.1177/0959683615622555. [DOI] [Google Scholar]
- 37.Rondanini DP, Castro DN, Searles PS, Rousseaux MC. Contrasting patterns of fatty acid composition and oil accumulation during fruit growth in several olive varieties and locations in a non-Mediterranean region. Eur J Agron. 2014;52:237–246. doi: 10.1016/j.eja.2013.09.002. [DOI] [Google Scholar]
- 38.Esmaeili A, Shaykhmoradi F, Naseri R. Comparison of oil content and fatty acid composition of native olive genotypes in different region of Liam, Iran. Int. j. agric. crop sci. 2012;4:434–438. [Google Scholar]
- 39.Zaied YB, Zouabi O. Impacts of climate change on Tunisian olive oil output. Clim. Change. 2016;139:535–549. doi: 10.1007/s10584-016-1801-3. [DOI] [Google Scholar]
- 40.Orlandi F, Bonofiglio T, Romano B, Fornaciari M. Qualitative and quantitative aspects of olive production in relation to climate in southern Italy. Sci Hort. 2012;138:151–158. doi: 10.1016/j.scienta.2012.02.029. [DOI] [Google Scholar]
- 41.León L, Arias-Calderón R, De La Rosa R, Khadari B, Costes E. Optimal spatial and temporal replications for reducing environmental variation for oil content components and fruit morphology traits in olive breeding. Euphytica. 2016;207:675–684. doi: 10.1007/s10681-015-1569-y. [DOI] [Google Scholar]
- 42.de la Rosa R, Arias-Calderón R, Velasco L, León L. Early selection for oil quality components in olive breeding progenies. Eur J Lipid Sci Technol. 2016;118:1160–1167. doi: 10.1002/ejlt.201500425. [DOI] [Google Scholar]
- 43.Hernández ML, et al. Mapping quantitative trait loci controlling fatty acid composition in olive. Euphytica. 2017;213:7. doi: 10.1007/s10681-016-1802-3. [DOI] [Google Scholar]
- 44.Dabbou S, et al. Chemical composition of virgin olive oils from Koroneiki cultivar grown in Tunisia with regard to fruit ripening and irrigation regimes. J. Food Sci. Technol. 2011;46:577–585. doi: 10.1111/j.1365-2621.2010.02520.x. [DOI] [Google Scholar]
- 45.Ranalli A, et al. Acylglycerol and fatty acid components of pulp, seed, and whole olive fruit oils. Their use to characterize fruit variety by chemometrics. J Agric Food Chem. 2002;50:3775–3779. doi: 10.1021/jf011506j. [DOI] [PubMed] [Google Scholar]
- 46.Kiritsakis, A. & Shahidi, F. 10 Olive oil quality and its relation to the functional bioactives and their properties. Olives and Olive Oil as Functional Foods: Bioactivity, Chemistry and Processing 205 (2017).
- 47.Connor DJ, Fereres E. The physiology of adaptation and yield expression in olive. Hortic Rev. 2005;31:155–229. [Google Scholar]
- 48.García-Inza GP, Castro DN, Hall AJ, Rousseaux MC. Opposite oleic acid responses to temperature in oils from the seed and mesocarp of the olive fruit. Eur J Agron. 2016;76:138–147. doi: 10.1016/j.eja.2016.03.003. [DOI] [Google Scholar]
- 49.Bulotta S, et al. Beneficial effects of the olive oil phenolic components oleuropein and hydroxytyrosol: focus on protection against cardiovascular and metabolic diseases. J Transl Med. 2014;12:219. doi: 10.1186/s12967-014-0219-9. [DOI] [PMC free article] [PubMed] [Google Scholar]
- 50.O’Quin, J. B. et al. Temperature-sensitive, post-translational regulation of plant omega-3 fatty acid desaturases is mediated by the ER-associated degradation pathway. J Biol Chem. jbc–M110 (2010). [DOI] [PMC free article] [PubMed]
- 51.Hernández ML, Padilla MN, Sicardo MD, Mancha M, Martínez-Rivas JM. Effect of different environmental stresses on the expression of oleate desaturase genes and fatty acid composition in olive fruit. Phytochemistry. 2011;72:178–187. doi: 10.1016/j.phytochem.2010.11.026. [DOI] [PubMed] [Google Scholar]
- 52.Román Á, et al. Contribution of the different omega-3 fatty acid desaturase genes to the cold response in soybean. J. Exp. Bot. 2012;63:4973–4982. doi: 10.1093/jxb/ers174. [DOI] [PMC free article] [PubMed] [Google Scholar]
- 53.Borges TH, et al. Characterization of Arbequina virgin olive oils produced in different regions of Brazil and Spain: Physicochemical properties, oxidative stability and fatty acid profile. Food Chem. 2017;215:454–462. doi: 10.1016/j.foodchem.2016.07.162. [DOI] [PubMed] [Google Scholar]
- 54.García-González DL, Romero N, Aparicio R. Comparative study of virgin olive oil quality from single varieties cultivated in Chile and Spain. J Agric Food Chem. 2010;58:12899–12905. doi: 10.1021/jf1031313. [DOI] [PubMed] [Google Scholar]
- 55.Di Vaio C, Nocerino S, Paduano A, Sacchi R. Influence of some environmental factors on drupe maturation and olive oil composition: Influence of environmental factors on olive oil composition. J. Sci. Food Agric. 2013;93:1134–1139. doi: 10.1002/jsfa.5863. [DOI] [PubMed] [Google Scholar]
- 56.Dag A, Harlev G, Lavee S, Zipori I, Kerem Z. Optimizing olive harvest time under hot climatic conditions of Jordan Valley, Israel. Eur J Lipid Sci Technol. 2014;116:169–176. doi: 10.1002/ejlt.201300211. [DOI] [Google Scholar]
- 57.García-Inza GP, Hall AJ, Rousseaux MC. Proportion of oleic acid in olive oil as influenced by the dimensions of the daily temperature oscillation. Sci Hort. 2018;227:305–312. doi: 10.1016/j.scienta.2017.09.030. [DOI] [Google Scholar]
- 58.Weber A, Kolb A. Differences in heritable trait variation among populations of varying size in the perennial herb Phyteuma spicatum. Conserv Genet. 2014;15:1329–1337. doi: 10.1007/s10592-014-0620-1. [DOI] [Google Scholar]
- 59.Johnson MT, Agrawal AA, Maron JL, Salminen J-P. Heritability, covariation and natural selection on 24 traits of common evening primrose (Oenothera biennis) from a field experiment. J. Evol. Biol. 2009;22:1295–1307. doi: 10.1111/j.1420-9101.2009.01747.x. [DOI] [PubMed] [Google Scholar]
- 60.Jump AS, Penuelas J. Running to stand still: adaptation and the response of plants to rapid climate change. Ecol Lett. 2005;8:1010–1020. doi: 10.1111/j.1461-0248.2005.00796.x. [DOI] [PubMed] [Google Scholar]
- 61.Moran EV, Hartig F, Bell DM. Intraspecific trait variation across scales: implications for understanding global change responses. Glob Chang Biol. 2016;22:137–150. doi: 10.1111/gcb.13000. [DOI] [PubMed] [Google Scholar]
- 62.Demir I, Tosun M. Research on stability statistical and stability of wheat. Journal of Ege University Agricultural Faculty. 1991;28:7–24. [Google Scholar]
- 63.Taïbi K, del Campo AD, Aguado A, Mulet JM. The effect of genotype by environment interaction, phenotypic plasticity and adaptation on Pinus halepensis reforestation establishment under expected climate drifts. Ecol Eng. 2015;84:218–228. doi: 10.1016/j.ecoleng.2015.09.005. [DOI] [Google Scholar]
- 64.Li P, et al. Use of genotype-environment interactions to elucidate the pattern of maize root plasticity to nitrogen deficiency. J. Integr. Plant Biol. 2016;58:242–253. doi: 10.1111/jipb.12384. [DOI] [PubMed] [Google Scholar]
- 65.Chloupek O, Hrstkova P. Adaptation of crops to environment. Theor Appl Genet. 2005;111:1316–1321. doi: 10.1007/s00122-005-0060-x. [DOI] [PubMed] [Google Scholar]
- 66.Sanyal A, Linder CR. Plasticity and constraints on fatty acid composition in the phospholipids and triacylglycerols of Arabidopsis accessions grown at different temperatures. BMC Plant Biol. 2013;13:63. doi: 10.1186/1471-2229-13-63. [DOI] [PMC free article] [PubMed] [Google Scholar]
- 67.Aytac F, Arslanoglu. S. Determination of stability and genotype x environment interactions of some agronomic properties in the different soybean (Glycine max.(L) Merrill) cultivars. Bulg J Agric Sci. 2010;16:181–195. [Google Scholar]
- 68.Koo YB, Yeo JK, Woo KS, Kim TS. Selection of superior clones by stability analysis of growth performance in Populus davidiana Dode at age 12. Silvae Genetica. 2007;56:93–101. doi: 10.1515/sg-2007-0015. [DOI] [Google Scholar]
- 69.Baltunis BS, Gapare WJ, Wu HX. Genetic parameters and genotype by environment interaction in radiata pine for growth and wood quality traits in Australia. Silvae Genetica. 2009;59:113–124. doi: 10.1515/sg-2010-0014. [DOI] [Google Scholar]
- 70.King GJ, et al. Quantitative genetic analysis and comparison of physical and sensory descriptors relating to fruit flesh firmness in apple (Malus pumila Mill.) Theor Appl Genet. 2000;100:1074–1084. doi: 10.1007/s001220051389. [DOI] [Google Scholar]
- 71.Lauri P-E, et al. Genetic variability and phenotypic plasticity of apple morphological responses to soil water restriction in relation with leaf functions andstem xylem conductivity. Trees. 2016;30:1893–1908. doi: 10.1007/s00468-016-1408-3. [DOI] [Google Scholar]
- 72.Curnel Y, Jacques D, Nanson A. First multisite clonal test of wild cherry (Prunus avium L.) in Belgium. Silvae Genetica. 2003;52:45–51. [Google Scholar]
- 73.Finn CE, Hancock JF, Mackey T, Serce S. Genotype\times environment interactions in highbush blueberry (Vaccinium sp. L.) families grown in Michigan and Oregon. J Am Soc Hortic Sci. 2003;128:196–200. doi: 10.21273/JASHS.128.2.0196. [DOI] [Google Scholar]
- 74.Ben Sadok, I. et al. Genetic determinism of the vegetative and reproductive traits in an F1 olive tree progeny. Tree Genet Genomes. 1–17 (2013).
- 75.León LDL, Rosa R, Velasco L, Belaj A. Using Wild Olives in Breeding Programs: Implications on Oil Quality Composition. Front. Plant Sci. 2018;9:232. doi: 10.3389/fpls.2018.00232. [DOI] [PMC free article] [PubMed] [Google Scholar]
- 76.Unver T, et al. Genome of wild olive and the evolution of oil biosynthesis. Proc. Natl. Acad. Sci. 2017;114:E9413–E9422. doi: 10.1073/pnas.1708621114. [DOI] [PMC free article] [PubMed] [Google Scholar]
- 77.Nicotra AB, et al. Adaptive plasticity and epigenetic variation in response to warming in an Alpine plant. Ecol. Evol. 2015;5:634–647. doi: 10.1002/ece3.1329. [DOI] [PMC free article] [PubMed] [Google Scholar]
- 78.Fischer, R. A., Byerlee, D. & Edmeades, G. Crop yields and global food security. ACIAR: Canberra, ACT 8–11 (2014).
- 79.Gage JL, et al. The effect of artificial selection on phenotypic plasticity in maize. Nat. Commun. 2017;8:1348. doi: 10.1038/s41467-017-01450-2. [DOI] [PMC free article] [PubMed] [Google Scholar]
- 80.Jonas E, de Koning D-J. Does genomic selection have a future in plant breeding? Trends Biotechnol. 2013;31:497–504. doi: 10.1016/j.tibtech.2013.06.003. [DOI] [PubMed] [Google Scholar]
- 81.Cultrera N, et al. High Levels of Variation Within Gene Sequences of Olea europaea L. Front Plant Sci. 2018;9:1932. doi: 10.3389/fpls.2018.01932. [DOI] [PMC free article] [PubMed] [Google Scholar]
- 82.Navas-Lopez JF, León L, Trentacoste ER, de la Rosa R. Multi-environment evaluation of oil accumulation pattern parameters in olive. Plant Physiol Biochem. 2019;139:485–494. doi: 10.1016/j.plaphy.2019.04.016. [DOI] [PubMed] [Google Scholar]
- 83.Arias-Calderón R, Rouiss H, Rodríguez-Jurado D, De la Rosa R, León L. Variability and heritability of fruit characters in olive progenies from open-pollination. Sci Hort. 2014;169:94–98. doi: 10.1016/j.scienta.2014.02.011. [DOI] [Google Scholar]
- 84.León L, Uceda M, Jiménez A, Martín LM, Rallo L. Variability of fatty acid composition in olive (Olea europaea L.) progenies. Span. J. Agric. 2004;2:353–359. doi: 10.5424/sjar/2004023-89. [DOI] [Google Scholar]
- 85.Servili M, et al. New approaches to virgin olive oil quality, technology, and by-products valorization. Eur J Lipid Sci Technol. 2015;117:1882–1892. doi: 10.1002/ejlt.201500138. [DOI] [Google Scholar]
- 86.Khaleghi E, Arzani K, Moallemi N, Barzegar M. The efficacy of kaolin particle film on oil quality indices of olive trees (Olea europaea L.) cv ‘Zard’grown under warm and semi-arid region of Iran. Food Chem. 2015;166:35–41. doi: 10.1016/j.foodchem.2014.06.006. [DOI] [PubMed] [Google Scholar]
- 87.Mousavi S, et al. Biochemical and molecular profiling of unknown olive genotypes from central Italy: determination of major and minor components. Eur Food Res Technol. 2019;245:83–94. doi: 10.1007/s00217-018-3142-0. [DOI] [Google Scholar]
- 88.Bodoira R, et al. Dynamics of Fatty Acids, Tocopherols and Phenolic Compounds Biogenesis During Olive (Olea europaea L.) Fruit Ontogeny. J Am Oil Chem Soc. 2016;93:1289–1299. doi: 10.1007/s11746-016-2877-7. [DOI] [Google Scholar]
- 89.Lombardo, N. et al. Influence of growing season temperatures in the fatty acids (FAs) of triacilglycerols (TAGs) composition in Italian cultivars of Olea europaea. Adv Hortic Sci. 49–53 (2008).
- 90.Nicotra AB, Davidson A. Adaptive phenotypic plasticity and plant water use. Funct. Plant Biol. 2010;37:117–127. doi: 10.1071/FP09139. [DOI] [Google Scholar]
- 91.Gratani, L. Plant phenotypic plasticity in response to environmental factors. Adv. Bot. 2014, (2014).
- 92.Haouane H, et al. Genetic structure and core collection of the World Olive Germplasm Bank of Marrakech: towards the optimised management and use of Mediterranean olive genetic resources. Genetica. 2011;139:1083–1094. doi: 10.1007/s10709-011-9608-7. [DOI] [PMC free article] [PubMed] [Google Scholar]
- 93.Trujillo I, et al. Identification of the Worldwide Olive Germplasm Bank of Córdoba (Spain) using SSR and morphological markers. Tree Genet Genomes. 2014;10:141–155. doi: 10.1007/s11295-013-0671-3. [DOI] [Google Scholar]
- 94.Garcés R, Mancha M. One-step lipid extraction and fatty acid methyl esters preparation from fresh plant tissues. Anal Biochem. 1993;211:139–143. doi: 10.1006/abio.1993.1244. [DOI] [PubMed] [Google Scholar]
- 95.Valladares F, Sanchez-Gomez D, Zavala MA. Quantitative estimation of phenotypic plasticity: bridging the gap between the evolutionary concept and its ecological applications. J Ecol. 2006;94:1103–1116. doi: 10.1111/j.1365-2745.2006.01176.x. [DOI] [Google Scholar]
- 96.Van Kleunen M, Fischer M. Constraints on the evolution of adaptive phenotypic plasticity in plants. New Phytol. 2005;166:49–60. doi: 10.1111/j.1469-8137.2004.01296.x. [DOI] [PubMed] [Google Scholar]
- 97.Aguilera F, et al. Heat accumulation period in the Mediterranean region: phenological response of the olive in different climate areas (Spain, Italy and Tunisia) Int. J. Biometeorol. 2014;58:867–876. doi: 10.1007/s00484-013-0666-7. [DOI] [PubMed] [Google Scholar]
Associated Data
This section collects any data citations, data availability statements, or supplementary materials included in this article.
Supplementary Materials
Data Availability Statement
All information about protocols, materials, and methods described in this manuscript are sufficient to replicate the research. Moreover, we are available to share or give new information to the editor and reviewers, if necessary.