

Abstract
Objectives:
To examine the association between the quality of care delivered to nursing home (NH) residents with and without a serious mental illness (SMI) and the proportion of nursing home residents with SMI.
Design, Setting, and Participants:
This study, examining 2006–2010 Minimum Data Set (MDS) assessments linked with Medicare claims and data on nursing homes from the Online Survey, Certification, and Reporting (OSCAR) database, used an instrumental variable approach to account for potential selection of patients between high- and low-SMI facilities. Relative distance to the nearest high-SMI facility was the instrument. Cohorts of interest were 58,571 Medicare nursing home residents with an SMI diagnosis (i.e., schizophrenia or bipolar disorder) and 558,699 individuals without an SMI diagnosis who were admitted to the same nursing homes.
Exposure:
Admission to a high-SMI facility, defined as at least 10% of a nursing home’s population having an SMI diagnosis.
Measurements:
Outcomes were nursing home quality measures: 1) use of physical restraints; 2) any hospitalization in the last 3 months; 3) use of an indwelling catheter; 4) use of a feeding tube; 5) presence of pressure ulcer(s).
Results:
For individuals with SMI, admission to a high-SMI facility was associated with a 3.7 percentage point (95% confidence interval (CI), 1.4, 6.0) increase in the probability of feeding tube use relative to individuals admitted to a low-SMI facility. Among individuals without SMI, admission to a high-SMI facility was associated with a 1.7 percentage point increase in the probability of catheter use (95 CI, 0.03, 3.47), a 3.8 percentage point increase in the probability of being hospitalized (95% CI, 2.16, 5.44) and a 2.1 percentage point increase in the probability of having a feeding tube (95% CI, 0.43, 3.74).
Conclusion:
Admission to nursing homes with high concentrations of residents with SMI is associated with worse outcomes for both residents with and without SMI.
Keywords: nursing homes, quality of care, behavioral health
Introduction
The deinstitutionalization of care for the mentally ill has led to steady declines in the availability of inpatient psychiatric beds and the number of patients treated in this setting since the 1950s.1–3 Despite this downsizing of inpatient care, sufficient resources have often not been available to support individuals with mental illness in a community setting. As a result, nursing homes have become de facto mental health institutions for older adults.4 It is estimated that the annual number of individuals with mental illness residing in nursing homes is roughly 10 times the number treated in psychiatric hospitals.5 This form of care delivery appears to be particularly pronounced among US Veterans admitted to Veterans Affairs nursing homes (called Community Living Centers), as more than a third of residents in these facilities are estimated to have a mental illness.6
This shift in care setting has raised important questions about the quality of care delivered to individuals with mental illness in nursing homes7,8 and spurred legislative action to ensure that facilities could meet residents’ mental health needs.9 Yet, evidence indicates that older adults with mental illness, particularly those with Serious Mental Illness (SMI) diagnoses of bipolar disorder or schizophrenia, frequently receive substandard care along a number of dimensions and are often concentrated in lower-quality nursing homes.10–13 The cause of this clustering is unknown, but a likely explanation is that current Medicaid and Medicare risk-adjusted nursing home payment models do not adequately adjust for the additional costs of caring for individuals with mental health needs relative to residents without SMI.14,15 Consequently, nursing home administrators appear to be reluctant to accept these patients,16 particularly when more profitable, less challenging patients are available. Because better quality facilities likely have greater choice over who they admit, individuals with SMI may face a limited set of nursing home options, resulting in a small number of facilities having disproportionately large populations of patients with SMI.
It is unclear how the existence of high-SMI nursing homes should be viewed. On the one hand, caring for patients with SMI is resource intensive, and having large numbers of these patients in a facility may strain available resources, potentially resulting in worse quality of care for both patients with and without SMI. On the other hand, a sizeable literature demonstrates that experience or specialization in a particular type of clinical care can result in better outcomes in a variety of health care settings, including nursing homes.17–21 It is possible that facilities with greater SMI shares develop expertise in caring for this population and/or invest in additional staffing or resources, like telehealth capabilities with a psychiatrist, that improve their ability to meet residents’ mental health needs.
Few studies have examined the effect of SMI concentration on nursing home resident outcomes. Kim and colleagues provide descriptive evidence of a positive associate between SMI concentration in Veterans Affairs nursing homes and the incidence of poor quality outcomes, including untreated depression, lack of a toileting plan, and the use of physical restraints.6 Rahman and colleagues, using a facility-level analysis, find that increases in the proportion of patients with SMI in a facility was associated with higher rates of hospitalization for residents without SMI and lower staffing levels and concentrations of registered nurses. Although consistent with the notion that greater SMI shares may stress facility resources and divert them away from patients without mental health needs, the lack of individual-level data presents two important limitations to this earlier work. First, this study was unable to look at a number of important nursing-home-specific outcomes for residents with and without SMI. Second, this study was not able to account, at the resident level, for individuals’ selection of a nursing home, meaning it is possible that their results partly reflect the different clinical complexity and/or needs of residents who are admitted to high- as compared to low-SMI facilities.
The purpose of this study is to evaluate, using resident-level data, the association between admission to a nursing home with a high proportion of SMI residents on the quality of care delivered to individuals with and without SMI.
Methods
Data and Study Sample
The primary data source was the Minimum Data Set (MDS) 2.0 for years 2005–2010- a comprehensive assessment of nursing home residents performed at admission and updated quarterly.22 This data was linked with the Medicare Provider and Analysis Review (MedPAR) file to obtain information on hospitalizations. Nursing home information came from the Online Survey, Certification, and Reporting (OSCAR) database- a regularly administered survey of all certified facilities in the US. Information about resident’s home ZIP-code was obtained from 2010 census data and the 2010–2015 American Community Survey.
The primary cohort of interest was fee-for-service Medicare beneficiaries who were newly admitted to a nursing home between 2006 and 2010 with an SMI diagnosis of bipolar disorder or schizophrenia at the time of admission. We limited our cohort to long-stay residents at facilities with at least 20 beds. A secondary cohort of interest was Medicare beneficiaries without an SMI diagnosis who were newly admitted to a nursing homes that admitted at least one individual with SMI in a given year (see Appendix).
Variables
The outcome variables were quality indicators, measured quarterly, which have previously been used to assess nursing home care.18,23,24 When selecting quality outcomes, we prioritized process measures that reflect the way in which care is delivered to residents, as well as measures that may reflect whether nursing homes are able to deliver sufficient staff-intensive direct care. Finally, we also prioritized outcome measures for which patients with SMI have previously been shown to be at increased risk. We divided our measures into two groups: 1) those directly related to the care of individuals with SMI; and 2) general measures of nursing home quality. Direct SMI care measures were the use of physical restraints and hospitalizations. The use of restraints has the potential to worsen resident health,25 and SMI has been shown to increase one’s risk for being restrained in a nursing home.26–28 Likewise, unnecessary hospitalizations increase the risk of an iatrogenic event and may represent strategic nursing home behavior to improve quality scores,29 maximize reimbursement,30 or ease the burden of caring for difficult patients. SMI has been shown to increase the risk of nursing home-to-hospital transfers.31
General quality outcomes included the use of feeding tubes or indwelling urinary catheters, which have been found to pose serious risks to patients without improvements to quality of life,32–35 and the presence of a pressure ulcer (Stage I-IV) at the time of quarterly assessment. These measures may reflect the adequacy of available staff resources to deliver hands-on patient care (e.g., positional changes, toileting schedules, hand feeding).36–39 All outcome measures except hospitalizations were obtained from MDS data. The hospitalization measure was obtained from Medicare claims and captures whether any hospitalization occurred in the 3 months between MDS assessments.
Our primary independent variable was admission to a nursing home with a high concentration of residents with SMI. We defined high SMI as greater than 10% of residents having a diagnosis of bipolar disorder or schizophrenia (see Appendix). This threshold was chosen because we believe SMI concentrations at or above it are likely to alter facilities’ operations in meaningful ways that differentiate them from nursing homes that care for few residents with SMI.
Covariates of interest, obtained at the time of nursing home admission from MDS data or Medicare claims, included age, sex, race/ethnicity, Medicaid status, chronic disease diagnoses, cognitive disease diagnoses, and a measure of cognitive status (see Appendix). We also included ZIP-code level measures of income, education, insurance status, and urbanicity, among others (see Appendix).
Finally, we used the OSCAR database to perform descriptive comparisons between high- and low-SMI facilities. Characteristics of interest included profit status of the nursing home, the percent of residents whose primary source of payment was Medicaid, the average occupancy rate, the total number of available beds, whether the facility was part of chain, and the publicly-reported overall 5-star quality score assigned by the Centers for Medicare and Medicaid Services (CMS).40
Statistical Analysis
A significant challenge to estimating the relationship between SMI concentration and the quality of care is that the facility to which an individual is admitted is not random. Facilities may prefer certain types of residents (e.g., those with lower care needs or higher reimbursement) and nursing home residents likely prefer certain types of facilities (e.g., those with better quality or amenities). This non-random sorting suggests that individuals who are admitted to high-SMI nursing homes may be systematically different from those admitted to low-SMI facilities in ways that affect their risk of the outcome. To account for this selection bias, we use an instrumental variable (IV) analysis.41,42 An IV is a variable that is associated with the exposure (admission to a high-SMI facility), but only affects the outcome (one of the quality measures studied) through the exposure. A classic example of an IV analysis is a randomized controlled trial, in which the randomization process (e.g., “flipping a coin”) serves as the IV – it is associated with the exposure but does not directly affect the outcome. In our analysis the distance to the nearest high-SMI facility relative to the nearest low-SMI facility (differential distance) serves as the IV. Like randomization, we assume that differential distance is associated with admission to a high-SMI facility and that no independent effect on quality exists, other than through its association with admission to a high-SMI facility. Distance is a key determinant of where individuals opt to receive a variety of health services, including nursing home care.18,43–47 In addition, it is unlikely that individuals choose where they live in anticipation of future nursing home needs and preferences, and the relatively old age of most nursing homes suggests that facilities cannot strategically choose their location based on their resident preferences. These dynamics suggest that individuals who live closer to a high-SMI nursing home are more likely to be admitted to this facility-type for reason unrelated to their clinical needs, consistent with the key IV assumptions outlined above.
For each individual in our sample, we calculated a differential distance instrument such that individuals with a negative value lived closest to a high-SMI facility and those with a positive value lived closest to a low-SMI facility (see Appendix). We evaluated the instrument using several approaches, including a first stage linear regression to determine whether differential distance is a significant predictor of being admitted to a high-SMI facility and test the strength of this relationship by determining whether the corresponding F-statistic is at least 10.48 Refer to the appendix for details of additional instrument checks.
We estimated our instrumental variable model using a two-stage least squares linear regression that controls for the resident and geographic controls described above, state and year fixed effects, and a quarterly length-of-stay measure. In all estimation models, we used robust standard errors clustered at the facility level. We reported coefficients from these models and the corresponding percent change from sample means.
Additionally, we examined residents without SMI at admission to estimate the association between SMI concentration and the quality of care for non-SMI residents. We repeat the above analyses in the non-SMI cohort for all five outcomes of interest plus one additional measure- off-label use of antipsychotic medications. Because an SMI diagnosis is one of the few clinical indications for the use of antipsychotics, this measure is not relevant to our primary population of interest, however, its use in the absence of SMI may constitute a sign of substandard care.49
Finally, we assessed whether SMI concentrations have an effect on resident outcomes that is distinct from a facility’s overall quality by repeating our IV analyses among individuals who were admitted to high-quality facilities. High-quality nursing homes are defined as those that score 4 or 5 stars on the 5-star quality measure described above.40 In the event that high proportions of SMI residents merely reflect an existing level of quality provided by a given facility, we would not expect to find differences in outcomes between high- and low-SMI facilities when looking only within highly-quality nursing homes.
Results
The primary study sample consisted of 58,571 individual residents (410,388 resident-quarter observations) and 12,027 unique facilities (29,334 facility-years), 18% of which were designated as having high-SMI concentrations. Significant differences between low- and high-SMI facilities were found for characteristics in Table 1 with one exception: CMS five-star quality scores were similar between the two facility types (2.8 vs. 2.7, P = 0.056) (Table 1).
Table 1-.
Description of Sample Facilities and Patients by Concentration of Residents with Serious Mental Illness
| Low SMI | High SMI | P-Value | |
|---|---|---|---|
| Facility Characteristics | |||
| n (facility-years) | 24,082 | 5,252 | |
| For Profit (%) | 76.2 | 87.5 | <0.001*** |
| Medicaid (%) | 64.3 | 80.3 | <0.001*** |
| Occupancy Rate (mean) | 85.2 | 84.5 | <0.001*** |
| Total Beds (mean) | 131.3 | 126.9 | <0.001*** |
| Chain (%) | 59.4 | 51.3 | <0.001*** |
| Staffing (means) | |||
| Direct care staff hours per patient day | 3.25 | 2.97 | <0.001*** |
| Ratio of RNs | 0.27 | 0.26 | 0.003** |
| 5-Star Rating (mean) | 2.8 | 2.7 | 0.056 |
| Resident Characteristics | |||
| n (person-quarters) | 276,752 | 133,636 | |
| Age (mean) | 70.6 | 61.4 | <0.001*** |
| Dual (%) | 59.2 | 69.8 | <0.001*** |
| White Race (%) | 82.5 | 72.5 | <0.001*** |
| Female (%) | 65.2 | 48.0 | <0.001*** |
| ADL Score (4–18; mean) | 14.7 | 9.1 | <0.001*** |
| # of Chronic Conditions (0–8; mean) | 2.9 | 2.5 | <0.001*** |
| Schizophrenia (%) | 60.0 | 78.1 | <0.001*** |
| Bipolar (%) | 48.1 | 34.0 | <0.001*** |
| Distance to Admitting Nursing Home (km; mean) | 46.2 | 45.4 | 0.293 |
| Differential Distance to Admitting Nursing Home (km; mean) | 8.7 | 1.2 | <0.001*** |
Notes:
Indicates a statistically significant difference between the two groups at the P < 0.001 level;
SMI=serious mental illness; High-SMI defined as >=10% of nursing home residents with an SMI diagnosis present at admission;
Significant differences were noted in nearly all the patient characteristics displayed in the lower panel of Table 1. Consistent with the IV assumption that differential distance is associated with admission to a high-SMI facility, high-SMI residents lived relatively closer to high-SMI facilities (1.2 km vs. 8.7 km average differential distance, P<0.001; first stage regression F-statistic = 542.08). Refer to the appendix for the results of additional instrument validation tests.
The left-hand panel of Table 2 presents the results of naive regressions and the results of the main IV model for residents with SMI. In the naive model, we found mixed results in terms of care quality. After instrumenting for admitting facility type, we found that residing in a high-SMI facility was associated with similar or worse outcomes across all measures. We estimated non-significant increases in risk for the direct SMI care measures, use of restraints (1.43 pp; 95% CI, −0.14, 3.00) and hospitalizations (1.47 pp; 95% CI, −0.912, 3.843). For the general quality measures, we estimated that high-SMI facilities were associated with a statistically significant 3.7 pp increases in the probability of having a feeding tube (95% CI, 1.42, 5.95), a 70% increase relative to the sample mean for this outcome (Figure 1).
Table 2-.
Regression Results: Association between Admission to a High SMI Facility and Quality Outcomes for Residents with and without Serious Mental Illness (SMI)
| Residents with SMI | Residents without SMI | |||||||||
|---|---|---|---|---|---|---|---|---|---|---|
| Baseline Model | 2-SLS Model | Baseline Model | 2-SLS Model | |||||||
| Sample Mean |
Coef. | 95% Confidence Interval |
Coef. | 95% Confidence Interval |
Sample Mean |
Coef. | 95% Confidence Interval |
Coef. | 95% Confidence Interval |
|
| Restraints | 3.1 | 0.622 | (0.257,0.987)** | 1.431 | (−0.142,3.004)† | 4.8 | 0.673 | (0.364,0.983)*** | 1.069 | (−0.419,2.557) |
| Catheter | 7.3 | −1.116 | (−1.549,−0.683)*** | 0.231 | (−1.971,2.432) | 10.4 | −0.655 | (−0.969,−0.340)*** | 1.748 | (0.026,3.471)* |
| Hospitalizations | 16.9 | 0.124 | (−0.423,0.670) | 1.465 | (−0.912,3.843) | 15.7 | 0.54 | (0.214,0.865)*** | 3.798 | (2.161,5.435)*** |
| Feeding Tube | 5.3 | 0.529 | (0.035,1.024)* | 3.684 | (1.416,5.952)*** | 6.7 | 0.252 | (−0.107,0.611) | 2.086 | (0.432,3.740)* |
| Pressure Ulcer | 8.7 | −0.721 | (−1.122,−0.319)*** | −0.219 | (−2.093,1.656) | 13.7 | −0.683 | (−0.988,−0.379)*** | 1.575 | (−0.053,3.202)† |
| Off-labelOff-labelOff-labelOff-label Antipsychotic Use | 12.0 | 0.817 | (0.391,1.242)*** | −1.423 | (−3.616,0.769) | |||||
Notes:
indicates P < 0.1;
indicates P<0.05;
indicates P < 0.01;
indicates P<0.001;
2-SLS = two-stage least squares (instrumental variable estimation); All models adjust for a suite of resident and ZIP-code level control variables (refer to the appendix for complete list), state and year fixed effects, and length of stay; differential distance from a high- vs. low-SMI nursing home (log transformed) is used as the instrumental variable in the 2-SLS models. SMI models contain 12,027 unique facilities with at least one SMI admission during the study period. Non-SMI models contain 11,985 unique facilities with at least one SMI admission during the study period.
SMI population first-stage F-statistic = 542.08
Non-SMI population first-stage F-statistic = 725.1
Figure 1-. Estimated Percent Changes in Probability of Resident Outcomes Relative to Sample Means.
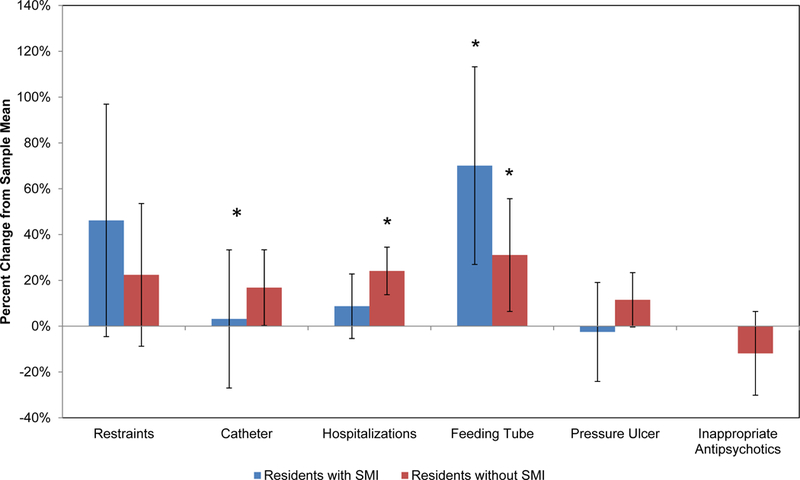
Notes- Estimates represent the implied percent change in the probability of the outcome of interest (from sample mean, reported in Table 2) associated with admission to a high-SMI facility according to two-stage least squares estimates reported in Table 2. SMI= serious mental illness. *Indicates P<0.05
The right-hand panel of Table 2 shows regression results among 558,699 residents (3,564,488 person quarters) without an SMI diagnosis. After instrumenting, we found that all quality outcomes were similar or worse among individuals without SMI admitted to high-SMI facilities. High-SMI nursing homes were associated with a 1.7 pp increase (10% relative to sample mean [Figure 1]) in the probability of catheter use (95 CI, 0.03, 3.47), a 3.8 pp increase (16%) in the probability of being hospitalized (95% CI, 2.16, 5.44) and a 2.1 pp increase (7%) in the probability of having a feeding tube (95% CI, 0.43, 3.74).
When restricting the sample to facilities with high quality scores, we continued to find evidence of admission to high-SMI facilities being significantly associated with increases in the risk of hospitalizations and the development of pressure ulcers (see Appendix).
Discussion
With respect to direct measures of SMI care quality, we found no statistically significant differences in the risk of hospitalizations or being physically restrained when comparing individuals with SMI admitted to high- vs. low-SMI facilities. In terms of general quality measures, admission to a high-SMI nursing home was associated with a roughly 70% increase in the risk of having a feeding tube for individuals with SMI. Worse outcomes, in terms of the risk of being hospitalized, having a catheter, and having a feeding tube, were also detected for individuals without SMI admitted to high-SMI facilities.
These results are consistent with previous evidence that individuals with SMI are admitted to lower quality facilities10,12 and that increases in the concentration of SMI residents within a nursing home lead to lower quality of care.13 They also suggest that higher concentrations of nursing home residents with SMI do not result in the development of expertise that leads to measureable improvements in quality. This finding has important implications because we estimate about one-third of nursing home residents with SMI are admitted to high-SMI facilities.
Caring for individuals with SMI can be resource intensive. Compared to other residents, these individuals may require more hours of direct care,11,14 are more likely to become long-stay residents,50 and may require services from specialized providers, such as psychiatrists, who are not typically housed within nursing homes.51,52 Furthermore, nursing home staff may require additional training to effectively care for this population.53,54 Despite this complexity, current reimbursement schemes may not adequately account for these additional costs. As such, individuals with SMI may face unique barriers to receiving high quality nursing home care.
To the extent that certain facilities are attempting to specialize in the care of individuals with SMI, high-SMI facilities may face financial strain due to a large number of low margin residents, making it difficult to finance optimal staffing levels, recruit high quality staff, prevent staff turn-over, and provide specialized therapies. Facilities may, in turn, respond by working to lower the cost of care delivery or by diverting resources from residents without SMI, whose care needs may be easier to defer, resulting in adverse outcomes for both patient populations.
Individuals with SMI may also be generally unable to access high-quality facilities due to selection on the part of the nursing homes. Assuming that better quality facilities enjoy greater market power55 and, therefore, have discretion over whom they admit,56 preferred nursing homes may be unlikely to accept individuals with SMI when more profitable residents are available.57 Individuals with SMI may be forced to accept placement at facilities with limited market power, resulting in their clustering within low-quality nursing homes that deliver worse care to all residents, regardless of SMI status. Given the adverse outcomes observed in the general measures of quality and in the non-SMI population, it appears this latter mechanism may be the predominant pathway through which lower quality occurs. However, the persistence of inferior outcomes within high-SMI facilities after restricting to “high-quality” nursing homes suggests that SMI concentrations may influence care quality in ways not fully captured by publicly reported measures, including staffing levels.
Regardless of the exact mechanism, alterations to the way nursing homes are reimbursed for caring for individuals with SMI could help improve quality. In particular, policy makers should consider additional payment adjustments that account for the costs of caring for this population. Such reforms could make it easier for individuals with SMI to access high-quality nursing homes, while also providing additional resources to facilitate quality improvements in current high-SMI facilities.58 In conjunction with payment increases, improved oversight may be needed to ensure that individuals with SMI are appropriate for nursing home care and that admitting facilities are equipped to meet this population’s needs.
This study has several limitations. First, our study period ends in 2010, meaning that we are unable to capture more recent patterns of care for individuals with SMI. Second, we are unable to observe nursing home processes of care, meaning it is unknown if high-SMI facilities care for residents with SMI in a manner different from low-SMI facilities. Third, the quality measures used in this study were not developed to assess the quality of mental health care. As such, they may not fully capture differences in psychiatric care quality that uniquely benefit individuals with SMI. Finally, our results are unable to identify the mechanism by which lower quality outcomes occur and whether SMI concentrations affect resident care in ways that are distinct from a facility’s overall quality. Future research should explore how changing concentrations of nursing home residents with SMI influence care patterns and resident outcomes.
Supplementary Material
Acknowledgements
A version of this work was presented at the 2018 AcademyHealth Annual Research Meeting This work was supported by a grant from the National Institute on Aging (1R01AG047194-01A1).
Funding: This work was funded by a grant from the National Institute on Aging (1R01AG047194-01A1).
Footnotes
Conflicts of interest: The authors report not conflicts of interest
Financial Disclosures: David Grabowski serves as a paid consultant to Precision Health Economics, Vivacitas, and CareLinx. Dr. Grabowski also serves on the Scientific Advisory Committee for NaviHealth.
References
- 1.Fakhoury W, Priebe S. Deinstitutionalization and reinstitutionalization: major changes in the provision of mental healthcare. Psychiatry 2007;6:313–6. [Google Scholar]
- 2.Lutterman T Tracking the History of State Psychiatric Hospital Closures from 1997 to 2015. Falls Church, VA: National Association of State Mental Health Program Directors Research Institute; 2015. [Google Scholar]
- 3.Fisher WH, Geller JL, Pandiani JA. The changing role of the state psychiatric hospital. Health Aff (Millwood) 2009;28:676–84. [DOI] [PubMed] [Google Scholar]
- 4.Grabowski DC, Aschbrenner KA, Feng Z, Mor V. Mental illness in nursing homes: variations across States. Health affairs (Project Hope) 2009;28:689–700. [DOI] [PMC free article] [PubMed] [Google Scholar]
- 5.Fullerton CA, McGuire TG, Feng Z, Mor V, Grabowski DC. Trends in mental health admissions to nursing homes, 1999–2005. Psychiatr Serv 2009;60:965–71. [DOI] [PMC free article] [PubMed] [Google Scholar]
- 6.Kim HM, Banaszak-Holl J, Kales H, Mach J, Blow F, McCarthy JF. Trends and predictors of quality of care in VA nursing homes related to serious mental illness. Med Care 2013;51:659–65. [DOI] [PubMed] [Google Scholar]
- 7.Io Medicine. Improving the Quality of Care in Nursing Homes. Washington, DC: The National Academies Press; 1986. [PubMed] [Google Scholar]
- 8.Yohanna D Deinstitutionalization of people with mental illness: Causes and consequences. AMA Journal of Ethics 2013;15:886–91. [DOI] [PubMed] [Google Scholar]
- 9.Snowden M, Roy-Byrne P. Mental illness and nursing home reform: OBRA-87 ten years later. Psychiatr Serv 1998;49:229–33. [DOI] [PubMed] [Google Scholar]
- 10.Temkin-Greener H, Campbell L, Cai X, Hasselberg MJ, Li Y. Are Post-Acute Patients with Behavioral Health Disorders Admitted to Lower-Quality Nursing Homes? The American Journal of Geriatric Psychiatry 2018;26:643–54. [DOI] [PubMed] [Google Scholar]
- 11.Grabowski DC, Aschbrenner KA, Rome VF, Bartels SJ. Quality of Mental Health Care for Nursing Home Residents: A Literature Review. Medical care research and review : MCRR 2010;67:627–56. [DOI] [PMC free article] [PubMed] [Google Scholar]
- 12.Li Y, Cai X, Cram P. Are patients with serious mental illness more likely to be admitted to nursing homes with more deficiencies in care? Med Care 2011;49:397. [DOI] [PMC free article] [PubMed] [Google Scholar]
- 13.Rahman M, Grabowski DC, Intrator O, Cai S, Mor V. Serious Mental Illness and Nursing Home Quality of Care. Health Serv Res 2013;48:1279–98. [DOI] [PMC free article] [PubMed] [Google Scholar]
- 14.McCarthy JF, Blow FC, Kales HC. Disruptive behaviors in Veterans Affairs nursing home residents: how different are residents with serious mental illness? J Am Geriatr Soc 2004;52:2031–8. [DOI] [PubMed] [Google Scholar]
- 15.Isaksson U, Åström S, Sandman P-O, Karlsson S. Factors associated with the prevalence of violent behaviour among residents living in nursing homes. J Clin Nurs 2009;18:972–80. [DOI] [PubMed] [Google Scholar]
- 16.Muramatsu RS, Goebert D. Psychiatric services: Experience, perceptions, and needs of nursing facility multidisciplinary leaders. J Am Geriatr Soc 2011;59:120–5. [DOI] [PubMed] [Google Scholar]
- 17.Birkmeyer JD, Stukel TA, Siewers AE, Goodney PP, Wennberg DE, Lucas FL. Surgeon volume and operative mortality in the United States. N Engl J Med 2003;349:2117–27. [DOI] [PubMed] [Google Scholar]
- 18.Joyce NR, McGuire TG, Bartels SJ, Mitchell SL, Grabowski DC. The Impact of Dementia Special Care Units on Quality of Care: An Instrumental Variables Analysis. Health Serv Res 2018. [DOI] [PMC free article] [PubMed] [Google Scholar]
- 19.Li Y, Cai X, Yin J, Glance LG, Mukamel DB. Is higher volume of postacute care patients associated with a lower rehospitalization rate in skilled nursing facilities? Med Care Res Rev 2012;69:103–18. [DOI] [PMC free article] [PubMed] [Google Scholar]
- 20.Gozalo P, Leland NE, Christian TJ, Mor V, Teno JM. Volume Matters: Returning Home After Hip Fracture. J Am Geriatr Soc 2015;63:2043–51. [DOI] [PMC free article] [PubMed] [Google Scholar]
- 21.Indredavik B, Bakke F, Slørdahl S, Rokseth R, Haheim L. Stroke unit treatment: 10-year follow-up. Stroke 1999;30:1524–7. [DOI] [PubMed] [Google Scholar]
- 22.Mor V, Intrator O, Unruh MA, Cai S. Temporal and Geographic variation in the validity and internal consistency of the Nursing Home Resident Assessment Minimum Data Set 2.0. BMC Health Serv Res 2011;11:78. [DOI] [PMC free article] [PubMed] [Google Scholar]
- 23.Zimmerman DR. Improving nursing home quality of care through outcomes data: the MDS quality indicators. Int J Geriatr Psychiatry 2003;18:250–7. [DOI] [PubMed] [Google Scholar]
- 24.Castle NG, Ferguson JC. What is nursing home quality and how is it measured? The Gerontologist 2010;50:426–42. [DOI] [PMC free article] [PubMed] [Google Scholar]
- 25.Castle NG, Engberg J. The health consequences of using physical restraints in nursing homes. Med Care 2009:1164–73. [DOI] [PubMed] [Google Scholar]
- 26.Sullivan‐Marx EM, Strumpf NE, Evans LK, Baumgarten M, Maislin G. Predictors of continued physical restraint use in nursing home residents following restraint reduction efforts. J Am Geriatr Soc 1999;47:342–8. [DOI] [PubMed] [Google Scholar]
- 27.Engberg J, Castle NG, McCaffrey D. Physical restraint initiation in nursing homes and subsequent resident health. The Gerontologist 2008;48:442–52. [DOI] [PubMed] [Google Scholar]
- 28.Hofmann H, Hahn S. Characteristics of nursing home residents and physical restraint: a systematic literature review. J Clin Nurs 2014;23:3012–24. [DOI] [PubMed] [Google Scholar]
- 29.Konetzka RT, Polsky D, Werner RM. Shipping out instead of shaping up: Rehospitalization from nursing homes as an unintended effect of public reporting. J Health Econ 2013;32:341–52. [DOI] [PubMed] [Google Scholar]
- 30.Grabowski DC. Medicare and medicaid: Conflicting incentives for long‐term care. The Milbank Quarterly 2007;85:579–610. [DOI] [PMC free article] [PubMed] [Google Scholar]
- 31.Becker MA, Boaz TL, Andel R, Gum AM, Papadopoulos AS. Predictors of preventable nursing home hospitalizations: the role of mental disorders and dementia. The American Journal of Geriatric Psychiatry 2010;18:475–82. [DOI] [PubMed] [Google Scholar]
- 32.Werner P, Cohen-Mansfield J, Koroknay V, Braun J. The impact of a restraint-reduction program on nursing home residents: Physical restraints may be successfully removed with no adverse effects, so long as less restrictive and more dignified care is provided. Geriatric Nursing 1994;15:142–6. [DOI] [PubMed] [Google Scholar]
- 33.Mitchell SL, Kiely DK, Lipsitz LA. The risk factors and impact on survival of feeding tube placement in nursing home residents with severe cognitive impairment. Arch Intern Med 1997;157:327–32. [PubMed] [Google Scholar]
- 34.Gillick MR. Rethinking the role of tube feeding in patients with advanced dementia. New England Journal of Medicine-Unbound Volume 2000;342:206–10. [DOI] [PubMed] [Google Scholar]
- 35.Holroyd‐Leduc JM, Sen S, Bertenthal D, et al. The relationship of indwelling urinary catheters to death, length of hospital stay, functional decline, and nursing home admission in hospitalized older medical patients. J Am Geriatr Soc 2007;55:227–33. [DOI] [PubMed] [Google Scholar]
- 36.Md SLM, Mph DKK, Gillick MR. Nursing home characteristics associated with tube feeding in advanced cognitive impairment. J Am Geriatr Soc 2003;51:75–9. [PubMed] [Google Scholar]
- 37.Lopez RP, Amella EJ, Strumpf NE, Teno JM, Mitchell SL. The influence of nursing home culture on the use of feeding tubes. Arch Intern Med 2010;170:83–8. [DOI] [PMC free article] [PubMed] [Google Scholar]
- 38.Konetzka RT, Stearns SC, Park J. The staffing–outcomes relationship in nursing homes. Health Serv Res 2008;43:1025–42. [DOI] [PMC free article] [PubMed] [Google Scholar]
- 39.Zhang X, Grabowski DC. Nursing home staffing and quality under the nursing home reform act. The Gerontologist 2004;44:13–23. [DOI] [PubMed] [Google Scholar]
- 40.Centers for Medicare and Medicaid Services. Nursing home compare five-star quality rating system: Year five report. Washington, DC; 2014. [Google Scholar]
- 41.Baiocchi M, Cheng J, Small DS. Instrumental Variable Analysis. Methods in Health Services Research 2018:1–44.29291745 [Google Scholar]
- 42.Angrist JD, Imbens GW, Rubin DB. Identification of Causal Effects Using Instrumental Variables. Journal of the American Statistical Association 1996;91:444–55. [Google Scholar]
- 43.Pesis-Katz I, Phelps CE, Temkin-Greener H, Spector WD, Veazie P, Mukamel DB. Making difficult decisions: the role of quality of care in choosing a nursing home. Am J Public Health 2013;103:e31–e7. [DOI] [PMC free article] [PubMed] [Google Scholar]
- 44.McClellan M, McNeil BJ, Newhouse JP. Does more intensive treatment of acute myocardial infarction in the elderly reduce mortality?: analysis using instrumental variables. JAMA 1994;272:859–66. [PubMed] [Google Scholar]
- 45.Hirth RA, Grabowski DC, Feng Z, Rahman M, Mor V. Effect of nursing home ownership on hospitalization of long-stay residents: an instrumental variables approach. International journal of health care finance and economics 2014;14:1–18. [DOI] [PMC free article] [PubMed] [Google Scholar]
- 46.Gadbois EA, Tyler DA, Mor V. Selecting a skilled nursing facility for postacute care: Individual and family perspectives. J Am Geriatr Soc 2017;65:2459–65. [DOI] [PMC free article] [PubMed] [Google Scholar]
- 47.Xian Y, Holloway RG, Chan PS, et al. Association between stroke center hospitalization for acute ischemic stroke and mortality. JAMA 2011;305:373–80. [DOI] [PMC free article] [PubMed] [Google Scholar]
- 48.STAIGER D STOCK JH. INSTRUMENTAL VARIABLES REGRESSION WITH WEAK INSTRUMENTS. Econometrica 1997;65:557–86. [Google Scholar]
- 49.Lucas JA, Chakravarty S, Bowblis JR, et al. Antipsychotic medication use in nursing homes: a proposed measure of quality. Int J Geriatr Psychiatry 2014;29:1049–61. [DOI] [PubMed] [Google Scholar]
- 50.Aschbrenner K, Grabowski DC, Cai S, Bartels SJ, Mor V. Nursing home admissions and long-stay conversions among persons with and without serious mental illness. J Aging Soc Policy 2011;23:286–304. [DOI] [PMC free article] [PubMed] [Google Scholar]
- 51.Molinari V, Hedgecock D, Branch L, Brown LM, Hyer K. Mental health services in nursing homes: A survey of nursing home administrative personnel. Aging and Mental Health 2009;13:477–86. [DOI] [PubMed] [Google Scholar]
- 52.Orth J, Li Y, Simning A, Temkin‐Greener H. Providing Behavioral Health Services in Nursing Homes Is Difficult: Findings From a National Survey. J Am Geriatr Soc. [DOI] [PMC free article] [PubMed] [Google Scholar]
- 53.Molinari VA, Merritt SS, Mills WL, et al. Serious mental illness in Florida nursing homes: Need for training. Gerontol Geriatr Educ 2008;29:66–83. [DOI] [PubMed] [Google Scholar]
- 54.Blair Irvine A, Billow MB, Eberhage MG, Seeley JR, McMahon E, Bourgeois M. Mental illness training for licensed staff in long-term care. Issues Ment Health Nurs 2012;33:181–94. [DOI] [PMC free article] [PubMed] [Google Scholar]
- 55.Werner RM, Norton EC, Konetzka RT, Polsky D. Do consumers respond to publicly reported quality information? Evidence from nursing homes. J Health Econ 2012;31:50–61. [DOI] [PubMed] [Google Scholar]
- 56.Mor V, Zinn J, Angelelli J, Teno JM, Miller SC. Driven to tiers: socioeconomic and racial disparities in the quality of nursing home care. The Milbank Quarterly 2004;82:227–56. [DOI] [PMC free article] [PubMed] [Google Scholar]
- 57.He D, Konetzka RT. Public reporting and demand rationing: Evidence from the nursing home industry. Health Econ 2015;24:1437–51. [DOI] [PMC free article] [PubMed] [Google Scholar]
- 58.Mor V, Gruneir A, Feng Z, Grabowski DC, Intrator O, Zinn J. The effect of state policies on nursing home resident outcomes. J Am Geriatr Soc 2011;59:3–9. [DOI] [PMC free article] [PubMed] [Google Scholar]
Associated Data
This section collects any data citations, data availability statements, or supplementary materials included in this article.