Abstract
Distortion of nominally planar phthalocyanine macrocycles affects the excited state dynamics in that most of the excited state energy decays via internal conversion. A click-type annulation reaction on a perfluorophthalocyanine platform appending a 7-member ring to the β positions on one or more of the isoindoles distorts the macrocycle and modulates solubility. The distorted derivative enables photoacoustic imaging, photothermal effects, and strong surface-enhanced resonance Raman signals.
Photothermal therapy (PTT)[1] and photoacoustic imaging (PAI)[2] are examples of the diverse applications of dyes wherein the primary photo-deactivation pathway is by internal conversion and the generation of heat. PTT and PAI are used in the clinic with sub-mm spatial resolution, and these biomedical applications require a large optical cross section of the dye in the 650 nm – 850 nm region, the therapeutic window. While PTT uses continuous light irradiation, PAI uses pulsed light leading to a localized thermal elastic expansion in the vicinity of the dye[2c] and ultrasound detection. If the light source is a pulsed laser, light absorption generates a wideband ultrasonic wave that can be acquired with standard ultrasonic transducers used in traditional ultrasound imaging.[3]
Phthalocyanines (Pc) are large aromatic macrocycles that are stable under a wide range of conditions and have absorption in the visible and near infrared (400 nm to 900 nm) depending on the structure.[4] Al(III)Pc tetrasulfate, for example, is used in the clinic for photodynamic therapy.[5] Over 50 tonnes of simple, symmetric Pc are made annually for colorants, photonics, and are proposed components of electronics, solar energy harvesting materials, and catalysis. The synthesis and purification of more complex derivatives is cumbersome and inefficient because of poor solubility and increasing number of isomers. We use the commercially available zinc(II) hexadeca-fluorophthalocyanine (ZnF16Pc) as a platform to construct complex Pc derivatives using efficient nucleophilic aromatic substitution reactions to replace the β F with a variety of nucleophiles.[4a]
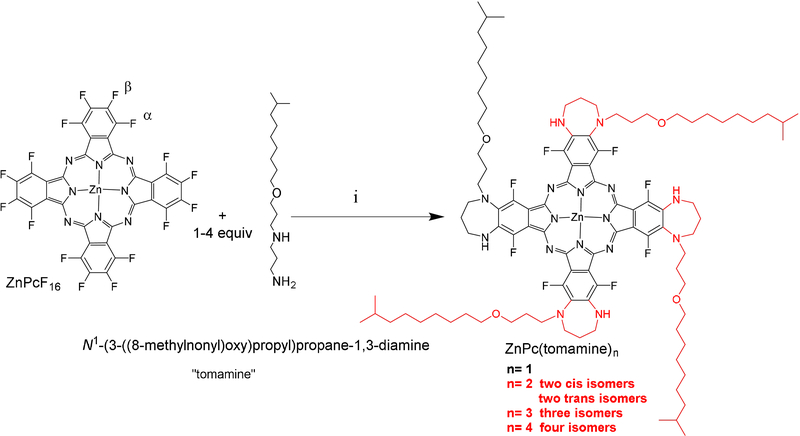
Compared to the planar compounds, distorted Pc have unique photophysical attributes such as near infra-red (NIR) absorption, low 1O2, low fluorescence, solvent dependency, different redox potentials, distinct catalytic cycles, and diverse materials properties.[4e, 6] Most Pc distortion is achieved by steric crowding of the peripheral substituents, especially at neighbouring α-α positions.[4e, 6a, 6f] To develop a lipophilic or amphipathic Pc derivative, we substituted a commercial surfactant, isodecyloxypropyl-1,3-diamino-propane (tomamine®), onto ZnPcF16 via a simple one-step annulation to yield a 7-member ring on the two β positions of an isoindole (Scheme1). Unexpectedly, appending the tomamine distorts the Pc, thereby enabling photothermal processes, photoacoustic imaging, and a surprisingly uncomplicated surface-enhanced resonance Raman spectrum.
Varying the equivalents of tomamine and the reaction time enables the formation and isolation of mono-, di-, tri- and tetra-substituted products with progressively redder lowest energy Q band λmax (Table 1). The electronic spectra of all compounds are strongly solvent dependent. The α positions on ZnPcF16 are thermodynamically favoured, but they are kinetically less reactive than the β positions. Since primary nucleophiles are more reactive than secondary, the initial substitution is the terminal amine at one of the β positions, and since the secondary amine is too sterically hindered to react at the α position, it reacts at the neighbouring β position. Thus, the tomamine adducts are appended only to the β positions, which is verified by the 19F NMR. Note that for all compounds the tomamine tail can point in either direction, so there are three isomers for the cis and two trans di-substituted, three isomers for the tri-substituted, and four for the tetra-Scheme 1 substituted compounds, which were not separated.
Table 1.
Electronic Spectra,a ʎmax (log Ɛ)
| Compound | acetone | dimethylsulfoxide |
|---|---|---|
| ZnPc(tomamine)1 | 347, 674, 745 (3.51) | 347, 700, 774 (3.60) |
| ZnPc(tomamine)2 | 348, 730, 768 (3.45) | 348, 735, 810 (3.49) |
| ZnPc(tomamine)3 | 350, 690, 778 (3.39) | 350, 715, 805 (3.38) |
| ZnPc(tomamine)4 | 354, 702, 795 (3.42) | 355, 726, 820 (3.25) |
see supporting information for spectra in other solvents.
Scheme 1.
Reactions are run in DMF under N2: ZnPc(tomamine)4 uses 5.2 equivalents tomamine, 5.3 equivalents K2CO3, stir 48 h at 135 οC; ZnPc(tomamine)3 uses 3.2 equivalents tomamine, 3.3 equivalents K2CO3, stir 24 h at 120 οC; ZnPc(tomamine)2 uses 2.2 equivalents tomamine, stir 16 h at 120 οC; ZnPc(tomamine)1 uses 1.2 equivalents tomamine, stir 12 h at 110 οC.
The UV-visible spectra at different concentrations and dynamic light scattering (DLS) indicate no aggregation in solvents such as acetone, methanol and dimethylsulfoxide. The large ca. 76 nm red shift and the large solvent dependence of the Q bands in the UV-visible spectra (Table 1 and supporting information) after addition of the first tomamine are consistent with the distortion of the otherwise planar macrocycle.[6b, 7] Planar, free base and closed shell metalloPc have fluorescence quantum yields of ca. 10% and singlet oxygen quantum yields of ca. 50% with relatively weak solvent dependencies of ca. 15 nm in diverse organic solvents.[8] None of the ZnPc(tomamine)n derivatives fluoresce and all have less than ca. 1% singlet oxygen quantum yields, indicating little intersystem crossing to the triplet state. Thus, similar to previous reports on distorted porphyrinoids, most of the excited state energy is dissipated by internal conversion.[6b, 6c, 7b] The UV-visible spectra in THF are not significantly temperature dependent indicating neither aggregation nor significant changes in the distortion.
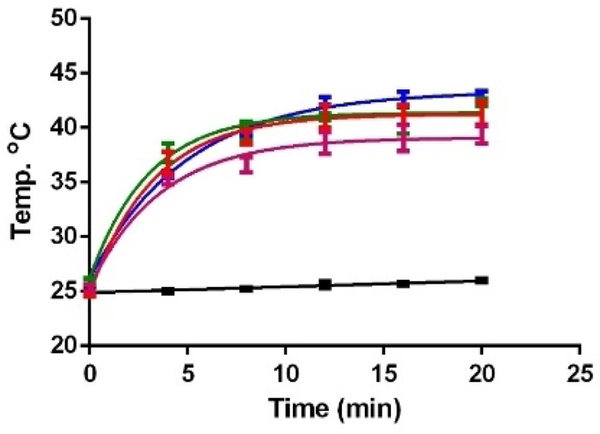
The photostabilities of all four adducts were assayed by UV-visible spectra, and ca. 50% of compounds are still intact after 8 h exposure under direct white light at 0.41 mW/cm2. Simple photothermal assays showed a concentration dependent increase of 13–22 ºC in buffer solutions of the tomamine compounds (Fig. 1).
Figure 1.
Photothermal heating of 1.5 mL of a 100 μM solutions in PBS buffer of tomamine substituted compounds in a 2 mL glass vial. Pink = ZnPc(tomamine)1, red = ZnPc(tomamine)2, green = ZnPc(tomamine)3, blue = ZnPc(tomamine)4, black = blank in cell culture medium when irradiated under white light at 0.80 mW/cm2 for 20 min.
Steric energy MM2 minimizations using Chembiodraw 3D support non-planar mixtures of both saddle and ruffling distortions after the first tomamine addition and that the di-, tri-, and tetra- tomamine compounds are only slightly more distorted.[6a] The exocyclic 7-member ring contributes about 26 kj mol−1 of strain[9] and the ionic radius of the Zn(II) ion causes it to sit out of the Pc plane[10] thereby diminishing the rigidity and lowering the energy barriers to distortions of the macrocycle.[11]
We examined the photoacoustic (PA) properties of these compounds solubilized in agarose gel tissue phantoms (Figure 2 and supporting information) using an inVision 256-TF Multispectra Optoacoustic Tomography (MSOT) imaging system (iThera Medical).[12] Average PA spectra, i.e. plots of PA intensity vs. excitation wavelength, were reconstructed from the tomographic information obtained. Representative cross-sections were chosen for each dye sample, and the spectra of several pixels within each cross section were averaged. The detected PA intensity cannot discriminate between the various dyes present at different locations within the phantom, so a least-squares deconvolution technique was applied using the individual dye spectra to obtain the 2-color images shown. Despite the broadening, most likely due to the instrument acquisition parameters, and the broad absorption peaks of the dyes, it is clear from the PA images and spectra that the ZnPc(tomamine)n exhibit similar intensities and contrast as the indocyanine green standard (Figure 2). ZnPc(tomamine)2 appears to offer the best compromise between good PA intensity and other factors such as solubility. The third and fourth substitution on the PC core only marginally enhance the PA signal.
Figure 2.
Left: Photoacoustic spectra of (red) ZnPc(tomamine)1, (blue) ZnPc(tomamine)2, (orange) ZnPc(tomamine)3, and (purple) ZnPc(tomamine)4 in an agarose gel at ca. 50 μM, compared to a standard 50 μM indocyanine green (ICG). Right: photoacoustic tomogram of the ICG control (green) and the ZnPc(tomamine)2 (purple) in an agarose phantom. See ESI for the photoacustic data for the other tomamine compounds.
Raman spectroscopy takes advantage of inelastic scattering between vibrational modes to yield highly specific ‘finger-print’ spectra. Unlike fluorescence, Raman spectra have multiple and very narrow peaks, and are less prone to photobleaching. This gives Raman spectroscopy the ability to deconvolve signals in complex mixtures and the advantage of monitoring specific entities over a period of time without signal decay.[13] Since the intrinsic Raman signal of molecules is weak, coupling molecules of interest with the electric field at the surface of plasmonic materials can dramatically enhance the signal amplitude. Surface-enhanced Raman scattering (SERS) can use plasmonic nanoparticles with any molecule of interest that has affinity to either gold or silver.[14] SERS is used in a variety of applications including biomedical imaging, trace detection of pesticides in food, explosive substances in airports, and monitoring catalysis over time.[15] We incorporated the ZnPc(tomamine)n molecules into a previously reported gold nanostructure[16] to measure their Raman capabilities for applications in biomedical imaging and sensor design.
Gold nanostars were synthesized by rapid reduction of gold chloride trihydrate in the presence of ascorbic acid according to previously reported methods.[16] The ZnPc(tomamine)n dyes are incorporated by a fast adsorption of the dyes onto the surface of the particles and simultaneous silication to passivate the dye-covered particles.[16–17] Adsorption is favored due to the Pc pi and nitrogen interactions with gold and there is no indication of dye aggregation. After washing, Raman measurements were taken using 10 μL of the re-dispersed particles with a 785 nm laser (160 mW) and one second acquisition time in streamline imaging mode. Spectra were compared to IR-780, a commonly used dye with a strong Raman cross-section. Transmission electron microscope images were taken to assess the morphology of the particles (ESI).
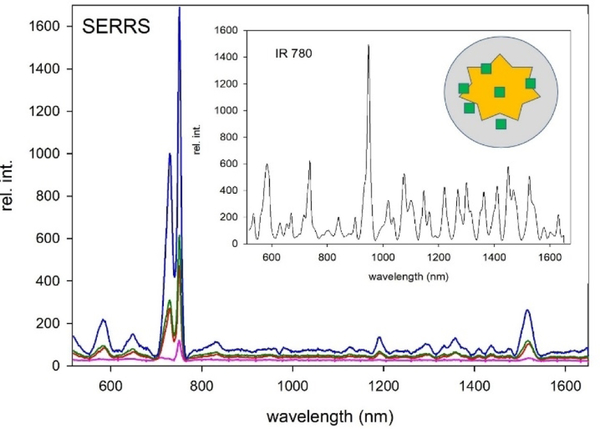
Nanostars were chosen as they have an absorption maximum in the red and near IR portion of the visible spectrum[18] and this correlates well with both the absorption of our dyes and the irradiation wavelength of the laser used. The resonance between the laser, the dye, and particles is known to enhance Raman signal, and is known as ‘surface-enhanced resonance Raman spectroscopy’ (SERRS).[19] Results indicate that all four tomamine compounds and ZnPcF16 have characteristic peaks[20] near 730 cm−1 and 750 cm−1 . To determine what vibrations these peaks are associated with, a Raman spectrum of ZnF16Pc was calculated by DFT optimization. We are assigning the 730 cm-1 peak to the entire Pc breathing and the 750 cm-1 peak to rocking of the Pc, excluding benzene rings based on these results. The SERS spectrum of ZnF16Pc shows good peak agreement with the calculated spectrum. As expected, however, certain modes will be more enhanced than others on a gold surface. Since the benzene groups don’t participate as much in the rocking motion, it is expected that substitution will affect the 750 cm-1 less than the 730 cm-1 peak. Our data match this expectation; with increased substitution, the peak at 730 cm-1 blue shifts, while the one at 750 cm-1 is relatively static.
Intensity increases with substitution, as expected due to resonance with the laser. However, it cannot be ruled out that aggregation also plays a role in increased intensity. Silication occurs simultaneously with dye adsorption, making it possible for many smaller gold stars to be encased in a silica shell as aggregated particles. Molecules between two or greater plasmon surfaces will result in higher intensity than those adsorbed to a single surface because of the increased electric field at the point of contact. As seen in the supporting information, particles labeled with ZnPc(tomamine)3 and especially ZnPc(tomamine)4 show significant aggregation which will undoubtedly contribute to part of their enhanced intensities. The aggregation is thought to result from increased affinity of the molecules to the gold surface, with increasing number of nitrogen with higher substitution.
Note that the crystal structures of Zn(II) Pc show that the metal ion is on top of the mean plane of the Pc,[21] thereby inducing some distortion in solution or lowering the barriers to out-of-plane vibrational modes. The Raman intensity of both peaks increases with increasing tomamine substitution, which may indicate a lowering of the barrier for out of plane vibrational modes.[11, 22] Furthermore, the spectra contain a smaller peak near 1520 cm-1, which corresponds to the C-N-C bridge in phthalocyanine and porphyrin macrocycles according to literature[23]. This peak is a good indicator of the environment around the metal ion, with a shift indicating distortion of the macrocycle. The Lash group have studied the effect on the peak with substitution of exocyclic rings on porphyrins and found that a 7 membered ring blueshifts the spectra relative to the unsubstituted compound[23a]. We similarly see a blue shift in this peak, from 1526 cm-1 in the precursor to 1516 cm −1 in the tetra substituted compound. The greatest difference in the spectra is seen between the starting material and the monosubstituted species. Smaller blueshifts are seen between monosubstituted compound and higher order substitution. This helps confirm that substitution deforms the macrocycle and furthermore that the largest difference in macrocycle conformation is between the planar and nonplanar species.
The significant number and intensity of the IR-780 off resonance peaks creates a background signal (s/b ca. 2.5) that can limit multiplexing. The relatively few low-intensity Raman peaks (s/b ca. 8.5 for the tetra derivative) for the four tomamine compounds is likely because of the aromaticity and greater symmetry.
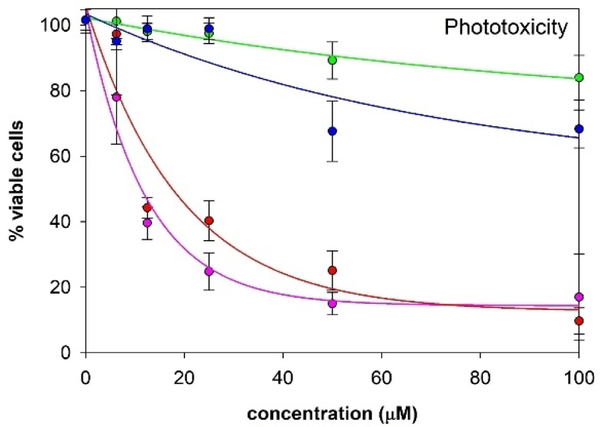
Given the amphipathic properties of the ZnPc(tomamine)n compounds and their photothermal properties, we examined cell uptake and toxicity studies using the MDA-MB231 human breast cancer cell line. Uptake studies show that mono- and di- substituted compounds are taken up by cells while tri- and tetra- substituted products show no significant uptake due to formation of aggregates in the aqueous media (Figure S34). Dark toxicity studies show no significant toxicity at concentrations <20 μM (see supporting information Figure S35). Mono- and di- substituted compounds are phototoxic when the cells were irradiated with white light at 0.80 mW/cm2 for 20 min (Figure 4). Since 1O2 is not being produced by these dyes, we postulate that the thermal relaxation of the excited state is providing enough heat to kill the cancer cells. (See ESI for uptake Figure S34 and dark toxicity Figure S35).
Figure 4.
MDA-MB-231cell phototoxicity (0.92 mW cm−2 for 20 min). Purple = ZnPc(tomamine)1, red = ZnPc(tomamine)2, green = ZnPc(tomamine)3, blue = ZnPc(tomamine)4. Fits are arbitrary and two standard deviations are shown.
The ZnPcF16 platform affords derivatives for diverse applications, potentially in multi-gram quantities. The tomamine surfactant imparts amphipathic solubility, alters the photophysical properties that enables two modes of diagnostic imaging, and potentiates therapeutic applications.
Experimental Section
Scheme 1 outlines the synthesis. Complete experimental procedures, spectral characterization (NMR, mass spectrometry, UV-visible), instruments and their settings are described in detail in the supporting information. Methods for the Raman, PTT, and PAI studies are described, as is an extended discussion of the Raman spectra in the supporting information.
Supplementary Material
Figure 3.
SERRS pink = ZnPc(tomamine)1, red = ZnPc(tomamine)2, green = ZnPc(tomamine)3, blue = ZnPc(tomamine)4. The inset is the SERRS spectrum of a common standard, IR-780. schematic of the gold nanostar the dye (green squares) and the silica shell (grey).
Acknowledgements
Supported by the U.S. National Science Foundation CHE-1610755 to C.M.D. National Institutes of Health R01 EB017748 and CA222836 to M.F.K. We thank Mircea Cotlet at The Center for Functional Nanomaterials (CFN) for help with singlet oxygen studies; the CFN is a U.S. DOE Office of Science Facility at Brookhaven National Laboratory under Contract No. DE-SC0012704. We thank Alei A. Rizvi for help with the synthesis and Dhwanit Dave who provided the DFT calculated Raman spectrum of ZnF16Pc.
References
- [1].a) Jaque D, Maestro L. Martinez, del Rosal B, Haro-Gonzalez P, Benayas A, Plaza JL, Rodriguez E. Martin, Sole J. Garcia, Nanoscale 2014, 6, 9494–9530; [DOI] [PubMed] [Google Scholar]; b) Fang J, Chen YC, Curr. Pharm. Des 2013, 19, 6622–6634. [DOI] [PubMed] [Google Scholar]
- [2].a) Beard P, Interface Focus 2011, 1, 602–631; [DOI] [PMC free article] [PubMed] [Google Scholar]; b) Wang LV, Hu S, Science 2012, 335, 1458–1462; [DOI] [PMC free article] [PubMed] [Google Scholar]; c) Luciano M, Erfanzadeh M, Zhou F, Zhu H, Bornhutter T, Roder B, Zhu Q, Bruckner C, Org. Biomol. Chem 2017, 15, 972–983; [DOI] [PMC free article] [PubMed] [Google Scholar]; d) Hursh D, Kuwana T, Anal. Chem 1980, 52, 646–650; [Google Scholar]; e) Attia ABE, Balasundaram G, Driessen W, Ntziachristos V, Olivo M, Biomed. Opt. Express 2015, 6, 591–598. [DOI] [PMC free article] [PubMed] [Google Scholar]
- [3].Wang LV, Wu H, in Biomedical Optics (Eds.: Wang LV, Wu H), Wiley on line Library, 2012. [Google Scholar]
- [4].a) Bhupathiraju NVSDK, Rizvi W, Batteas JD, Drain CM, Org. Biomol. Chem 2016, 14, 389–408; [DOI] [PMC free article] [PubMed] [Google Scholar]; b) Singh S, Aggarwal A, Bhupathiraju NVSDK, Arianna G, Tiwari K, Drain CM, Chem. Rev 2015, 115, 10261–10306; [DOI] [PMC free article] [PubMed] [Google Scholar]; c) Ma J, Li Y, Liu G, Li A, Chen Y, Zhou X, Chen D, Hou Z, Zhu X, Colloids Surf., B. 2018, 162, 76–89; [DOI] [PubMed] [Google Scholar]; d) Pan H, Li S, Kan J.-l., Gong L, Lin C, Liu W, Qi D, Wang K, Yan X, Jiang J, Chem. Sci 2019; [DOI] [PMC free article] [PubMed] [Google Scholar]; e) Zhou Y, Wang D, Zhang Y, Chitgupi U, Geng J, Wang Y, Zhang Y, Cook TR, Xia J, Lovell JF, Theranostics 2016, 5, 688–697; [DOI] [PMC free article] [PubMed] [Google Scholar]; f) Zhang Y, Lovell JF, Wiley Interdiscip. Rev.: Nanomed. Nanobiotechnol 2017, 9, e1420; [DOI] [PMC free article] [PubMed] [Google Scholar]; g) Ping J.-t., You F.-t., Geng Z.-x., Peng H.-s., Nanotechnology 2019, 30, 345207. [DOI] [PubMed] [Google Scholar]
- [5].Ormond AB, Freeman HS, Materials (Basel) 2013, 6, 817–840. [DOI] [PMC free article] [PubMed] [Google Scholar]
- [6].a) Conradie J, Ghosh A, ACS Omega 2017, 2, 6708–6714; [DOI] [PMC free article] [PubMed] [Google Scholar]; b) Honda T, Kojima T, Kobayashi N, Fukuzumi S, Angew. Chem. Int. Ed. 2011, 50, 2725–2728; [DOI] [PubMed] [Google Scholar]; c) Mizuguchi J, Matsumoto S, J. Phys. Chem. A 1999, 103, 614–616; [Google Scholar]; d) Zorlu Y, Kumru U, Isci U, Divrik B, Jeanneau E, Albrieux F, Dede Y, Ahsen V, Dumoulin F, Chem. Com. 2015, 51, 6580–6583; [DOI] [PubMed] [Google Scholar]; e) Farley C, Bhupathiraju NVSDK, John BK, Drain CM, J. Phys. Chem. A 2016, 120, 7451–7464; [DOI] [PMC free article] [PubMed] [Google Scholar]; f) Revuelta-Maza MA, Nonell S, Torre G. de la, Torres T, Org. Biomol. Chem. 2019, 17, 7448–7454. [DOI] [PubMed] [Google Scholar]
- [7].a) Drain CM, Gentemann S, Roberts JA, Nelson NY, Medforth CJ, Jia S, Simpson MC, Smith KM, Fajer J, Shelnutt JA, Holten D, J. Am. Chem. Soc. 1998, 120, 3781–3791; [Google Scholar]; b) Drain CM, Kirmaier C, Medforth CJ, Nurco DJ, Smith KM, Holten D, J. Phys. Chem. 1996, 100, 11984–11993. [Google Scholar]
- [8].a) Taştemel A, Karaca Birsen Y., Durmuş M, Bulut M, J. Luminescence 2015, 168, 163–171; [Google Scholar]; b) Josefsen LB, Boyle RW, Metal-Based Drugs 2008, 2008, 276109; [DOI] [PMC free article] [PubMed] [Google Scholar]; c) Kuznetsova NA, Gretsova NS, Derkacheva VM, Kaliya OL, Lukyanets EA, J. Porphyrins Phthalocyanines 2003, 07, 147–154; [Google Scholar]; d) Lawrence DS, Whitten DG, Photochem. Photobiol. 1996, 64, 923–935; [DOI] [PubMed] [Google Scholar]; e) Verdree VT, Pakhomov S, Allen G. Su, M. W., Countryman AC, Hammer RP, Soper SA, J. Fluorescence 2007, 17, 547–563. [DOI] [PubMed] [Google Scholar]
- [9].Dudev T, Lim C, J. Am. Chem. Soc. 1998, 120, 4450–4458. [Google Scholar]
- [10].Cui L-Y, Yang J, Fu Q, Zhao B-Z, Tian L, Yu H-L, Mol J. Structure 2007, 827, 149–154. [Google Scholar]
- [11].Tackley DR, Dent G, Smith W.Ewen, Phys. Chem. Chem. Phys. 2001, 3, 1419–1426. [Google Scholar]
- [12].Neuschmelting V, Lockau H, Ntziachristos V, Grimm J, Kircher MF, Radiology 2016, 280, 137–150. [DOI] [PMC free article] [PubMed] [Google Scholar]
- [13].Qian XM, Nie SM, Chem. Soc. Rev. 2008, 37, 912–920. [DOI] [PubMed] [Google Scholar]
- [14].a) Fleischmann M, Hendra PJ, McQuillan AJ, Chem. Phys. Let. 1974, 26, 163–166; [Google Scholar]; b) Huang J. F. Li, Y. F., Ding Y, Yang ZL, Li SB, Zhou XS, Fan FR, Zhang W, Zhou ZY, Wu DY, Ren B, Wang ZL, Tian ZQ, Nature 2010, 464, 392. [DOI] [PubMed] [Google Scholar]
- [15].a) McNay G, Eustace D, Smith WE, Faulds K, Graham D, Appl. Spectrosc. 2011, 65, 825–837; [DOI] [PubMed] [Google Scholar]; b) Sharma B, Frontiera RR, Henry A-I, Ringe E, Van Duyne RP, Mater. Today 2012, 15, 16–25. [Google Scholar]
- [16].Wall MA, Harmsen S, Pal S, Zhang L, Arianna G, Lombardi JR, Drain CM, Kircher MF, Adv. Mater. 2017, 29, 1605622. [DOI] [PMC free article] [PubMed] [Google Scholar]
- [17].Doering WE, Nie S, Anal. Chem. 2003, 75, 6171–6176. [DOI] [PubMed] [Google Scholar]
- [18].a) Tian Z-Q, Ren B, Wu D-Y, J. Phys. Chem. B 2002, 106, 9463–9483; [Google Scholar]; b) Kleinman SL, Frontiera RR, Henry A-I, Dieringer JA, Van Duyne RP, Phys. Chem. Chem. Phys. 2013, 15, 21–36. [DOI] [PubMed] [Google Scholar]
- [19].Le Ru EC, Blackie E, Meyer M, Etchegoin PG, J. Phys. Chem. C 2007, 111, 13794–13803. [Google Scholar]
- [20].a) Ferguson EE, Hudson RL, Nielsen JR, Smith DC, J. Chem. Phys. 1953, 21, 1464–1469; [Google Scholar]; b) Ferguson EE, Hudson RL, Nielsen JR, Smith DC, J. Chem. Phys. 1953, 21, 1457–1463; [Google Scholar]; c) Kavelin V, Fesenko O, Dubyna H, Vidal C, Klar TA, Hrelescu C, Dolgov L, Nanoscale Res. Let. 2017, 12, 197; [DOI] [PMC free article] [PubMed] [Google Scholar]; d) Palys BJ, Puppels GJ, van den Ham D, Feil D, J. Electroanal. Chem. 1992, 326, 105–112; [Google Scholar]; e) Rao CNR, Venkataraghavan R, Canadian J. Chem. 1964, 42, 43–49. [Google Scholar]
- [21].Cui L-Y, Yang J, Fu Q, Zhao B-Z, Tian L, Yu H-L, J. Mol. Struct. 2007, 827, 149–154. [Google Scholar]
- [22].Novikova NI, Lo ASV, Gordon KC, Brothers PJ, Simpson MC, J. Phys. Chem. A 2018, 122, 5121–5131. [DOI] [PubMed] [Google Scholar]
- [23].a) Czernuszewicz RS, Rankin JG, Lash TD, Inorganic Chemistry 1996, 35, 199–209; [DOI] [PubMed] [Google Scholar]; b) Tackley DR, Dent G, Smith W.Ewen, Physical Chemistry Chemical Physics 2000, 2, 3949–3955. [Google Scholar]
Associated Data
This section collects any data citations, data availability statements, or supplementary materials included in this article.


