Abstract
Background
The modified early warning score (MEWS) was set up to supply prompt recognition of clinically deteriorating patients before they undergo a severe and life-threatening event. The study aimed to describe the probable usefulness of the MEWS in identifying deteriorating post-Whipple patients in hospital wards.
Methods
We performed a study to analyze the relationship between the vital parameters and postoperative severe adverse events of patients after Whipple surgery in Guangdong Provincial People’s Hospital from 2000 to 2017. In the retrospective study, a total of 13,651 sets of vital parameters in 236 Whipple postoperative patients were included. Subsequently, we applied a MEWS scoring system and explored the accuracy of the MEWS in evaluating the patients’ final events versus advanced mathematical models. We then put the MEWS into the ward warning system and confirmed the accuracy of the MEWS based on the results of prospective studies again.
Results
We assessed the ability of the MEWS to predict postoperative complications with an accuracy rate of 90.86–91.23%, a sensitivity of 83.04–90.88%, and a specificity of 90.85–95.73%.
Conclusions
The MEWS model was applied to identify post-Whipple patients at risk of complication. Once the MEWS ≥2, interventions were needed to minimize the adverse events. Our data suggest that the MEWS is comparable to the advanced mathematical models, but MEWS is more accessible to perform and more generally applicable.
Keywords: Detection of deteriorating patients, vital parameters, modified early warning score (MEWS)
Introduction
It is challenging to identify ward patients who are in danger of deterioration. In the earlier literature, through the observation of cases, Goldhill emphasized the importance of physiological abnormality as a marker for a person whose condition dramatically worsens (1). Thus, the early warning system was conceived, and, depending on the actual situation in different countries and departments, the modified early warning scores (MEWS) was created. Moreover, the MEWS is intended to improve communication between nursing staff and junior doctors and to respond to patients who need to be given immediate priority. Louise indicated that adherence to the MEWS protocol is essential (2). Some studies have illustrated that the risk of death increased with an increasing MEWS score (3-5). However, Vorwerk voiced concerns about the tendency of low MEWS stratification to create type II errors (6).
In a UK cohort study, after the use of MEWS, the number of cardiac arrest calls relative to adult hospital admissions, the proportion of patients admitted to intensive care, and the in-hospital mortality of these patients fell dramatically (7). It also found that the early detection of deterioration in patients on surgical wards outside the intensive care unit (ICU) should be improved by introducing an automated MEWS-based system with paging functionality (8), while other studies indicated that MEWS could enhance patient care and improve the efficient use of available clinical resources (9). Overall, the MEWS was more suitable for the evaluation of the prognosis of local patients than the traditional scale (10).
Our project aimed to predict the occurrence of complications in post-Whipple patients based on the MEWS. We usually performed Whipple procedure to remove a malignant tumor involving the ampulla of Vater, the terminal part of the common bile duct, the duodenum, or the head of the pancreas. It is also used to remove cystic pancreatic neoplasms that may be malignant or chronic calcified pancreatitis that causes intractable abdominal pain. However, post-Whipple severe complications should not be ignored because of the poor prognosis for patients, mainly manifested as prolonged discharge time, deteriorating condition, transfer to the ICU, or death. Therefore, early detection of postoperative complications is a significant means for prompt intervention and prevention of adverse outcomes.
The goal in our study was to provide the hospital staff with more attentions into the value of the MEWS in predicting their patients’ prognosis and thereby increase the awareness and protocol adherence.
Methods
Research center
The retrospective observational study and prospective confirmatory study were conducted in a large urban hospital medical center (Guangdong Provincial People’s Hospital) where there are 110,000 admissions per annum in China.
Patient choice
In the 183-month inclusion period from January 2000 to March 2015, all post-Whipple surgery patients who were in the hospital at 07:00/10:00/13:00/16:00/19:00 and in the department of general surgery were included. Patients 18 years and older with more than one overnight stay were included. The Ethics Committee of Guangdong Academy of Medical Sciences Medical Center approved the study, and the necessity for informed consent was waived.
Data collection
According to the protocol, each time the vital parameters of the patients were obtained, the nurses were requested to record the vital parameters in the electronic system and determine the MEWS. The MEWS measurements could be repeated any time during the patients’ hospitalization by the nurses and doctors, and all the vital parameters were used for analysis. The professional investigators checked the charts of all included patients and determined whether the MEWS was documented and calculated correctly. We discarded all the incomplete data sets of vital signs and only included the complete set of vital signs measured at a given time, including respiratory rate (RR), heart rate (HR), systolic blood pressure (SBP), and temperature (TEM). Scores were recalculated by investigators using available data in the charts. Moreover, we found out all the patients’ post-operation regression and then calculated the relationship between the scores and the regression.
Follow-up
If the post-Whipple patients have bleeding, infection, pancreatic leakage, bile leakage, intestinal leakage, gastric emptying disorder, hypoalbuminemia, ICU admission, or died, we defined them has postoperative complications. All patients admitted during the study period were followed up from admission to final events after inclusion. Also, patients were followed up for 30 days after discharge to obtain information about the last events.
Advanced models
To further verify the accuracy of the MEWS, we used some more advanced models and algorithms for verification. It is necessary for a dichotomous problem to judge whether the patient with or without adverse events is based on the patient’s vital parameters. We divided the database, which includes 13,651 sets of vital parameters, into a 75% training set (n=10,238) and a 25% test set (n=3,413). By learning the known sample training set, the binary classification algorithm finds the classification rules and predict the category of new data. At present, there are classification algorithms such as support vector machine (SVM), backpropagation (BP) artificial neural network (ANN), decision tree (DT), and so on.
SVM model
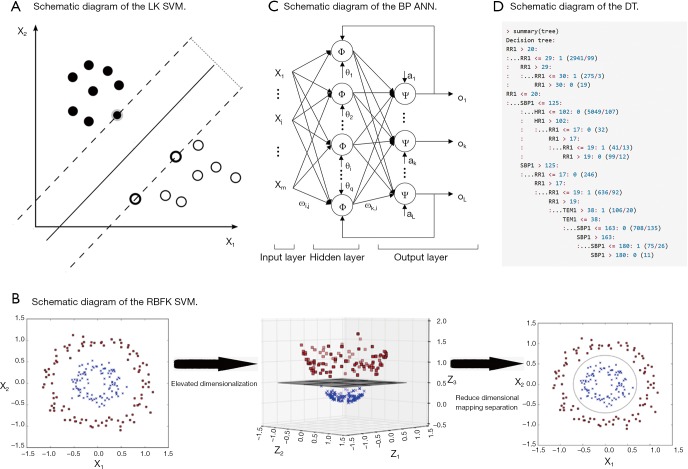
SVM is used to solve the problem of linear separability (Figure 1A). If in the case the data is linearly inseparable, SVM will move from a low-dimension input space to a higher dimension space using a nonlinear mapping algorithm (Figure 1B). The use of a higher dimension makes a linear analysis of nonlinear characteristics in the sample possible. It is also based on the structural risk minimization theory to construct the best hyperplane in the feature space so that the learner is globally optimized, and the expectation in the entire sample space meets specific upper bound with some probability. We set up the RR, HR, SBP, and TEM as vectors in four different dimensions. Each set of data has four different vectors and one outcome variable.
Figure 1.
Schematic diagram of the advanced mathematical models. (A) Schematic diagram of the LK SVM; (B) schematic diagram of the RBFK SVM; (C) BP ANN model predicts exact patient regression based on MEWS. “ω” means weights, “θ” means threshold, “φ” and “ψ” means different logical activation function, “ο” means outcome, “i” and “k” means different nodes, m =4, q =5, L =1 in our study; (D) the decision tree of the training set. LK, linear kernel; SVM, support vector machine; RBFK, radial basis function kernel; BP, backpropagation; ANN, artificial neural network; MEWS, modified early warning score.
ANN model
BP ANN is a multilayer feedforward network trained by error BP (Figure 1C). Its basic premise is a gradient descent method. The basic BP algorithm includes the forward propagation of signal and backward propagation of error. The error output is calculated in the direction from input to output, while the weight and threshold are adjusted in the direction from output to input. In the forward propagation, the input signal acts on the output node through a hidden layer. After the nonlinear transformation, the output signal is generated. The error BP is transmitted back to the output error back layer by layer to the input layer through the hidden layer and distributes the error to all the units in each segment. By adjusting the connection strength of the input node and hidden layer node, and the connection strength and threshold value of the hidden layer node and the output node, the error decreases along the gradient direction. After repeated learning and training, the network parameters (weights and thresholds) corresponding to the minimum error are determined, and the practice is stopped. At this point, the trained neural network can process the non-linear transformation information with the minimum output error for the input information of similar samples.
A neural network with a single hidden layer is modeled using the R language n-net package. Four input layer neuron nodes were set according to the four factors of RR, HR, SBP, and TEM. A three-layer neural network with a hidden layer can already approach any nonlinear function, so setting a hidden layer can simplify the calculation process of the model and achieve a better prediction effect (the number of nodes in a single hidden layer, which called “size” is 5). The hidden layer and the output layer use a logical activation function. The activation function is a Tansig function, and its expression is f(x)=2/(1+e^(-2x))-1. The patient’s critical scores and eventual regression identification is a binary classification problem, so the output layer has a neuron node.
DT model
DT is a decision analysis method based on the known likelihood of various situations. It is used to calculate the probability of net present value greater than or equal to zero to evaluate project risk and to judge its feasibility. The DT consisted of a series of nodes from the top of the tree to the root node at the start, and each node is a decision or split points. According to the input value a condition is set, if the vital parameters meet the conditions, the left or the right path is taken. This process continues until the screening of all states for all the inner nodes is complete and reaches the bottom leaf nodes; the output of a certain value is our forecast results. We use the C5.0 algorithm to construct the DT, which was evaluated on training data (n=10,238, Figure 1D). The system selected size of 13, and of the cases, there are about 507 errors that account for 5%.
Statistical analysis
Descriptive characteristics and frequencies were calculated in SPSS version 22.0. The SVM, BP ANN, and DT models were built and tested using Rstudio 3.5.1 for Windows 64-bit. Continuous variables are summarized by mean and standard deviation since data were distributed normally. There was a minute number of untruthful parameters in the database, and these parameters were normal.
We defined the RR, HR, SBP, and TEM as four variables, and used the SVM, ANN, and DT models to analyze the combination between the MaxScores and final events in each group’s variables. We take the accuracy, sensitivity, specificity, positive predictive value (PPV), negative predictive value (NPV), type I error, type II error, the area under the curve (AUC) as the evaluation indexes of the models.
Prospective confirmatory study
Then from Apr. 2015 to Sep. 2017, we used the MEWS to predict the incidence of postoperative complications according to the 2,211 integrated vital parameters of 79 post-Whipple patients, which allowed us to detect and intervene in the patients’ abnormalities at once. According to the procedure of the retrospective study, we analyzed the prospective study in the same way.
Results
Patient characteristics
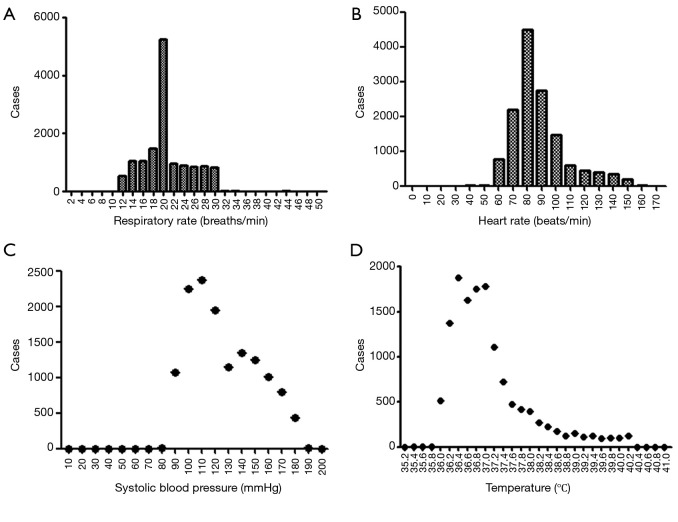
From January 2000 to March 2015, a total of 236 patients comprising 13,651 groups of integrated vital parameters, participated in a 183-month inclusion period of historical statistics (Figure 2 and Table S1).
Figure 2.
The frequency distribution of vital parameters in post-Whipple patients in the retrospective study (n=13,651).
Table S1. Patient characteristics in retrospective study.
| Patient characteristics | Value |
|---|---|
| Characteristic proportion (n=236), % | |
| Gender1 (man:woman) | 58.5:41.5 |
| Diagnose1 (pancreatic cancer: periampullary carcinoma:neither) | 25.8:60.6:13.6 |
| Characteristic parameters (n=236), mean ± SD | |
| Age1 (years) | 57.97±11.12 |
| Preoperative TB1 (μmol/L) | 122.17±116.77 |
| Postoperative TB1 (μmol/L) | 45.74±41.18 |
| Preoperative WBC1 (×109/L) | 13.84±5.10 |
| Postoperative WBC1 (×109/L) | 10.67±5.86 |
| Preoperative RBC1 (×1012/L) | 3.54±0.66 |
| Postoperative RBC1 (×1012/L) | 3.43±0.51 |
| Preoperative Hb1 (g/L) | 105.61±20.91 |
| Postoperative Hb1 (g/L) | 98.28±22.80 |
| Preoperative ALB1 (g/L) | 28.78±19.45 |
| Postoperative ALB1 (g/L) | 35.05±9.92 |
| Preoperative GLU1 (mmol/L) | 10.55±4.01 |
| Postoperative GLU1 (mmol/L) | 7.34±3.57 |
| Vital parameters (n=13,651), mean ± SD | |
| RR1 (breaths/min) | 20.25±4.48 |
| HR1 (beats/min) | 87.64±18.85 |
| SBP1 (mmHg) | 125.44±24.94 |
| TEM1 (°C) | 37.16±0.88 |
SD, standard deviation; TB, total bilirubin; WBC, white blood cell count; RBC, red blood cell count; Hb, hemoglobin; ALB, albumin; GLU, glucose; RR, respiratory rate; HR, heart rate; SBP, systolic blood pressure; TEM, temperature.
MEWS protocol in our institution
Four basic vital parameters were considered in an easy-to-use algorithm (Table 1). The range for the MEWS was between 0 and 8. We distributed a protocol card and extensively trained the staff during the implementation of the protocol.
Table 1. MEWS and protocol in Guangdong Provincial People’s Hospital.
| Vital parameters | 2 | 1 | 0 | 1 | 2 |
|---|---|---|---|---|---|
| Respiratory rate (breaths/min) | <12 | – | 12–20 | – | >20 |
| Heart rate (beats/min) | <50 | 50–60 | 61–100 | 101–110 | >110 |
| Systolic blood pressure (mmHg) | <80 | 80–90 | 91–140 | 141–160 | >160 |
| Temperature (°C) | <35.0 | 35.0–36.1 | 36.2–37.2 | 37.3–38.5 | >38.5 |
1, Determine MEWS→MEWS ≥2 contact clinician on duty; 2, clinician on duty assess patient <30 min and draft a plan for treatment; 3, effect of therapy is analyzed <60 min; 4, if no effect of treatment→clinician on duty or nurse contacts the rapid intervention team (RIT); 5, Document aberrant parameters in the patient’s charts. MEWS, modified early warning score.
Establishment of Max-MEWS
To determine the largest score of this scale, we used the receiver operating characteristic (ROC) curve to observe each value (Figure 3) and found that MEWS =2 was the best choice (Table S2). Consequently, a total score of 2 or higher was considered a critical score. MEWS was calculated by hand and electronically documented on the patients’ charts. Once a patient reached a critical MEWS (≥2), the nurses would contact the doctor on duty at once. The doctor would then assess the patient within 30 minutes, and draft a plan for treatment, evaluate this within 60 minutes, or call a rapid intervention team (RIT).
Figure 3.
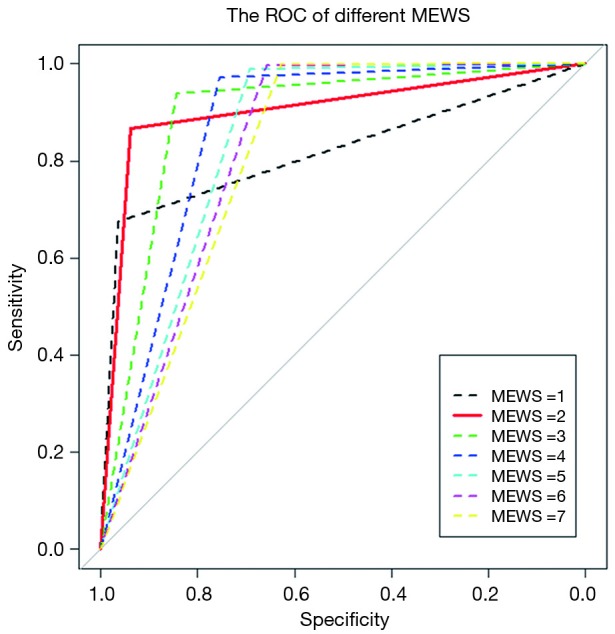
The ROC curves of different MEWS. ROC, receiver operating characteristic; MEWS, modified early warning score.
Table S2. A comparison between the MEWS =2 and MEWS =3.
| Statistical parameters | MEWS =2 | MEWS =3 |
|---|---|---|
| Sensitivity | 0.9088 | 0.7288 |
| Specificity | 0.9085 | 0.9682 |
| Accuracy | 0.9086 | 0.8729 |
| Area under curve (AUC) | 0.9028 | 0.8909 |
MEWS, modified early warning score.
Measuring and documentation
There was a total of 13,651 sets of data included in the retrospective observational study. Figure 4 displays a flowchart of the measurement and documentation. After the frequency analysis of the data, MEWS was set up according to the results obtained, and the number of people with different scores and different outcomes was calculated. Then we set up the distribution of the confusion matrix under MEWS in the retrospective study (Table S3).
Figure 4.
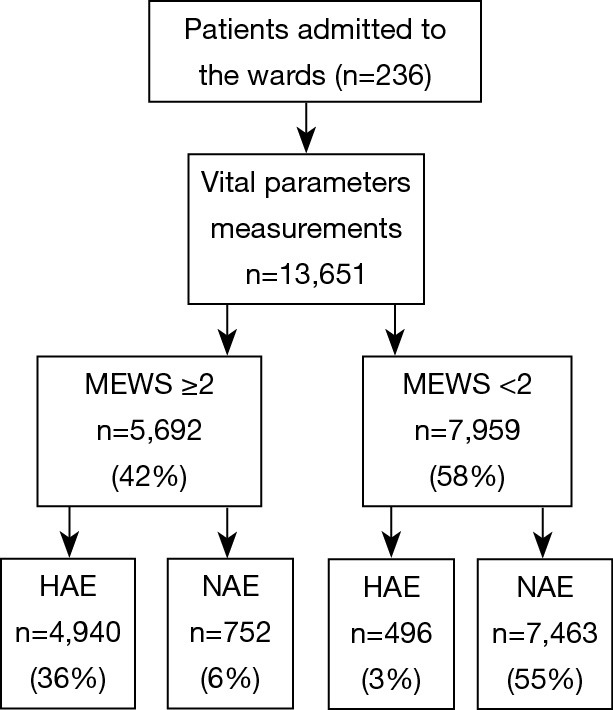
A flowchart of the measurement and documentation. MEWS, modified early warning score; HAE, have adverse events; NAE, no adverse events.
Table S3. The distribution of the confusion matrix under MEWS in the retrospective study (n=13,651).
| MEWS | MEWS ≥2 | MEWS <2 | Total |
|---|---|---|---|
| HAE | 4,940 | 496 | 5,436 |
| NAE | 752 | 7,463 | 8,215 |
| Total | 5,692 | 7,959 | 13,651 |
MEWS, modified early warning score; HAE, have adverse events; NAE, no adverse events.
Models calculation
According to Table 2, the prediction accuracy of MEWS is up to 90.86%, sensitivity is 90.88%, specificity is 90.85%, type I error is 9.15%, and type II error is 9.12%.
Table 2. The relevant evaluation indexes of MEWS, SVM, BP ANN, and DT models were evaluated.
| Statistical parameters | Retro-MEWS | Retro-LK SVM | Retro-RBFK SVM | Retro-BP ANN | Retro-DT | Pro-MEWS | Pro-LK SVM | Pro-RBFK SVM | Pro-BP ANN | Pro-DT |
|---|---|---|---|---|---|---|---|---|---|---|
| Accuracy | 0.9086 | 0.9036 | 0.9203 | 0.9256 | 0.9499 | 0.9123 | 0.8856 | 0.9154 | 0.9177 | 0.9561 |
| Sensitivity | 0.9088 | 0.8597 | 0.8744 | 0.8905 | 0.9353 | 0.8304 | 0.7653 | 0.7870 | 0.8138 | 0.9056 |
| Specificity | 0.9085 | 0.9327 | 0.9508 | 0.9488 | 0.9596 | 0.9573 | 0.9516 | 0.9860 | 0.9748 | 0.9839 |
| PPV | 0.8679 | 0.8945 | 0.9218 | 0.9203 | 0.9388 | 0.9143 | 0.8969 | 0.9686 | 0.9466 | 0.9686 |
| NPV | 0.9379 | 0.9093 | 0.9194 | 0.9289 | 0.9572 | 0.9113 | 0.8807 | 0.8939 | 0.9050 | 0.9499 |
| Type I error | 0.0915 | 0.0673 | 0.0492 | 0.0512 | 0.0404 | 0.0427 | 0.0484 | 0.0140 | 0.0252 | 0.0161 |
| Type II error | 0.0912 | 0.1403 | 0.1256 | 0.1095 | 0.0647 | 0.1696 | 0.2347 | 0.2130 | 0.1862 | 0.0944 |
| AUC | 0.9028 | 0.9019 | 0.9206 | 0.9246 | 0.9480 | 0.9128 | 0.8888 | 0.9313 | 0.9258 | 0.9593 |
MEWS, modified early warning score; LK, linear kernel; SVM, support vector machine; RBFK, radial basis function kernel; BP, backpropagation; ANN, artificial neural network; DT, decision tree; PPV, positive predictive value; NPV, negative predictive value; AUC, area under the curve.
The prediction accuracy of the linear kernel (LK) SVM model was about 90.36%, the sensitivity was about 85.97%, and the specificity was about 93.27% (Table 2). To improve the quality of the SVM model, we used the radial basis function kernel (RBFK) SVM model and calculated the similar evaluation index (Table 2). The prediction accuracy of the RBFK SVM model was about 92.03%, the sensitivity was about 87.44%, and the specificity was about 95.08%. Finally, we have set up the corresponding confusion matrix (Table S4).
Table S4. The distribution of the confusion matrix of the LK SVM and RBFK SVM models under the test set (n=3,413).
| Outcomes | LK SVM | RBFK SVM | |||
|---|---|---|---|---|---|
| Pred-HAE | Pred-NAE | Pred-HAE | Pred-NAE | ||
| HAE | 1,170 | 191 | 1,190 | 171 | |
| NAE | 138 | 1,914 | 101 | 1,951 | |
LK, linear kernel; SVM, support vector machine; RBFK, radial basis function kernel; HAE, have adverse events; NAE, no adverse events.
The accuracy of the neural network model and other indicators are highly volatile and have a wide range of fluctuations, and the training time of the model is much longer than that of the MEWS. Selecting a neural network model with accuracy near the median can represent the general situation of the neural network model under the existing parameter settings. We ran the BP ANN model 200 times to get the best solution and get the characteristic of each evaluation indicator (Table S5). The prediction accuracy of the BP ANN is about 92.56%, and the sensitivity is about 89.05%, the specificity is about 94.88%. The confusion matrix is obtained on the test set (Table S6).
Table S5. The characteristic of each evaluation indicator is shown in BP ANN model (n=10,238).
| Statistical parameters | Accuracy | Sensitivity | Specificity | PPV | NPV | Type I error | Type II error |
|---|---|---|---|---|---|---|---|
| Median | 0.9256 | 0.8935 | 0.9493 | 0.9209 | 0.9306 | 0.0507 | 0.1065 |
| Mean | 0.9194 | 0.8737 | 0.9497 | 0.9215 | 0.9244 | 0.0503 | 0.1263 |
| Min | 0.6015 | 0.0007 | 0.8728 | 0.6217 | 0.6014 | 0 | 0.0720 |
| Max | 0.9517 | 0.9280 | 1 | 1 | 0.9529 | 0.1272 | 0.9993 |
BP, backpropagation; ANN, artificial neural network; PPV, positive predictive value; NPV, negative predictive value.
Table S6. The distribution of the confusion matrix under the BP ANN model of the test set (n=3,413).
| BP ANN | Pred-HAE | Pred-NAE |
|---|---|---|
| HAE | 1,212 | 149 |
| NAE | 105 | 1,947 |
BP, backpropagation; ANN, artificial neural network; HAE, have adverse events; NAE, no adverse events.
In machine learning, a DT is a predictive model that represents a mapping relationship between object attributes and object values. Because DT is a decision analysis method based on the known likelihood of various situations, so from the ROC curve and seven indicators, the accuracy, sensitivity, specificity, PPV, and NPV of the DT model were higher than the other four models, while type I error and Type II where are lower than the other four models (Table 2 and Figure 5). The DT also gives the corresponding confusion matrix (Table S7). We can consider DT as a “more advanced MEWS”.
Figure 5.
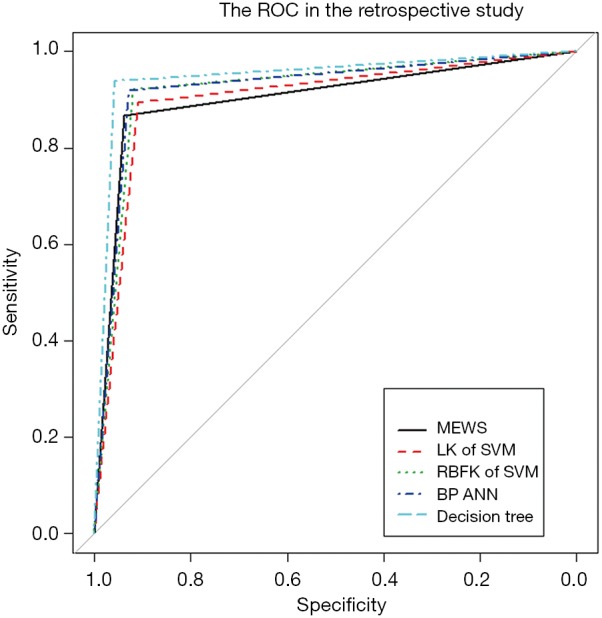
The ROC of the five models in the retrospective observational study. ROC, receiver operating characteristic; MEWS, modified early warning score; LK, linear kernel; SVM, support vector machine; RBFK, radial basis function kernel; BP, backpropagation; ANN, artificial neural network.
Table S7. The distribution of the confusion matrix under the DT model of training the set (n=10,238).
| Decision tree | Pred-HAE | Pred-NAE |
|---|---|---|
| HAE | 3,821 | 254 |
| NAE | 253 | 5,910 |
DT, decision tree; HAE, have adverse events; NAE, no adverse events.
Prospective confirmatory study
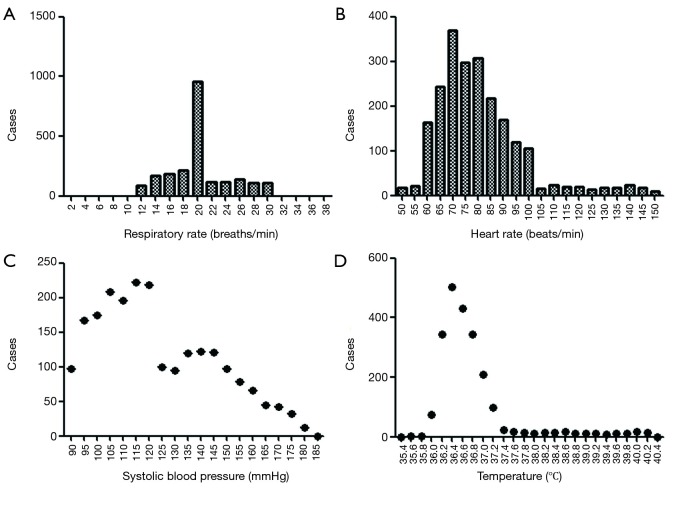
We investigated the patient characteristics of the prospective study (Table S8) and drew the corresponding frequency distribution diagram (Figure 6). Moreover, we drew a ROC and calculated each statistical parameter to find the optimal solution in the prospective confirmatory studies between MEWS, SVM, BP ANN, and DT (Figure 7 and Table 2).
Table S8. Patient characteristics in prospective study.
| Patient characteristics | Value |
|---|---|
| Characteristic proportion (n=79), % | |
| Gender2 (man:woman) | 58.2:41.8 |
| Diagnose2 (pancreatic cancer: periampullary carcinoma:neither) | 30.4:41.8:27.8 |
| Characteristic parameters (n=79), mean ± SD | |
| Age2 (years) | 60.18±11.54 |
| Preoperative TB2 (μmol/L) | 83.19±79.85 |
| Postoperative TB2 (μmol/L) | 50.15±50.11 |
| Preoperative WBC2 (×109/L) | 12.16±4.86 |
| Postoperative WBC2 (×109/L) | 10.05±3.77 |
| Preoperative RBC2 (×1012/L) | 3.93±0.66 |
| Postoperative RBC2 (×1012/L) | 3.62±0.48 |
| Preoperative Hb2 (g/L) | 113.71±16.53 |
| Postoperative Hb2 (g/L) | 106.30±14.10 |
| Preoperative ALB2 (g/L) | 32.68±5.00 |
| Postoperative ALB2 (g/L) | 36.16±5.36 |
| Preoperative GLU2 (mmol/L) | 9.13±3.41 |
| Postoperative GLU2 (mmol/L) | 9.05±3.85 |
| Vital parameters (n=2,211), mean ± SD | |
| RR2 (breaths/min) | 19.97±4.31 |
| HR2 (beats/min) | 80.86±17.71 |
| SBP2 (mmHg) | 123.10±22.28 |
| TEM2 (°C) | 36.80±0.74 |
SD, standard deviation; TB, total bilirubin; WBC, white blood cell count; RBC, red blood cell count; Hb, hemoglobin; ALB, albumin; GLU, glucose; RR, respiratory rate; HR, heart rate; SBP, systolic blood pressure; TEM, temperature.
Figure 6.
The frequency distribution of vital parameters in the prospective study (n=2,211).
Figure 7.
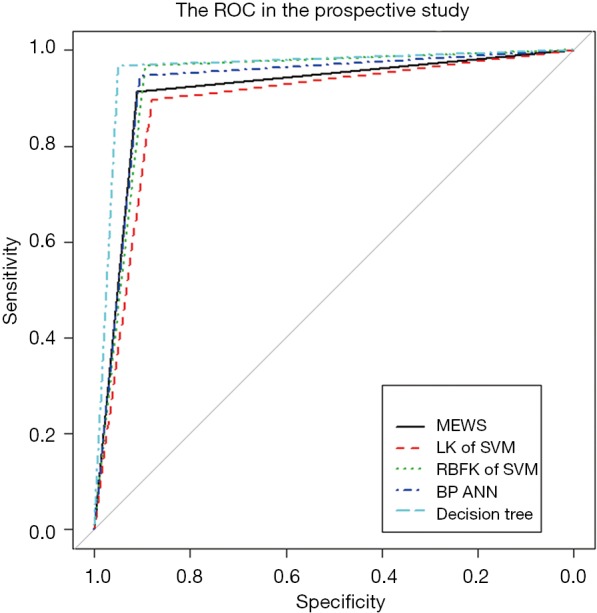
The ROC of the five models in the prospective confirmatory study. ROC, receiver operating characteristic; MEWS, modified early warning score; LK, linear kernel; SVM, support vector machine; RBFK, radial basis function kernel; BP, backpropagation; ANN, artificial neural network.
Discussion
To able to ignore the individual errors arising from measuring vital parameters at various times caused by the fluctuation of the diverse human body, we used big data to generate a conclusion. At a large, Chinese government hospital, we used the MEWS to accurately predict postoperative outcome in 90.86–91.23% of general surgery ward post-Whipple patients. We found that MEWS was a sensitive predictor of adverse events in patients; patients with a MEWS ≥2 were prone to complications such as bleeding, infection, leakage, gastric emptying disorder, hypoalbuminemia, and so on. With a MEWS <2, the patient usually recovered and was discharged within 2 weeks after surgery.
The LK SVM model involves a parameter related to the model error budget, called “cost”. According to Table S9, we discover that adjusting the cost parameters will not fundamentally improve the fitting quality, but significantly increase the training cost. Therefore, we take cost =1 and build the confusion matrix of the LK SVM. To improve the quality of the SVM model, we used a positive gamma parameter for nonlinear computing. The gamma parameter is used to control the locality of similarity calculated between its two vector inputs. If the gamma value is too significant, it is easy to produce an amount close to 0, and if the gamma value is too small, it is easy to include more distant vectors in the calculation. To balance the bias and the variance, we take cost =1 and gamma =1 for the RBFK SVM model.
Table S9. Different statistical parameters under different cost parameters.
| Statistical parameters | 0.01 | 0.1 | 1 | 10 | 100 | 1000 |
|---|---|---|---|---|---|---|
| Training accuracy | 0.900566517 | 0.900957218 | 0.901640945 | 0.90134792 | 0.90154327 | 0.90134792 |
| Test accuracy | 0.900966891 | 0.90331087 | 0.903603868 | 0.903603868 | 0.903603868 | 0.90448286 |
| Sensitivity | 0.850844967 | 0.857457752 | 0.859662013 | 0.859662013 | 0.859662013 | 0.859662013 |
| Specificity | 0.934210526 | 0.933723197 | 0.932748538 | 0.932748538 | 0.932748538 | 0.934210526 |
Because the neural network contains a random component in the form of weight vector initialization, it is unlikely to obtain the same result after repeated use of the neural network, even if the obtained BP ANN model does not converge and cannot be used for the “bi-directional early warning study”.
The MEWS we designed judged the four parameters, which could be considered as equally essential and then sum them up to determine whether the result of the post-Whipple patients was have adverse events (HAE) or no adverse events (NAE). The DT model shows the relative importance of four indexes in the classification process step by step. If the degree of RR1 used is considered 100%, then the degrees of SBP1, HR1, and TEM1 used are 68.40%, 51.00%, and 8.79%, respectively. As can be seen from the DT graph, RR1 is more often used than other indexes in the classification process. The DT is similar in form to MEWS, and it judges the range based on each index value, and then makes the next step. However, the DT also considers the importance between the different indexes in the classification process, so it has high prediction accuracy.
We used five models to evaluate retrospective observational studies, so we drew a ROC to find the best solution between MEWS, SVM, BP ANN, and DT. It is clear that the MEWS was the easiest to use, and its AUC on the test set was equal to that of the LK SVM (about 90%). The accuracy of RBFK SVM and BP ANN models on the test set (about 92%) was higher than that of the MEWS, but from the perspective of sensitivity, the MEWS had the highest sensitivity of the four models above. The DT had both the high prediction accuracy and specificity of LK SVM, RBFK SVM, and BP ANN and the high sensitivity of the MEWS model. However, the simplicity of the DT model was still not as good as the MEWS in real-time processing, and some decision paths (from the root node to leaf node) of the DT model reuse the same variable, which also reduces the convenience of use.
Five models were trained from the retrospective observational study data set, and it was concluded that the MEWS was workable and straightforward, with high accuracy and sensitivity at the same time.
In prospective confirmatory studies, as an advanced MEWS, the DT still performed well among the statistical parameters. In contrast, LK SVM was the least correct in predicting post-Whipple complications of the five models in prospective studies. It is worth mentioning that RBFK SVM had the highest specificity (98.60%, followed by DT 98.39%) and the lowest type I error (1.40%, followed by DT 1.61%) in prospective studies. However, this was not our primary outcome measure, because our focus in setting up a MEWS was to identify patients with a potential risk of post-Whipple complications, rather than patients without postoperative complications but with intensive intervention. Therefore, the scale we designed should have high sensitivity and a lower type II error. The MEWS was in line with our expectations, with a high sensitivity of 83.04% and a small type II error of 16.96%, only inferior to DT and leading the other three advanced mathematical models. DT is still the most correct model that best conforms to the prediction of post-Whipple complications of patients due to its unique advantages of enumerating all permutations. However, there is no doubt that the use of DT has a high technical threshold and computing cost. The MEWS, with its simple and convenient operation, high sensitivity, and low type II errors comparable to the advanced mathematical models, will be the preferred model for medical staff to identify patients with postoperative complications in the first instance from the hospital bed.
The strengths of our study include its ambispective and observational design, and a large number of patient samples examined. We applied the MEWS across all adult post-Whipple surgical patients in Guangdong’s largest government hospital, where the burden of illness, patient volume, and limited resources underscore the immense challenges of delivering added attention and management of medical personnel.
The study has several limitations. We evaluated only one significant adverse outcome: the presence of postoperative complications. Other studies of early warning scores among hospital inpatients have evaluated specific patient-important outcomes, including ICU admission and cardiac arrest. Moreover, our object of study was limited to post-Whipple patients in the general surgery ward. If we had extended the scoring to patients from more departments and more disease types, the results would be more useful, but this was not feasible due to resource restrictions. However, about 5% of a large number of patients in our department has required Whipple surgical treatment in recent years, so this study is of great significance in guiding perioperative patient management of Whipple surgery in general surgery wards around the world.
In published papers, most of the studies are retrospective analyses (3,7,8,10-13), and only a few are prospective studies (14-16). Most of the current publications are still used to assess whether patients need to be transferred to the ICU (14), and some of them are used for predicting the outcome of in-hospital cardiac arrest (12). Age was associated with an increase in the risk of death, and being on a medical ward rather than a surgical ward was associated with an increase in the risk of death (3). End-tidal CO2 (EtCO2) was another independent predictor of critical illness (17). The MEWS from all over the world have a sensitivity which generally fluctuates between 72.4% and 95.5%, and a specificity which fluctuates between 83.0% and 90.8% (11,14,16).
Timely identification of critical illness is a vital step towards establishing its overall burden in low-resource settings. This step can lay the foundation to evaluate interventions that minimize morbidity and mortality. Although Churpek’s team found that several machine learning methods were more accurate for predicting clinical deterioration on the wards (18), guidelines and protocols used in high-income settings can be challenging to translate to settings with fewer resources, diverse patient populations, and various disease phenotypes. The MEWS, a simple scoring system formed of patients’ vital signs, is an approach that can perform measurements at the bedside with minimal resources.
Conclusions
Our study performed in a real-life setting, and we proved that a MEWS ≥2 was a strong predictor of adverse events in post-Whipple patients. Also, we assessed the ability of MEWS to predict postoperative complications with an accuracy rate of 90.86–91.23%, a sensitivity of 83.04–90.88%, and a specificity of 90.85–95.73%. The results attest to the reliability of our MEWS as a screening tool. In comparison to similar studies around the world, our study used both retrospective observational studies and prospective confirmatory studies.
Additionally, most studies have previously focused on the use of MEWS to assess criteria for patient access to the ICU, and we are the first international study to predict and check postoperative complications. Moreover, we used a tremendous amount of data, and the data we included came from different time points during the hospitalization of patients. This is also the first international study of MEWS using the data of vital signs measured at random times, which makes the clinical application more accessible and more efficient. Finally, our project is the first attempt to use MEWS as a prognostic indicator in postoperative patients. It is inexpensive, convenient, and less invasive than any scoring system used in other papers. The predictive values of MEWS in this study are comparable to the advanced mathematical models, but MEWS is more convenient, accessible, and more applicable.
Acknowledgments
Funding: This work was supported by grants from the National Science Foundation of Guangdong Province (No. 2016A030313769, No. 2017A030313530), Guangdong Province Public Interest Research and Capacity - Building Projects (No. 2014A020212448), the National Natural Science Foundation of China (No. 81701560, No. 81672475), and the Guangzhou Science and Technology Plan of Scientific Research Projects (No. 201510010286, No. 201707010323). Guangdong General Hospital Green Seedling Project for Min Yu.
Ethical Statement: The authors are accountable for all aspects of the work in ensuring that questions related to the accuracy or integrity of any part of the work are appropriately investigated and resolved. The research was in compliance of the Declaration of Helsinki and was approved by the ethical committee of Guangdong Academy of Medical Sciences Medical Center (ID 2017158).
Footnotes
Conflicts of Interest: The authors have no conflicts of interest to declare.
References
- 1.Goldhill DR. The critically ill: following your MEWS. QJM 2001;94:507-10. 10.1093/qjmed/94.10.507 [DOI] [PubMed] [Google Scholar]
- 2.van Galen LS, Dijkstra CC, Ludikhuize J, et al. A Protocolised Once a Day Modified Early Warning Score (MEWS) Measurement Is an Appropriate Screening Tool for Major Adverse Events in a General Hospital Population. PLoS One 2016;11:e0160811. 10.1371/journal.pone.0160811 [DOI] [PMC free article] [PubMed] [Google Scholar]
- 3.Panchagnula U, Thomas AN, Rhodes S. Association between outcome and modified early warning scores: relationship with age and medical discipline. Eur J Anaesthesiol 2008;25:76-7. 10.1017/S0265021507001251 [DOI] [PubMed] [Google Scholar]
- 4.Ssemmanda H, Luggya TS, Lubulwa C, et al. Abnormal Admission Chest X-Ray and MEWS as ICU Outcome Predictors in a Sub-Saharan Tertiary Hospital: A Prospective Observational Study. Crit Care Res Pract 2016;2016:7134854. [DOI] [PMC free article] [PubMed] [Google Scholar]
- 5.Ye JF, Zhao YX, Ju J, et al. Building and verifying a severity prediction model of acute pancreatitis (AP) based on BISAP, MEWS and routine test indexes. Clin Res Hepatol Gastroenterol 2017;41:585-91. 10.1016/j.clinre.2016.11.013 [DOI] [PubMed] [Google Scholar]
- 6.Vorwerk C. MEWS: predicts hospital admission and mortality in emergency department patients. Emerg Med J 2009;26:466. 10.1136/emj.2008.069062 [DOI] [PubMed] [Google Scholar]
- 7.Moon A, Cosgrove JF, Lea D, et al. An eight year audit before and after the introduction of modified early warning score (MEWS) charts, of patients admitted to a tertiary referral intensive care unit after CPR. Resuscitation 2011;82:150-4. 10.1016/j.resuscitation.2010.09.480 [DOI] [PubMed] [Google Scholar]
- 8.Heller AR, Mees ST, Lauterwald B, et al. Detection of Deteriorating Patients on Surgical Wards Outside the ICU by an Automated MEWS-Based Early Warning System With Paging Functionality. Ann Surg 2018. [Epub ahead of print]. 10.1097/SLA.0000000000002830 [DOI] [PubMed] [Google Scholar]
- 9.Patel A, Hassan S, Ullah A, et al. Early triaging using the Modified Early Warning Score (MEWS) and dedicated emergency teams leads to improved clinical outcomes in acute emergencies. Clin Med (Lond) 2015;15 Suppl 3:s3. 10.7861/clinmedicine.15-3-s3 [DOI] [PubMed] [Google Scholar]
- 10.Jouffroy R, Saade A, Ellouze S, et al. Prehospital triage of septic patients at the SAMU regulation: Comparison of qSOFA, MRST, MEWS and PRESEP scores. Am J Emerg Med 2018;36:820-4. 10.1016/j.ajem.2017.10.030 [DOI] [PubMed] [Google Scholar]
- 11.Fullerton JN, Price CL, Silvey NE, et al. Is the Modified Early Warning Score (MEWS) superior to clinician judgement in detecting critical illness in the pre-hospital environment? Resuscitation 2012;83:557-62. 10.1016/j.resuscitation.2012.01.004 [DOI] [PubMed] [Google Scholar]
- 12.Wang AY, Fang CC, Chen SC, et al. Periarrest Modified Early Warning Score (MEWS) predicts the outcome of in-hospital cardiac arrest. J Formos Med Assoc 2016;115:76-82. 10.1016/j.jfma.2015.10.016 [DOI] [PubMed] [Google Scholar]
- 13.van der Woude SW, van Doormaal FF, Hutten BA, et al. Classifying sepsis patients in the emergency department using SIRS, qSOFA or MEWS. Neth J Med 2018;76:158-66. [PubMed] [Google Scholar]
- 14.Gardner-Thorpe J, Love N, Wrightson J, et al. The value of Modified Early Warning Score (MEWS) in surgical in-patients: a prospective observational study. Ann R Coll Surg Engl 2006;88:571-5. 10.1308/003588406X130615 [DOI] [PMC free article] [PubMed] [Google Scholar]
- 15.Lee LL, Yeung KL, Lo WY, et al. Evaluation of a simplified therapeutic intervention scoring system (TISS-28) and the modified early warning score (MEWS) in predicting physiological deterioration during inter-facility transport. Resuscitation 2008;76:47-51. 10.1016/j.resuscitation.2007.07.005 [DOI] [PubMed] [Google Scholar]
- 16.Suppiah A, Malde D, Arab T, et al. The Modified Early Warning Score (MEWS): an instant physiological prognostic indicator of poor outcome in acute pancreatitis. JOP 2014;15:569-76. [DOI] [PubMed] [Google Scholar]
- 17.Blankush JM, Freeman R, McIlvaine J, et al. Implementation of a novel postoperative monitoring system using automated Modified Early Warning Scores (MEWS) incorporating end-tidal capnography. J Clin Monit Comput 2017;31:1081-92. 10.1007/s10877-016-9943-4 [DOI] [PubMed] [Google Scholar]
- 18.Churpek MM, Yuen TC, Winslow C, et al. Multicenter Comparison of Machine Learning Methods and Conventional Regression for Predicting Clinical Deterioration on the Wards. Crit Care Med 2016;44:368-74. 10.1097/CCM.0000000000001571 [DOI] [PMC free article] [PubMed] [Google Scholar]


