

Abstract
Chondroitin sulfates (CS) are long, negatively charged, unbranched glycosaminoglycan (GAG) chains attached to CS-proteoglycan (CSPG) core proteins that comprise the glycan component in both loose interstitial extracellular matrices (ECMs) and in rigid, structured perineuronal net (PNN) scaffolds within the brain. As aberrant CS-PNN formations have been linked to a range of pathological states, including Alzheimer’s disease (AD) and schizophrenia, the analysis of CS-GAGs in brain tissue at the disaccharide level has great potential to enhance disease diagnosis and prognosis. Two mass-spectrometry (MS)-based approaches were adapted to detect CS disaccharides from minute fixed tissue samples with low picomolar sensitivity and high reproducibility. The first approach employed a straightforward, quantitative direct infusion (DI)-tandem mass spectrometry (MS/MS) technique to determine the percentages of Δ4S- and Δ6S-CS disaccharides within the 4S/6S-CS ratio, while the second used a comprehensive liquid chromatography (LC)–MS/MS technique to determine the relative percentages of Δ0S-, Δ4S-, Δ6S-, Δ4S6S-CS and Δ2S6S-CS disaccharides, with internal validation by full chondroitin lyase activity. The quantitative accuracy of the five primary biologically relevant CS disaccharides was validated using a developmental time course series in fixed rodent brain tissue. We then analyzed the CS disaccharide composition in formalin-fixed human brain tissue, thus providing the first quantitative report of CS sulfation patterns in the human brain. The ability to comprehensively analyze the CS disaccharide composition from fixed brain tissue provides a means with which to identify alterations in the CS-GAG composition in relation to the onset and/or progression of neurological diseases.
Keywords: chondroitin sulfate, extracellular matrix, glycosaminoglycan, mass spectrometry, perineuronal nets
Introduction
The adult brain consists of three main types of extracellular matrices: the basement membrane, the neural interstitial matrix and perineuronal nets (PNNs) (Lau et al. 2013). Together, these matrices provide dynamic extracellular matrix (ECM) scaffolding for structural support and recognition signaling within the central nervous system (CNS) microenvironment. The glycan component of basement membranes, composed mainly of collagens, laminins and glycosaminoglycan (GAG) chains, form specialized sheet-like ECM barriers at the boundary between the brain parenchymal and the vascular endothelium unit (Lau et al. 2013; Zlokovic 2008). The loose but fiber-dense interstitial ECM disperses into the CNS parenchyma and fills the gaps between cells. Meanwhile, PNNs are rigid, honeycomb-shaped ECM structures that interpose between the neuronal cell surface and astrocytic processes and function to limit plasticity, thereby stabilizing the long-term connections between neural networks (Blumcke et al. 1995; Bruckner et al. 1993).
Repeating disaccharide units of chondroitin sulfates (CSs) and heparan sulfates (HSs) make up the long, negatively charged GAG chains that are covalently attached to proteoglycan core proteins to form CS proteoglycans (CSPGs) and HS proteoglycans (HSPGs), respectively (Sorg et al. 2016). Although both CS-GAGs and HS-GAGs are integral glycan components in brain ECM, their abundance relative to one another differs based on developmental stage, matrix subtype and other factors. In the CNS, the ratio of CSs to HSs within the loose interstitial ECM is 1:9; however, this ratio shifts to 1:2.3 in the CS-GAG dense PNNs (Deepa et al. 2006). The shift from HSs to CSs in PNNs is predicted to influence matrix scaffolding, integrity and neural circuit stability (Giamanco and Matthews 2012; Horii-Hayashi et al. 2015; Kwok et al. 2015).
During critical periods (CPs) of postnatal development, neural circuits exhibit heightened plasticity in response to stimulatory input from external cues that drive neurocircuit organization (Hensch 2005). It is during CP closure that CS-enriched PNNs mature and, once formed, function to limit further remodeling of the enmeshed neurocircuits, thereby stabilizing throughout adulthood the neurocircuit connectivity established during development (Beurdeley et al. 2012). These PNN lattices surround the soma and proximal neurites of the enmeshed neurons and the CS-GAG chains, which are composed of repeating disaccharide units of glucuronic acid (GlcA) and N-acetylgalactosamine (GalNAc), are attached to CSPG core proteins that constitute the PNN honeycomb matrix (Kwok et al. 2015).
Changes in the biochemical composition and stability of PNNs not only are restricted to the developmental CP but also can occur during adulthood in response to injury, inflammation, repair, neurodegeneration and aging in ways that can substantially alter both the plasticity and function of the underlying enmeshed neurons and their associated neurocircuits (Kwok et al. 2011; Miyata and Kitagawa 2015; Miyata and Kitagawa 2016; Miyata et al. 2012). The degree of CS-sulfation influences ECM physiochemical properties by affecting CS-mediated ion buffering, diffusion parameters and binding of extracellular regulatory factors (Bruckner et al. 1993). Loss of CS-based PNNs is widespread in the brains of patients diagnosed with Alzheimer’s disease and schizophrenia, potentially contributing to associated network dysfunction and resultant cognitive deficits in affected individuals (Testa et al. 2019). Recently, we reported aberrant PNN abundance in the hypothalamus of hyperglycemic ob/ob mice, implying a possible role for PNNs in brain control of energy balance and glucose homeostasis, in addition to their known roles in learning, vision, cognition and other key functions (Mirzadeh et al. 2019; Sethi and Zaia 2017). Changes in PNN composition are mediated by the secretion of select CSPGs, CS-GAGs and matrix scaffolding factors by glial cells, while the enmeshed neurons themselves further stabilize PNN architecture by secreting additional CSPGs as well as hyaluronan (HA) and other matrix molecules (Carulli et al. 2010; Carulli et al. 2006; Kwok et al. 2010; Siddiqui et al. 2009).
Multiple methodologies have been used to measure the CS-GAG composition in fresh biological samples. These include high-performance liquid chromatography (HPLC), mass spectrometry (MS), tandem MS (MS/MS) and fluorophore-assisted capillary electrophoresis (FACE) (Desaire and Leary 2000; Kubaski et al. 2017; Osago et al. 2014; Shao et al. 2013), and similar approaches have also been applied to measure the HS-GAG composition from fresh biological samples (Antia et al. 2018; Antia et al. 2017; Osago et al. 2014; Saad and Leary 2003; Schenauer et al. 2009; Shao et al. 2013; Wei et al. 2011). Although these techniques provide valuable information on CS- and HS-GAG composition, the requirement for large quantities of fresh starting material has hindered its translation to clinical investigation, where fresh human brain tissue is rarely available. Consequently, these methodologies for GAG characterization have been validated only in animal models and, to our knowledge, have not been successfully adapted to human brain tissue analysis.
In contrast to fresh tissue analysis, traditional methods for CS-based ECM analysis in fixed brain tissues is largely dependent on immunohistochemical (IHC) characterization of CS-specific disaccharides. Unfortunately, low concordance rates across IHC-based assays, due in part to the cross-reactivity of CS-specific antibodies and variation in tissue processing, have led to inconsistent conclusions regarding changes in CS-GAG pathological patterns, thereby limiting insight into the role played by the ECM in neurological disease (Deepa et al. 2007; Ito et al. 2005; Miyata et al. 2012; Sugiura et al. 2012; Yi et al. 2012). Recently, a novel methodology for the extraction of CSs and HSs from FFPE mouse brain sections was described (Turiák et al. 2014). Although this work provides a foundation for CS analysis from fixed brain tissue, this method only detects the presence of monosulfated CS disaccharides (i.e. 4S-CS and 6S-CS) and therefore lacks the ability to differentiate between all CS isomers. Analytical methods enabling biochemical analysis of the full range of biological CS variants from fixed brain tissue that enable quantitative analysis of changes across the complete set of CS disaccharides in postmortem human brain tissue would constitute an important advance for the field of glycobiology in relation to neurological diseases.
To this end, we sought to develop, optimize and validate an approach for the quantitative compositional analysis of all relevant CS disaccharide variants from fixed brain tissue. Here, we outline a sensitive and reproducible MS approach to isolate, detect and quantify five primary CS variants from minute amounts of starting material. We also provide the first report analyzing the complete CS-GAG quantitative characterization in fixed rodent brain tissue and, moreover, provide the first analytical description of CS composition in human brain tissue regardless of tissue processing. This innovative approach to CS-GAG glycobiology will greatly expand opportunities to study both preclinical and clinical samples across a wide array of neurological diseases.
Results
Development of chondroitinase ABC-mediated CS-GAG digestion and CS disaccharide release, isolation and purification from fixed rodent brain tissue
To characterize the CS disaccharide composition in fixed brain tissue, we first developed an extraction and purification protocol for the release of CS disaccharides from CS-GAG chains without altering the integrity of the underlying tissue or protein structures (Figures 1 and 2). Four regionally specific, 30 μm-thick coronal brain sections were selected that span the mouse brain from its rostral to caudal extent (bregma +2 mm, −1 mm, −3 mm and −6 mm), based on computational modeling provided by the Allen Brain Atlas Brain Explorer® (Figure 1A) (Lau et al. 2008). These sections provide a representative snapshot of the CS-GAG composition throughout the brain for comparison with previously published CS-compositional studies performed in fresh whole brain tissue (Carulli et al. 2010; Deepa et al. 2006; Mitsunaga et al. 2006).
Fig. 1.
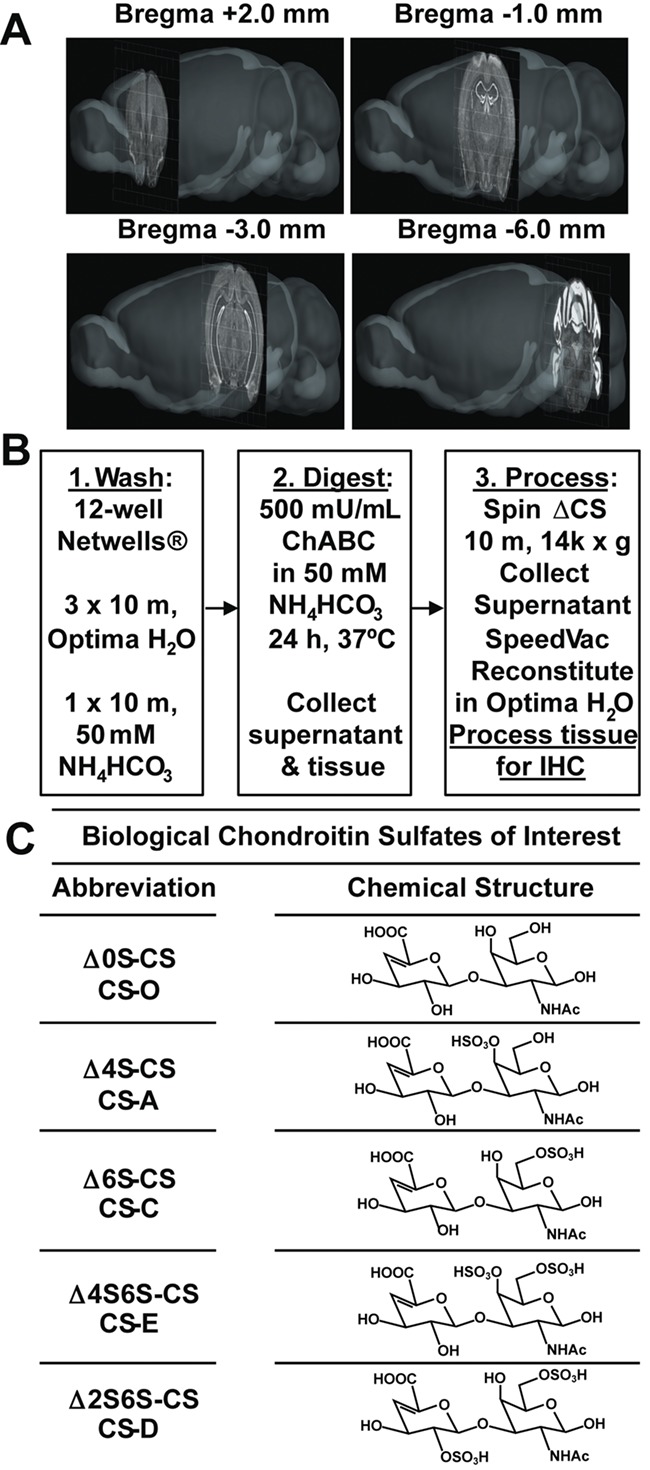
Optimized workflow for the release, isolation, and purification of CS disaccharides from fixed brain tissue. A, Four 30 μm -thick coronal brain sections spanning rostral to caudal at bregma +2, -1, -3, and -6 mm were used to represent a snapshot of the whole mouse brain chondroitin sulfate (CS) disaccharide population and visualized using 3D-modeling provided by the Allen Brain Atlas Brain Explorer® (Lau, C., Ng, L., et al. 2008). B, Experimental workflow for the release, isolation and purification of chondroitin sulfate disaccharides from fixed brain tissue using chondroitinase ABC (ChABC). C, Table displays nomenclature and chemical structures of five biologically relevant CS disaccharides of interest. Image Credit: Allen Institute.
Fig. 2.

Chondroitinase ABC treatment of fixed brain tissue effectively digests CS-GAGs without altering the underlying CSPG protein structures. Fixed mouse brain tissue was treated with either vehicle or ChABC (500 mU/mL) for 24 h at 37°C. Effective digestion of CS-GAGs by ChABC was confirmed by the significant decrease in WFA lectin immunoreactivity (top), appearance unique CS “stub” cleavage neoepitopes (middle), and unaltered underlying aggrecan-CSPG protein structures (bottom) in bregma -1 mm treated sections. Values are Mean ± S.E.M. of tissue sections from four separate adult mice. Student’s t-test. Scale bar = 1 mm.
Among the challenges inherent in isolating CS disaccharides from fixed brain tissue is the need to ensure complete digestion of CS-GAG chains without affecting the integrity of the underlying tissue or causing release of nonspecific GAG disaccharides that may cross-react with the CS disaccharide analysis (e.g., HSs). To address this challenge, we digested fixed brain sections with chondroitinase ABC (ChABC), a bacterial enzyme that selectively cleaves all CS-GAG chains into their unsaturated disaccharide units (i.e. ΔCS), while leaving other species of sulfated GAG chains intact (Hamai et al. 1997; Prabhakar et al. 2009; Yamagata et al. 1968). Brain sections were washed and enzymatically digested with ChABC and the ΔCS disaccharides isolated and purified for sequential MS analysis (Figure 1B). Five separate, biologically relevant CS disaccharides were chosen for further investigation (Figure 1C): Δ0S-CS (CS-O), Δ4S-CS (CS-A), Δ6S-CS (CS-C), Δ2S6S-CS (CS-D) and Δ4S6S-CS (CS-E).
To determine whether efficient CS-GAG digestion can be achieved without affecting underlying tissue integrity, the four regional brain sections were processed post-ChABC digestion by immunofluorescence (IF) staining to monitor (1) loss of CS-GAGs, (2) appearance of CS “stub” cleavage neoepitopes and (3) unaltered CSPG core protein staining (Figure 2 and Figure S1). The plant lectin Wisteria floribunda agglutinin (WFA) exhibits preferential reactivity to GalNAc residues (Kurokawa et al. 1976) and is routinely used to visualized CS-rich PNN structures within the brain (Hartig et al. 1992; Mirzadeh et al. 2019; Slaker et al. 2016). Our finding of a marked reduction of WFA labeling of brain tissue establishes the reduction of CS-GAGs after ChABC treatment (Figure 2, top). Complementing the loss in WFA-labeled CS-GAGs was a dramatic increase in BE-123 staining of CS stubs, which are neoepitopes produced only after ChABC-specific cleavage of CS-GAGs (Figure 2, middle) (Bruckner et al. 1998). Labeling of the CSPG core protein aggrecan, found predominantly in CS-GAG containing PNN matrix structures (Morawski et al. 2012), was left unaltered (Figure 2, bottom). Although ChABC digestion of all four brain areas revealed a significant increase in CS stub neoepitope immunoreactivity, suggesting efficient CS-GAG digestion and ΔCS disaccharide release, only bregma +2, −1 and −3 mm sections, but not −6 mm sections, exhibited a decrease in WFA labeling of intact CS-GAGs (Figure 2 and Figure S1A and B). Further magnification of the CS-AG-rich gigantocellular reticular nucleus in bregma −6 mm sections shows complete loss of WFA+ PNN structures after ChABC digestion, confirming that residual WFA labeling is not a result of incomplete CS-GAG digestion (Figure S1C). Recent reports suggest WFA lectin may also nonspecifically label white matter in the brain in the absence of CS-GAGs (Slaker et al. 2016). In contrast to the bregma +2, −1 and −3 mm sections, bregma −6 mm sections contain high content of axons/fiber tracts as major components of both the cerebellum and the brainstem, and the residual labeling intensity of WFA in bregma −6 mm sections likely reflects nonspecific WFA reactivity to the relatively high content of white matter in this brain region (Figure S1).
After visualizing the release of CS-GAGs from the tissue, we next confirmed CS-GAG cleavage in eight previously reported PNN-positive brain regions (Figure S2): the orbitofrontal and the somatosensory cortical areas from bregma +2 mm sections, the barrel and motor cortices from bregma −1 mm sections, the visual, retrosplenial and auditory cortices from bregma −3 mm sections and the gigantocellular reticular nucleus from bregma −6 mm sections (Horii-Hayashi et al. 2015; Lensjo et al. 2017; Testa et al. 2019; Vazquez-Sanroman et al. 2017). Following quantification of normalized immunofluorescent intensities corresponding to WFA and aggrecan, each region (with the exception of the gigantocellular reticular nucleus in the bregma −6 mm section) exhibited significant loss of WFA intensity following ChABC incubation (Figure S2). In contrast, aggrecan core protein expression remained either unchanged or in some cases increased, in these same PNN-positive brain regions. Increased aggrecan staining likely reflects elimination of CS residues that limit antibody access to underlying epitopes (Kang et al. 2017). Together, these observations confirm that CS disaccharide release from PNN-rich brain regions can be achieved by incubation of fixed brain tissue with ChABC and that this digestion process does not alter underling tissue integrity or CSPG protein structures.
Optimization of DI-MS/MS to analyze CS isomers
Previous studies implicate the specific sulfation pattern of CS-GAGs as impacting the function of CSPG-containing matrices within the brain (Djerbal et al. 2017; Gama et al. 2006). Sulfation of GalNAc at C4 and C6, which result from the action of chondroitin 4-sulfotransferase-1 and chondroitin 6-sulfotransferase-1, respectively, represent the two most abundant sulfated positions in CS-containing GAGs in the brain (Figure 1C). Alterations in the abundance of 4S- and 6S-CS disaccharides (and hence the 4S/6S-CS ratio) can affect PNN stability and integrity. For example, overexpression of the enzyme responsible for chondroitin 6-sulfation decreases the 4S/6S-CS ratio, thereby destabilizing PNN matrix structures and increasing neurocircuit plasticity (Miyata et al. 2012). 6S-CS abundance has also been reported to increase in response to CNS injury in association with neural network dysfunction (Properzi et al. 2005). Thus, the relative abundance of 4S- and 6S-CS (i.e. the 4S/6S-ratio) is of particular relevance to the function of neurons and other brain cell types.
To determine the percentage of Δ4S-CS (CS-A) and Δ6S-CS (CS-C) unsaturated disaccharides isolated from fixed brain tissue (and compute the 4S/6S-CS ratio), we optimized a straightforward methodology using MS/MS to measure the relative abundance of these two isomers. Coupling direct infusion (DI)–electrospray ionization (ESI) and MS/MS analyses allows for the relative quantification of Δ4S-CS and Δ6S-CS isomers without the requirement of a chromatography step, which significantly reduces the analysis time of the assay (Desaire and Leary 2000; Miller et al. 2006; Zaia et al. 2001). Although changes in the 4S/6S-CS ratio in brain tissue have been reported in a variety of preclinical models, this type of analysis has yet to be applied to the analysis of human brain tissue.
As a first step to achieving this goal, we assessed the purity and concentration of the commercially available CS isomer standards by nuclear magnetic resonance (NMR) (see “Materials and methods” section and Figure S3). By DI-MS, the major ion present, m/z 458, represents both Δ4S-CS (Figure 3A, left) and Δ6S-CS (Figure 3A, right) monosulfated CS isomers. The contributions of Δ4S-CS and Δ6S-CS to the m/z 458 ion can be determined by their unique MS/MS spectra, which produce distinctive ion products for each disaccharide (m/z 300 for Δ4S-CS and m/z 282 for Δ6S-CS) (Figure 3B) (Desaire and Leary 2000; Zaia and Costello 2001). We used the same approach with varying ratios of Δ4S-CS and Δ6S-CS to produce a calibration curve that can reveal percent Δ4S-CS from the relative abundances of the m/z 282 and 300 fragment ions (see Figure S4).
Fig. 3.
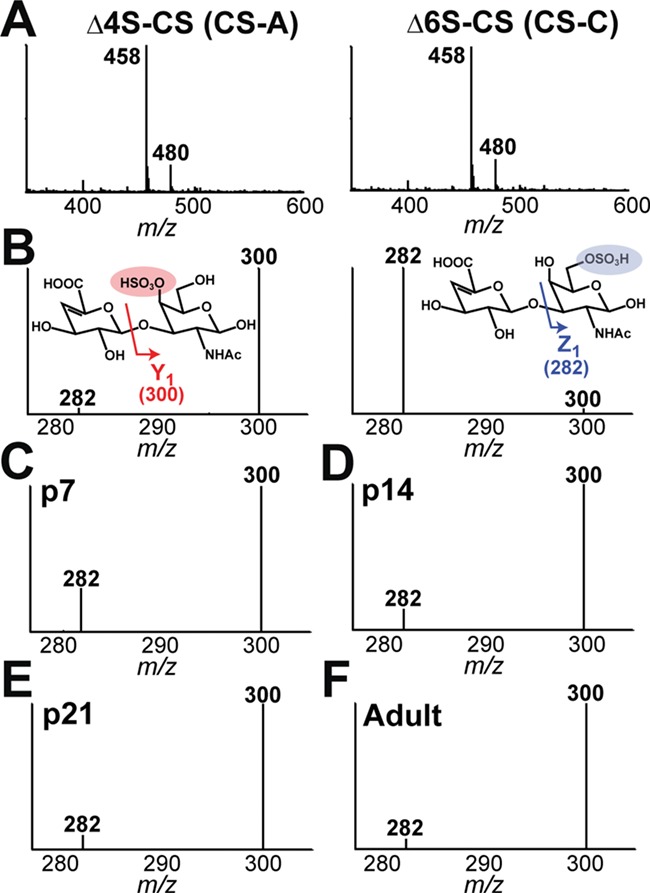
DI-MS/MS analysis of CS disaccharides isolated from fixed mouse brain sections throughout development. A, MS spectra of the Δ4S-CS (CS-A) (left) and Δ6S-CS (CS-C) (right) CS isomer standards show the major ion (MH- peak at m/z 458) along with the sodium adduct (m/z 480) in the MS spectra. B, The Y1 (m/z 300) and Z1 (m/z 282) fragment ion patterns in the MS/MS spectra are indicated by standard carbohydrate fragmentation nomenclature (Domon, B. and Costello, C.E. 1988). C-F, DI-MS/MS of CS disaccharides isolated from four 30 μm-thick PFA-fixed mouse brain sections (bregma +2, -1, -3, and -6 mm) in C, P7, D, P14, E, P21, and F, adult (6 months) shows a progressive decrease in the Δ6S-CS (CS-C) CS isomer and increase in the Δ4S-CS (CS-A) isomer throughout development.
To determine whether this DI-MS/MS approach could be applied to analyze disulfated CS-disaccharides of interest, we first analyzed the MS spectra for Δ2S6S-CS (CS-D) and Δ4S6S-CS (CS-E) standards. As expected, we observed a major ion peak at m/z 538 in both standards, which represents both disulfated disaccharide CS isomers (Figure S5A and B, left). A second major ion peak, m/z 458, was also identified in both of disulfated CS standards reflecting in-source loss of one of the sulfate groups. MS/MS of the m/z 458 ion in the Δ2S6S-CS standard produces a major ion peak at m/z 237, representing a Δ2S-CS disaccharide (Figure S5A, right). Meanwhile, the MS/MS of m/z 458 in the Δ4S6S-CS standard shows a major ion peak at m/z 300, representing a Δ4S-CS disaccharide (Figure S5B, right). Based on this MS/MS fragmentation pattern, we hypothesize that a significant portion of disulfated CS isomers lose a sulfate at the C6 position on GalNAc during the ionization process, therefore producing m/z 538 (disulfated-CS) and m/z 458 (monosulfated-CS) ion peaks for the Δ2S6S-CS (CS-D) and Δ4S6S-CS (CS-E) standards. While softer ESI source conditions can help minimize in-source loss of sulfate, we found that this led to a sharp drop in overall sensitivity. Consequently, in-source loss of a sulfate from the disulfated variants during ionization can potentially confound quantitative analysis by DI-MS/MS, and this approach was not pursued further.
Compositional analysis of Δ4S-CS and Δ6S-CS disaccharides isolated from fixed rodent brain tissue using DI-MS/MS
In fresh brain tissue, the relative percentages of Δ4S-CS and Δ6S-CS within the 4S/6S-CS ratio changes inversely over the course of brain development from birth to adulthood (Carulli et al. 2010; Mitsunaga et al. 2006). To confirm that changes in Δ4S-CS and Δ6S-CS disaccharides extracted from fixed brain tissue match those reported in fresh brain tissue, we determined the abundance of Δ4S-CS and Δ6S-CS disaccharides relative to the 4S/6S-CS ratio using a developmental series of mouse brain sections. Specifically, we isolated CS disaccharides from the four aforementioned brain regions (Figure 1A) in both male and female postnatal mice at days P7, P14 and P21 and in adulthood (6 months of age) using the method described in Figure 1. To determine the relative abundance of Δ4S-CS and Δ6S-CS disaccharides, we performed DI-MS/MS targeting the intact m/z 458 ion and m/z 300 and 282 fragment ions (Figure 3C–F, Table S1). Consistent with published literature (Carulli et al. 2010; Mitsunaga et al. 2006; Miyata et al. 2012), we report the highest percentage of Δ6S-CS within the 4S/6S-CS ratio at P7 (33.8% (m), 35.5% (f)), with age-depended decreases detected at P14 (15.6% (m), 15.9% (f)), P21 (10.8% (m), 10.0% (f)) and adult (5.3% (m), 3.7% (f)). Conversely, the percentage of Δ4S-CS increased steadily from P7 (66.2% (m), 64.5% (f)) to P14 (84.4% (m), 84.1% (f)), P21 (89.2% (m), 90.0% (f)) and adult (94.7% (m), 96.3% (f)). Here, we report no statistical difference between the CS composition in female and male mouse brains at any developmental time point, thus providing the first report for the absence of sexual dysmorphism in this analysis. Overall, these results closely parallel those previously reported using analysis of fresh brain tissue in male mice, thereby validating our model for CS disaccharide isolation and analysis from fixed brain tissue.
Optimization of LC–MS/MS + MRM to analyze CS isomers
Much attention has been given to changes in Δ4S-CS and Δ6S-CS abundance in neurological diseases, but additional CS variants have been shown to influence biological processes. Even though the Δ0S-CS (CS-O), Δ2S6S-CS (CS-D) and Δ4S6S-CS (CS-E) CS-disaccharides (Figure 1C) represent a combined 6–8.5% of total CS variants within the brain (Carulli et al. 2010; Miyata et al. 2012), they are highly involved in key developmental and disease processes. For example, the 4S6S-CS (CS-E) disaccharide contributes to the inhibitory properties of PNNs, binds negative axonal guidance molecules and attracts extracellular growth factors including semaphorins and heparin-binding growth factors (Deepa et al. 2002; Dick et al. 2013; Karumbaiah et al. 2011).
CS disaccharide desulfation during DI-MS/MS ionization (Figure S5) propelled us to investigate an online liquid chromatography (LC) step to separate all CS disaccharide variants prior to MS analysis (Estrella et al. 2007; Gill et al. 2013; Karlsson et al. 2005; Osago et al. 2014; Tomatsu et al. 2014; Wei et al. 2011; Zaia 2009; Zaia and Costello 2001). LC separation of four CS-standards, Δ0S-CS (CS-O), Δ4S-CS (CS-A), Δ6S-CS (CS-C) and Δ4S6S-CS (CS-E), yielded unique CS retention times for each standard (Figure 4A and Table S2). We therefore developed a multiple reaction monitoring (MRM) method based on the predominant distinguishing fragment ion from each CS disaccharide. The Δ4S-CS standard eluted first, followed by Δ4S6S-CS, Δ0S-CS and Δ6S-CS (Figure S6). LC–MS/MS + MRM analysis of a fifth standard, the disulfated Δ2S6S-CS (CS-D), produced a unique peak that eluted after the Δ6S-CS (Figure S7A). Full scan LC–MS experiments of standards mixed in equimolar ratios were also performed and showed that in-source sulfation loss occurs only with the disulfated (i.e. Δ4S6S-CS and Δ2S6S-CS) isomers and minimal loss with the monosulfated (i.e. Δ4S-CS and Δ6S-CS) isomers (Figure S8).
Fig. 4.

LC-MS/MS + MRM analysis of CS disaccharides isolated from fixed mouse brain sections throughout development A, LC separation and simultaneous MRM measurement of a 0.75 pmol CS mixtures containing four individual CS disaccharide standards (Δ4S-CS (CS-A), Δ4S6S-CS (CS-E), Δ0S-CS (CS-O), Δ6S-CS (CS-C)). The precursor and fragment ion selected and monitored by MRM to isolate and quantify the CS isomers of interest are shown in the inset. B, Representative profiles of CS disaccharides extracted from four coronal brain sections (bregma +2, -1, -3, -6 mm) P7, P14, P21, and adult male mice. C, Comparison of developmental changes in the percentage of Δ6S-CS computed from the 4S/6S-CS ratio from fixed brain tissue using DI-MS/MS (Figure 3) and LC-MS/MS to analysis adapted from fresh tissue (Carulli, D., Pizzorusso, T., et al. 2010, Mitsunaga, C., Mikami, T., et al. 2006, Miyata, S., Komatsu, Y., et al. 2012). See Table S3 and S4 for the comparison of developmental changes in all ΔCS disaccharides in fixed vs fresh brain tissue.
A dilution series of an equimolar mixture containing each CS disaccharide was used to test accuracy and sensitivity limits using our LC–MS/MS + MRM methodology for CS compositional analysis. The limit of detection (LOD) was ~120 fmol, and the limit of quantification (LOQ) was ~600 fmol (Figure S9). The latter is equal or more sensitive than previously reported LOQs of 430 fmol (Oguma et al. 2001) and 4.21 pmol (Zhang et al. 2015) for CSs isolated from fresh biological samples and quantified using comparable LC–MS/MS methodologies. Relative quantification of each standard within the equimolar mix was achieved using the peak area normalization method (Yu et al. 2014). This method expresses each CS isomer as a relative molar percent and requires no internal quantitation standards (see “Materials and methods” section). Peak area normalization and resulting normalization factors (F) were constant over multiple concentrations within the LOQ. Normalizing the peak area of an unknown sample using F represents a straightforward yet accurate and reproducible approach to calculate the relative percentages of each CS isomer within a sample.
Compositional analysis of Δ0S-CS, Δ4S-CS, Δ6S-CS and Δ4S6S-CS isolated from fixed rodent brain tissue using LC–MS/MS + MRM analysis
To determine if the LC–MS/MS + MRM approach can be applied to the analysis of non-, mono- and disulfated CS variants from fixed brain tissue, we analyzed CS disaccharides isolated from the developmental series established in Figure 4 and compared them to (A) our DI-MS/MS analysis and (B) three separate published CS compositional values based on fresh brain tissue extraction (Carulli et al. 2010; Mitsunaga et al. 2006; Miyata et al. 2012). LC separation of isolated CS disaccharides isolated from each of the four fixed tissue sections (see Figure 1A) yielded four distinct peaks (Figure 4B). Each of the four eluted peaks represents a biological CS disaccharide of interest when analyzed using the established channels of the MRM assay (Figure 4A and Figure S10). The signal for the Δ2S6S-CS variant was detectable, but was below the LOQ throughout the developmental series (Figure S7B).
By comparing the relative signal for each CS disaccharide with those observed using equimolar ratios of each standard, we were able to normalize the peak area standards and calculate the relative percentages of each CS in the tissue samples (see “Materials and methods” section). Our analysis reveals the expected pattern of change in levels of different CS disaccharides over the course of development (Table S2). Thus, the lowest percentage of Δ4S-CS (CS-A) was detected in the mouse brain at P7 (58.4%), with progressive increases associated with increased age: P14 (76.4%), P21 (80.9%) and adult (87.2%). Meanwhile, the percentages of Δ6S-CS (CS-C) and Δ4S6S-CS (CS-E) decreased steadily from P7 (27.5%; 4.3%) to P14 (13.5%; 3.7%), P21 (9.4%; 3.3%) and adult (2.9%; 1.6%) for Δ6S-CS and Δ4S6S-CS, respectively. The relative percentages of Δ4S-CS and Δ6S-CS disaccharides computed from the 4S/6S-CS ratio using the LC–MS/MS + MRM analytical technique matches the values generated from our DI-MS/MS methodology (Figure 4C). Although there is some variability in the changes in CS variants in previously published developmental studies using fresh tissue, the trends in the 4S/6S-CS ratios that we observe are very consistent with those previously reported (Figure 4C and Table S3) (Carulli et al. 2010; Mitsunaga et al. 2006; Miyata et al. 2012). These data offer direct evidence in support of the accuracy of the LC–MS/MS + MRM method of CS quantitation from fixed brain slices.
Internal validation of ChABC enzymatic activity
Digestion and release of CS disaccharides from fixed-brain tissue also produces a strong peak at 9.5 min that is distinct from the CS standard profiles or buffer alone (Figure 5B and Figure S11). Since ChABC exhibits enzymatic activity towards hyaluronan (HA), a nonsulfated polysaccharide consisting of repeating units of GlcA and N-acetylglucosamine (GlcNAc) (Prabhakar et al. 2009), we reasoned that this unknown peak might represent the co-release of HA disaccharides from our fixed-brain tissue. LC separation of a ΔHA disaccharide standard produces a unique peak eluting at 9.5 min, matching that of our unknown analyte (Figure 5A and B) and was also validated in the full-scan analysis of the ΔHA-containing CS mixture (Figure S8). Since ΔHA exhibits the same molecular weight and MS/MS fragmentation as the nonsulfated Δ0S-CS (Osago et al. 2014), we assigned the 378 → 175 channel to identify both ΔHA and Δ0S-CS unsaturated disaccharides. These were well separated chromatographically, with minimal cross-reactivity observed in the Δ4S-CS (458 → 300), Δ6S-CS (458 → 282), or Δ4S6S-CS (538 → 300) channels. Treating adult mouse brain tissue with 500 mU/mL of fresh ChABC in ammonium bicarbonate, buffered to pH 7.4, produced strong, nonoverlapping peaks for both Δ0S-CS and ΔHA disaccharides, identified using the set 378 → 175 channel (Figure 5B).
Fig. 5.
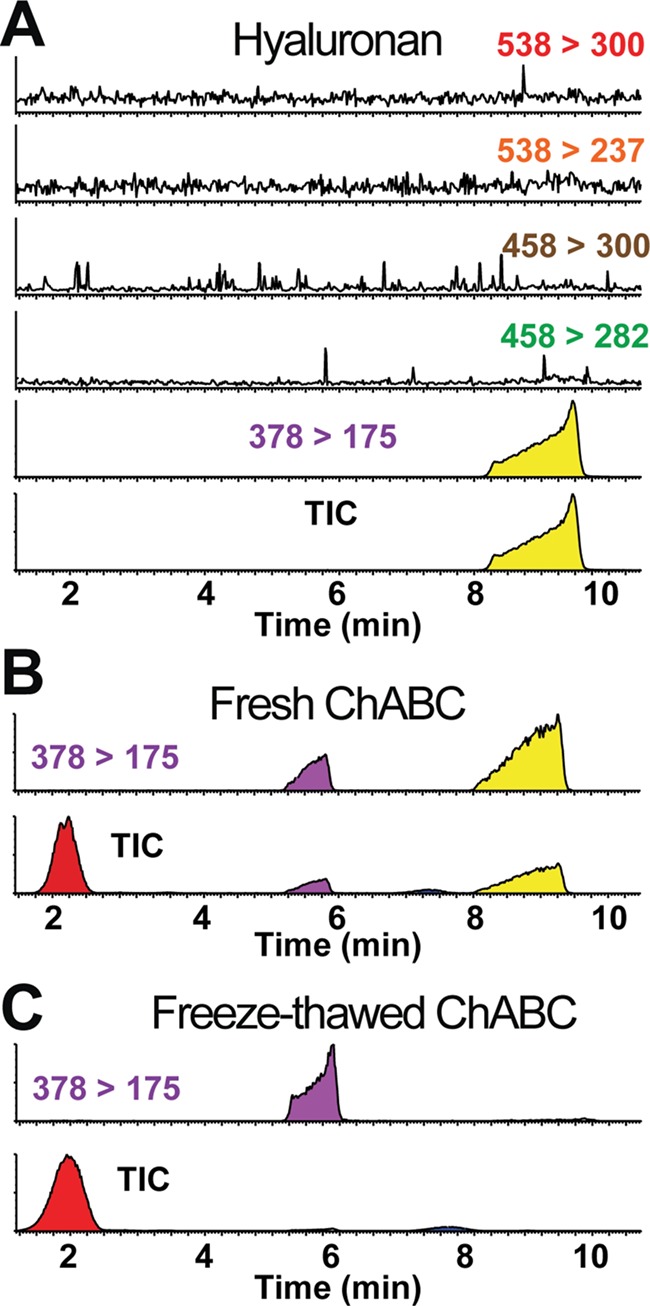
Validation of ChABC enzymatic activity by non-sulfated CS-GAG and HA-GAG cleavage monitoring. A, LC separation and MS/MS analysis of hyaluronan (HA) disaccharide standard. B, ChABC GAG digestion of fixed mouse brain tissue using non freeze-thawed (i.e. fresh) ChABC releases non-sulfated, monosulfated, and disulfated CS isomers and hyaluronan disaccharides, and produces unique column retention times for 0S-CS (5.8 min) and HA (9.5 min) using the established MRM channel (m/z 378 > 178). C, Decreasing ChABC enzymatic activity by enzyme freeze-thawing significantly reduces detection towards the release of non-sulfated 0S-CS disaccharides and abolishes the release of HA disaccharides without influencing the release of monosulfated CS-isomers.
Since ChABC exhibits the lowest specific activity for HA (Hamai et al. 1997; Prabhakar et al. 2009; Yamagata et al. 1968), we reasoned that the release of ΔHA disaccharides can be used as an internal control for ChABC enzymatic activity and GAG digestion efficiency between experiments. To test whether ΔHA disaccharide release can be used as an indicator GAG digestion efficiency, adult mouse brain tissue was treated with 500 mU/mL of freeze-thawed ChABC, a method known to reduce enzymatic activity up to 85% (Cao et al. 2003). Interestingly, while freeze-thawing ChABC did not appear to influence the ability of ChABC to cleave Δ4S-CS and Δ6S-CS containing GAGs, it did significantly decrease the peak for the Δ0S-CS isomer and abolished the peak for the ΔHA disaccharide resulting from reduced ChABC activity (Figure 5C). To determine whether the release of Δ4S-CS and Δ6S-CS disaccharides was due to ChABC-mediated enzymatic digestion, or instead due in part to nonenzymatic release of the disaccharides during the extraction procedure, we incubated mouse brain tissue without ChABC for 24 h at 37°C. Our results show minimal release of CS disaccharides from fixed brain tissue when incubated in enzyme-free buffer following the optimized digestion protocol established in Figure 1 (Figure S11). These results indicate that (1) freeze-thawing of ChABC significantly reduces its specificity for the HA- and 0S-CS-containing GAG cleavage but not for sulfated CS-GAG digestion and (2) the release of ΔHA from biological tissue can be used as an indicator and internal control for ChABC digestion efficiency of GAG chains between experiments.
Compositional analysis of biological CS disaccharides isolated from fixed human brain tissue
After optimizing the ΔCS disaccharide extraction (Figures 1 and 2) and quantification analysis (Figures 3–5) in fixed brain tissue in rodents, we investigated whether the LC–MS/MS + MRM method can be successfully applied to the analysis of CS disaccharides derived from fixed human brain tissue. Using this method (Figures 4 and 5), we extracted and analyzed CS disaccharides isolated from formalin-fixed human brain tissue dissected from the primary motor cortex, a brain region known to contain high densities of CS-GAG-containing PNN matrices (Testa et al. 2019). This analysis yielded the expected four distinct LC peaks and CS-specific MS/MS ion fragmentation when analyzed using the previously established channels (Figure 6). CS compositional analysis using peak area normalization shows Δ4S-CS to be the most abundant CS variant in the human primary motor cortex sample (77.2%), as expected, followed by Δ0S-CS (14.6%), Δ6S-CS (4.8%) and Δ4S6S-CS (3.4%) (Figure 6). This corresponds to a 4S/6S-CS ratio of 94.1% Δ4S-CS and 5.9% Δ6S-CS. Analyzing the human brain sample in triplicate established the technical reproducibility of this method. These results confirm that our LC–MS/MS + MRM methodology for CS compositional analysis of fixed brain tissue can be applied in both human and rodent models.
Fig. 6.
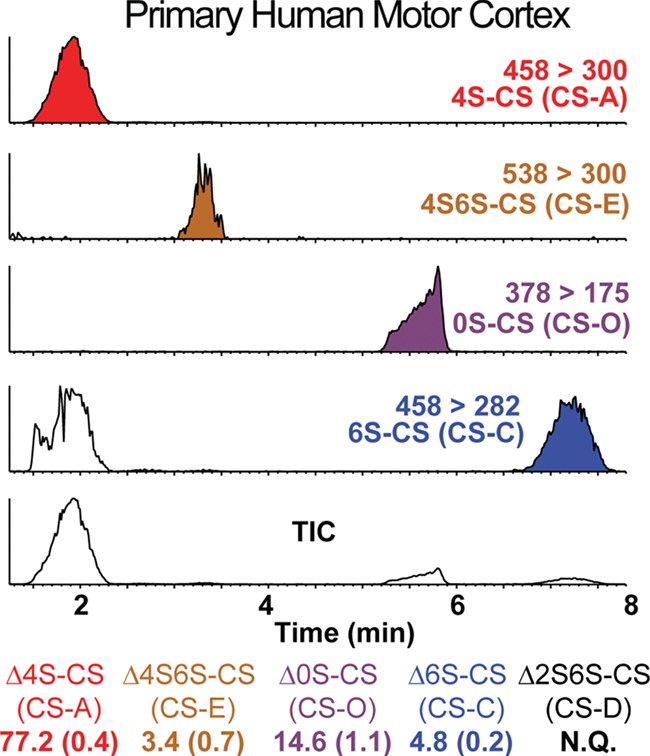
LC-MS/MS + MRM profile of CS disaccharides isolated from fixed human brain tissue. LC separation and MS/MS-MRM analysis were used to determine the composition of chondroitin sulfates extracted from the primary human motor cortex. Extracted disaccharides are identified using the ion chromatograms with indicated channels. The percentage of each CS isomers is shown at the bottom with the mean of triplicates from a single human donor followed by the standard error in parenthesis. The Δ2S6S-CS isolated from fixed tissue was within the LOD (see Figure S7) but not within the LOQ, and thus denoted as N.Q., not quantifiable.
Discussion
Although quantitative analysis of CS variants in fresh biological samples has advanced considerably over the last decade (Kubaski et al. 2017), technologies to characterize CS-specific disaccharides in fixed brain tissues remain to be fully developed. A common approach for CS analysis in fixed brain tissue is based on immunolabeling of CS variants using CS-specific antibodies, but poor identification and cross-reactivity of these antibodies has resulted in conflicting conclusions regarding the pathological composition of CS variants in the progression of human neurological disease. For example, the widely utilized mouse monoclonal antibody CS-56 has been variably used for immunolabeling of total CS-GAGs and selective labeling for 6S-CS-containing GAGs, but has also been shown to interact specifically with 2S6S-CS-containing GAGs (Deepa et al. 2007; Ito et al. 2005; Miyata et al. 2012; Sugiura et al. 2012; Yi et al. 2012). Although a novel LC–MS approach has been adapted to quantify the monosulfated CS isomers from fixed brain tissue (Turiák et al. 2014), a method that offers complete CS compositional analysis has not yet been described. The lack of alternatives to quantitatively analyze the complete CS composition in fixed brain tissue propelled us to develop techniques with which to achieve this goal in both rodent and human fixed brain tissue.
We first optimized a ChABC digestion protocol that liberates all CS disaccharides from fixed brain tissue without altering the underlying tissue integrity or protein structures (Figures 1 and 2). The selective release of CS disaccharides following this digestion allows for both CS compositional analysis and IF labeling using the same tissue sections, thus eliminating the requirement for fresh tissue altogether. Analyzing the same tissue sections for both CS disaccharide composition and protein immunoreactivity also allows for direct comparison of changes in protein expression and CS-GAG composition originating from the same tissue sections, thereby reducing significantly the amount of tissue sample needed in comparison with traditional methods of CS isolation from fresh tissue. Furthermore, ChABC digestion of CS-GAGs enhances CSPG immunolabeling in select brain regions (Figure S2), presumably owing to increased protein epitope exposure (Kang et al. 2017). Comparable with the technical report describing the extraction and analysis of monosulfated CSs using just four FFPE mouse brain sections (Turiák et al. 2014), our method uses four paraformaldehyde (PFA)-fixed mouse brain sections to accurately detect and quantify changes in the complete CS disaccharide composition, while still allowing for multiple technical replicates. The low tissue sample requirement in this analysis offers the possibility for regional dissection of fixed brain tissue and CS disaccharide analysis through laser-capture microdissection technology, which requires 15 mm2 tissue sections for the isolation and detection of glycome profiles (Hinneburg et al. 2017), as an option that is otherwise unavailable for small brain areas using methods developed for the analysis of fresh tissue.
After optimizing the CS-disaccharide extraction protocol, we applied and evaluated two separate analytical techniques to quantify sulfation patterns of isolated CS disaccharides (Desaire and Leary 2000; Osago T. et al. 2014; Zaia and Costello 2001; Zaia et al. 2001). First, we subjected our isolates to DI-MS/MS and quantified the monosulfated Δ4S-CS and Δ6S-CS abundance relative to the 4S/6S-CS ratio using a developmental series as validation (Figure 3 and Table S1). Consistent with published work (Carulli et al. 2010; Mitsunaga et al. 2006; Miyata et al. 2012), this analysis shows a progressive increase in the percentage of Δ4S-CS and a corresponding decrease in the percentage of Δ6S-CS from P7 to adulthood in both male and female mice. Although we predicted that in-source desulfation of disulfated CS isomers may confound quantitation of the 4S and 6S-CS variants, the low endogenous abundance of 2S6S- and 4S6S-CS isomers within the brain tissue (0.9 and 0.9–1.6% respectively (Carulli et al. 2010; Miyata et al. 2012)) minimized any impact on the final 4S/6S-CS ratio in our developmental brain series. Indeed, our DI-MS/MS and LC–MS/MS approaches yielded very similar values for the developmental study compared with fresh tissue analysis (Figure 4C and Table S3). Therefore, we suggest that the DI-MS/MS methodology is more appropriate for high-throughput screening of samples investigating the percentages of Δ4S-CS and Δ6S-CS within the 4S/6S-CS ratio, with the loss of sulfation in the disulfated CS-isomers rendering this methodology unsuitable for the full CS compositional analysis. However, there may be instances where the disulfated abundance is considerably higher and thus will limit the accuracy of relative quantitation by the DI-MS/MS method. Attenuated source settings may overcome the in-source loss of sulfate, but in our experience the conditions necessary to mitigate desulfation substantially weakened the overall signal to noise. Since the nonsulfated Δ0S-CS and ΔHA contain the same intact (m/z 378) and fragment (m/z 175) ion peaks, the DI-MS/MS methodology is also not appropriate for analysis of nonsulfated disaccharides.
To quantify changes in the nonsulfated and disulfated CS variants, we employed LC–MS/MS + MRM to first separate the CS isomers prior to quantification (Figure 4). Using the same developmental brain series tested in the DI-MS/MS analysis (Figure 3), we show similar changes in Δ6S-CS (CS-C) abundance quantified within the 4S/6S-CS ratio using the LC–MS/MS + MRM technology (Figure 4C). In addition to the monosulfated isomers, this method also readily detects changes in the disulfated Δ4S6S-CS (CS-E) variant, similar to that previously reported in fresh tissue analysis (Table S3) (Carulli et al. 2010; Mitsunaga et al. 2006; Miyata et al. 2012). Resolving the CS isomers chromatographically negates the effects of in-source sulfate loss since the in-source fragment ion will not interfere with the signals from distinct CS isomers, and the standards that are used for relative quantitation using the peak area normalization method will undergo the same degree of in-source sulfate loss. Furthermore, the LC step desalts the sample, negating the presence of sodium adducts that can potentially offset quantitation. While this method was able to resolve and detect the second disulfated CS variant, Δ2S6S-CS (CS-D) (Figure S7), its abundance was too low to permit quantitation and hence was reported to be less than the LOQ.
Although developmental changes in sulfated CS isomers are consistent between our results and the literature (Figure 4C), changes in the Δ0S-CS isomer varied greatly between studies (Table S3). Compared with our report of 8.4% (Table S2), the reported abundance of Δ0S-CS isolated from adult fresh brain tissue ranges from 3.5% (Carulli et al. 2010) to 6.7% (Miyata et al. 2012) (Table S3), suggesting that differences in extraction techniques may contribute to variability between studies. Considering that ChABC exhibits decreased activity towards both the nonsulfated Δ0S-CS isomer and HA at pH 8.0 (Hamai et al. 1997; Prabhakar et al. 2009; Yamagata et al. 1968), we predict that differences in the reported percentage of Δ0S-CS may be due to the buffering system used in the analysis. Indeed, using an ammonium bicarbonate (pH 8.0) buffering system for a shorter incubation period (16 h), which we predict would fail to completely digest Δ0S-CS containing GAGs, may underrepresent the percentage of biological Δ0S-CS (Carulli et al. 2010). Since incomplete CS-GAG digestion results in decreased Δ0S-CS and ΔHA disaccharide release without altering the release of Δ4S- and Δ6S-CS sulfated isomers (Figure 5), we deem it good practice to utilize ChABC-mediated ΔHA release as an internal control indicative of complete enzymatic digestion as one approach to enhance reproducibility between studies and laboratories.
After validating our LC–MS/MS + MRM methodology in the mouse developmental series, we then analyzed the CS disaccharide composition from formalin-fixed human primary motor cortex brain tissue (Figure 6). Here, we report Δ4S-CS to be the most abundant CS variant in this brain area, followed by Δ0S-CS > Δ6S-CS > Δ4S6S-CS. The percentages of 4S-, 0S-, 6S- and 4S6S-CS in the human motor cortex were somewhat different from what we observed in adult mice (Δ4S-CS, 87.2% (m) vs. 77.2% (h); Δ0S-CS, 8.4% (m) vs. 14.6% (h), Δ6S-CS 2.9% (m) vs. 4.8% (h) and Δ4S6S-CS, 1.6% (m) vs. 3.4% (h)). Such differences may arise from influences including species, brain region, age, lifestyle and/or undiagnosed neurological pathologies. Further work is warranted to investigate this hypothesis.
Similar to the CS-based PNN matrices, changes in dermatan sulfate and HS-rich interstitial ECM closely parallel to the functional timing needed for developmental extracellular protein signaling (Maeda et al. 2011; Shipp and Hsieh-Wilson 2007; Tekotte et al. 1994; Yabe et al. 2005). Although dermatan sulfate is found in both interstitial and PNN GAGs, mice lacking dermatan sulfate epimerase 2 (DS-epi2), the predominant DS epimerase in the brain, exhibit no histological or morphological abnormalities in their WFA+ and aggrecan+ PNN matrices in the hippocampus and cerebellar cortices (Bartolini et al. 2012). Similarly, the dramatic increase in HSs relative to CSs within the loose interstitial ECM also suggests a localized function for HS in the interstitial matrix over PNNs. Nevertheless, recent clinical evidence links both dermatan and HS sulfotransferase mutations to neurological disorders in humans and rodents (Li et al. 2019; Najmabadi et al. 2011; Reuter et al. 2014). However, unlike CSs, HSs can be extracellularly modified by HS 6-O-endosulfatases (SULFs) (Kalus et al. 2015). Due to the postbiosynthetic sulfation processing by SULFs, in addition to known and unknown posttranscriptional regulation of sulfotransferase translation, degradation and enzymatic activity (Dou et al. 2015; Grobe and Esko 2002; Sikora et al. 2016), gene expression for HS sulfotransferases may not directly correlate to the extracellular sulfation patterns observed in vivo. Our characterization of CS disaccharides from fixed brain tissue warrants further exploration to determine if this method can be extended to the characterization of additional GAGs (e.g. HSs) that also closely associate with neurodegenerative diseases.
Taken together, these results (1) validate the accuracy and reproducibility of this CS disaccharide release and isolation method for the analysis of the complete CS composition from fixed brain sections, (2) lend support for both the DI-MS/MS and LC–MS/MS methodologies for quantifying relative changes in CS disaccharide composition (based on successful recapitulation of changes in CS-sulfation patterns across brain development previously reported in fresh tissue) and (3) present a robust analytical approach for investigating changes in the full CS disaccharide composition from fixed rodent and human brain tissue. To our knowledge, ours is also the first quantitative characterization of CS sulfation patterns in the human brain, a method with the potential to complement insights into human neuropathology at the time of death. Formalin fixation of human brain specimens significantly increases the rate of detection for abnormal brain pathology (Katelaris et al. 1994), and our analysis of CS-GAGs from fixed brain tissue offers an abundant and accurate sample source for CS-based compositional analysis. The ability to accurately detect CS variations in fixed human brain tissue is a potential groundbreaking advancement for translational diagnosis of neurological diseases.
Materials and methods
Animal studies
Male and female in-house P7, P14, P21 and adult (6-month) mice bred on the C57BL/6J background were used for the developmental validation study. All mice had ad libitum access to water and standard laboratory chow (Lab Diet, St. Louis, MO) were maintained using a temperature-controlled room under a 12 h:12 h light:dark cycle and group-housed under specific pathogen-free conditions. All animals were housed and handled in accordance with protocols approved by the University of Washington Institutional Animal Care and Use Committee (IACUC), and all experiments were conducted in accordance with the National Institutes of Health Guide for the Care and Use of Laboratory Animals. All experiments reported are in compliance with the ARRIVE guidelines.
Paraformaldehyde brain processing
Mice were anesthetized with ketamine and xylazine (0.14 mg/g) and perfused with 0.1 M PBS followed by 4% PFA in 0.1 M PBS. Brains were extracted, cryopreserved in 30% sucrose PBS solution and frozen in optimal cutting temperature (OCT) compound on dry ice. Brains were stored at −80°C until cryosectioning.
Postmortem human brain tissue
Human tissue was provided by the University of Washington Alzheimer’s Disease Research Center (ADRC) Neuropathology Core. Research participants in the ADRC consent to research brain autopsy. At the time of death, brain tissue is fixed in 10% neutral buffered formalin (NBF) for approximately 3 weeks, when the brain is coronally sectioned into 4 mm slices and sampled. Unsampled tissue is stored in 10% NBF until needed. For this study, we selected a single case of a 93-year-old diagnosed with mild cognitive impairment at the time of death. The postmortem interval (latency from death to brain fixation) was 4.5 h, and the time in 10% NBF to sampling for this study was approximately 12.5 months. Neuropathologic examination revealed the presence of primary age-related tauopathy [PMCID:PMC4257842] delineated by the presence of neurofibrillary degeneration (hyperphosphorylated tau tangles and neurites in regions of the medial temporal cortex, hippocampus and entorhinal cortex) without involvement of the frontal or parietal neocortex and with no evidence of cerebral cortical β amyloid plaques. Phospho-TDP-43 pathology was present in the medial temporal lobe, and amygdala-predominant Lewy body disease was also noted. An approximate 2 × 2 × 0.4 cm section of the primary motor cortex was dissected from the fixed brain tissue and subjected to sectioning and analyses described below.
Brain cryosectioning
Mouse and human brain sections were acclimated at −20°C overnight and cut with a Leica CM1950 cryostat at 30 μm-thick serial coronal sections and divided into 12-well dishes (mouse) or 6-well dishes (human). Brains were stored in 0.1 M PBS + 0.02% sodium azide at 4°C as free-floating sections before processing.
Characterization of CS standards by NMR
Disaccharides were resuspended in D2O (99.99%) containing 0.104 mM 3-(trimethylsilyl)-1-propanesulfonic acid (DSS). Data were collected on a Varian Unity Inova 500 MHz spectrometer equipped with a triple-resonance probe, z-axis pulsed-field gradient coil and a Standard Liquid Variable Temperature (VT) Controller, model VTC4 set to 25°C. 1H spectra were acquired without solvent suppression using a 7 s interscan relaxation delay. All data was processed, referenced to DSS and integrated using SpinWorks version 4.2.8. The integral values of the N-acetyl methyl proton resonances were compared directly to the integration value for the three equivalent methyl groups that are present in the calibration standard (DSS) as described previously (Bharti and Roy 2012) to determine the exact concentration of each disaccharide.
Optimizing CS-GAG digestion, isolation and purification
ChABC is a combinatorial lyase/enolase that selectively degrades all CS-GAG chains into their individual disaccharide units (Hamai et al. 1997; Prabhakar et al. 2009; Yamagata et al. 1968). When optimizing CS-GAG digestion of fixed brain sections, tissue thickness, enzyme concentration and incubation time were all taken into account and tested for optimal and efficient digestion. Enzymatic cleavage of CS- and HA-GAG chains is influenced by pH-sensitive ChABC substrate specificity, with optimal cleavage of the nonsulfated CS isomer and HA occurring at pH 6.8 (Hamai et al. 1997; Prabhakar et al. 2009; Yamagata et al. 1968). Meanwhile, substrate specificity for sulfated CS-GAGs increases at pH 8.0, a buffering condition where ChABC exhibits 4–6-fold less substrate specificity for 0S-CS and no substrate specificity for HA (Hamai et al. 1997; Prabhakar et al. 2009; Yamagata et al. 1968). In our analysis, we chose to use an ammonium bicarbonate buffering system set to pH 7.4, a pH condition where ChABC shows activity for both nonsulfated and sulfated GAG chains.
For the developmental series, 4–30 μm-thick PFA-fixed brain sections at bregma +2, −1, −3 and −6 mm were chosen as our rostral to caudal brain representation and performed in N = 3 (P21) or N = 4 (P7, P14, adult) individual mouse brains. For the human tissue analysis, 3–30 μm-thick formalin-fixed brain sections from the primary motor cortex were chosen for CS disaccharide extraction from a single human donor. Mouse brain sections were added to Corning 74 μm, 15 mm Netwell inserts (Sigma, CLS3477), and human sections were added to Corning 500 μm, 24 mm Netwell inserts (Sigma, CLS3480). Samples were washed 3× in Optima LC/MS-grade water and 1× in 50 mM ammonium bicarbonate (pH 7.4) at room temperature (RT). Enzyme digestion was performed using 500 mU/mL of ChABC (Sigma, C3667) reconstituted in 50 mM ammonium bicarbonate (pH 7.4) in a Thermo Scientific MaxQ 4000 orbital shaker at 80 rpm, 37°C, for 24 h. Supernatants were collected in sterile 1.7 mL microcentrifuge tubes and spun for 10 min at 14 k × g to pellet any debris. The supernatant was then dehydrated using a SpeedVac and the dried product was reconstituted in 50 μL of LC/MS-grade water.
Immunofluorescent labeling and fluorescent microscopy
Immediately after collecting the CS-containing supernatant, Netwells containing the digested tissue sections were transferred to 10 mM trisodium citrate (pH 8) and heated at 85°C for 20 min in a Fisher Scientific Isotemp Oven, simultaneously deactivating the residual ChABC enzyme and performing antigen retrieval for IF labeling. Immunostaining was performed according to our previously published methods (Mirzadeh et al. 2019). Briefly, free-floating tissue sections were permeabilized for 30 min at RT in 0.1 M PBS + 0.2% Triton X-100 and blocked for 2 h at 37°C in 0.1 M PBS + 0.05% Triton X-100 (PBST) + 10% normal donkey serum (Jackson ImmunoResearch). Sections were then incubated overnight at 4°C in a 1:1000 mix of biotin-labeled WFA (Sigma, L1516), aggrecan (Millipore, AB1031) and chondroitin-4-sulfate stub antibodies (Millipore, MAB2030) in PBST +1% donkey serum. The following day, the sections were washed and incubated for 2 h at RT in a 1:1000 mix of anti-streptavidin Alexa488, donkey anti-rabbit Alexa555 and donkey anti-mouse Alexa647 in PBST +1% donkey serum. Sections were then counterstained for dapi, mounted and cover slipped using Fluoromount-G (Thermo Fisher, 4958-02). Fluorescent microscopy was performed with a Zeiss AxioVision II microscope with Zeiss objectives (5× and 10×). Images were acquired and processed with Zen application software.
Characterization of CS disaccharides using MS/MS
Industry-grade CS disaccharide standards Δ0S- (OC28897), Δ4S- (OC28898), Δ6S- (OC01702), Δ4S6S- (OC28899) and HA disaccharide standard (OH11537) were purchased from Carbosynth (Berkshire, UK). The Δ2S6S-CS (CD006) disaccharide standard was purchased from Galen Laboratory Supplies (North Haven, CT). Acetonitrile (optima LC/MS-grade) and all other reagents were obtained from Fisher Scientific.
CS samples were analyzed using a triple quadrupole mass spectrometer equipped with an electrospray ion source (Waters Xevo TQ-S) operated in negative mode. DI-MS/MS samples were analyzed by direct injection in water at 0.2 mL/min. The mass spectrometer was operated in Q3 (fragment ion) scan mode selecting a precursor ion of either 458 or 538 and scanning for 277–305 m/z for 4S-, 6S-, 4S6S-CS and 230–305 m/z for 2S6S-CS. The electrospray voltage was set to −2.0 kV, cone voltage −30 V, source offset −60 V, source temperature 150°C and desolvation temperatures 200°C, and the cone and desolvation gas flow (N2) was set to 150 L/h and 500 L/h respectively. Nebulizer gas flow (N2) was set to 7.0 bar. Lower source voltages showed less in-source loss of sulfate; however, the loss in overall signal was substantial. These settings were found to be optimal for detection of low levels of CS disaccharides. Sodiated adducts were present at similar ratios for each CS and were not considered for this relative quantification approach.
LC–MS/MS was performed using a Waters ACQUITY I-CLASS ultra-performance liquid chromatographic (UPLC) system coupled to the same Waters Xevo TQ-S system. Disaccharides were resolved by porous graphitic chromatography as described previously with minor changes (Tomatsu et al. 2014). A Hypercarb column (2.1 × 50 mm, 3 μm, Thermo Fisher) was used at a flow rate of 0.3 mL/min and a column temperature of 50°C. 5 μL of samples were injected, and separation was achieved using the following gradient: A = 100 mM ammonium acetate, pH 9.5, B = 0.1% ammonium hydroxide in acetonitrile. The initial conditions were as follows: 100% A held 3 min then increased to 5% B over 7.5 min. The column was then washed with 90% B for 1 min and re-equilibrated at 100% A for 4 min, for a total run time of 15.5 min. This was found to provide optimal chromatographic resolution of every CS isomer. The mass spectrometer was operated in MRM mode in unit mass mode using the following conditions: capillary voltage −2.0 kV, source offset −60, source temperature 150°C, desolvation temperature 350°C, cone and desolvation gas flow set to 150 L/h and 1000 L/h respectively. Nebulizer gas flow (N2) was set to 7.0 bar. Cone voltage was set at −40 V for all analytes. Precursor and fragment transitions and collision energies (CE ranging from 5 to 40) for each MRM channel were optimized and found to be Δ4S-CS (CS-A) m/z 458 > 300 using a CE of 20, Δ4S6S-CS (CS-E) m/z 538 > 300 using a CE of 30, Δ0S-CS (CS-O) m/z 378 > 175 using a CE of 10, Δ6S-C S (CS-C) m/z 458 > 282 using a CE of 20 and Δ2S6S-CS m/z 268 > 282 using a CE of 10. MassLynx software version 4.1 (Waters) was used to acquire and quantify all data. Under these conditions, the ratios between peak areas produced from equimolar CS standard runs (performed under identical conditions) were shown to be consistent throughout the detectable range of quantification (i.e. 600 fmol–1.9 nmol) when normalized to the highest peak intensity (Figure S9). Relative quantification of each CS isomer within a sample was achieved using a modified peak area normalization function (Yu et al. 2014). Each CS isomer was expressed as a relative percent of the total CS isomer composition within a brain sample, and relative abundance was calculated using the following equation:
 |
where PB is the molar percent of the CS isomer in the brain sample, AB is the peak area of the CS isomer in brain samples and Fi is the normalization factor of individual CS isomers.
Statistical analyses used GraphPad Prism® 7.0 (Graph Pad Software, Inc., La Jolla, CA). Error bars represent the standard error of the mean (SEM).
Supplementary Material
Acknowledgements
We thank Ms. Kim Howard for the technical support for human tissue dissection and Ms. Allison Beller, who helped identify cases for this study.
Abbreviations
- AD, Alzheimer's disease; ChABC, chondroitinase ABC; CP, critical period; CS, chondroitin sulfate; CSPG, CS-proteoglycan; DI, direct infusion; DS-epi2, dermatan sulfate epimerase 2; DSS, 3-(trimethylsilyl)-1-propanesulfonic acid; ECM, extracellular matrix; ESI, electrospray ionization; FACE, fluorophore-assisted capillary electrophoresis; FFPE, formalin-fixed, paraffin-embedded; GalNAc, N-acetylgalactosamine; GlcA, glucuronic acid; HA, hyaluronan; HS, heparan sulfate; HSPG, HS proteoglycan; IACUC, Institutional Animal Care and Use Committee; IHC, immunohistochemical; LOD, limit of detection; LOQ, limit of quantification; MRM, multiple reaction monitoring; NBF, neutral buffered formalin; OCT, optimal cutting temperature; PFA, paraformaldehyde; PNN, perineuronal net; RT, room temperature; SULF, 6-O-endosulfatase; WFA, Wisteria floribunda agglutinin.
Funding
National Institutes of Health Award (R01GM127579 to M.G., RO1DK083042 to M.W.S., R01AG046619 to W.A.B., T32DK00724740 to K.M.A., T32AG052354 to A.F.L.); Nancy and Buster Alvord Endowment (to C.D.K.). The UW ADRC is supported by National Institutes of Health award (P50AG005136).
Conflict of interest statement
None declared.
References
- Antia IU, Mathew K, Yagnik DR, Hills FA, Shah AJ. 2018. Analysis of procainamide-derivatised heparan sulphate disaccharides in biological samples using hydrophilic interaction liquid chromatography mass spectrometry. Anal Bioanal Chem. 410:131–143. [DOI] [PubMed] [Google Scholar]
- Antia IU, Yagnik DR, Pantoja Munoz L, Shah AJ, Hills FA. 2017. Heparan sulfate disaccharide measurement from biological samples using pre-column derivatization, UPLC-MS and single ion monitoring. Anal Biochem. 530:17–30. [DOI] [PubMed] [Google Scholar]
- Bartolini B, Thelin MA, Rauch U, Feinstein R, Oldberg A, Malmstrom A, Maccarana M. 2012. Mouse development is not obviously affected by the absence of dermatan sulfate epimerase 2 in spite of a modified brain dermatan sulfate composition. Glycobiology. 22:1007–1016. [DOI] [PubMed] [Google Scholar]
- Beurdeley M, Spatazza J, Lee HH, Sugiyama S, Bernard C, Di Nardo AA, Hensch TK, Prochiantz A. 2012. Otx2 binding to perineuronal nets persistently regulates plasticity in the mature visual cortex. J Neurosci. 32:9429–9437. [DOI] [PMC free article] [PubMed] [Google Scholar]
- Bharti SK, Roy R. 2012. Quantitative 1H NMR spectroscopy. TrAC. 35:5–26. [Google Scholar]
- Blumcke I, Eggli P, Celio MR. 1995. Relationship between astrocytic processes and “perineuronal nets” in rat neocortex. Glia. 15:131–140. [DOI] [PubMed] [Google Scholar]
- Bruckner G, Brauer K, Hartig W, Wolff JR, Rickmann MJ, Derouiche A, Delpech B, Girard N, Oertel WH, Reichenbach A. 1993. Perineuronal nets provide a polyanionic, glia-associated form of microenvironment around certain neurons in many parts of the rat brain. Glia. 8:183–200. [DOI] [PubMed] [Google Scholar]
- Bruckner G, Bringmann A, Hartig W, Koppe G, Delpech B, Brauer K. 1998. Acute and long-lasting changes in extracellular-matrix chondroitin-sulphate proteoglycans induced by injection of chondroitinase ABC in the adult rat brain. Exp Brain Res. 121:300–310. [DOI] [PubMed] [Google Scholar]
- Cao E, Chen Y, Cui Z, Foster PR. 2003. Effect of freezing and thawing rates on denaturation of proteins in aqueous solutions. Biotechnol Bioeng. 82:684–690. [DOI] [PubMed] [Google Scholar]
- Carulli D, Pizzorusso T, Kwok JC, Putignano E, Poli A, Forostyak S, Andrews MR, Deepa SS, Glant TT, Fawcett JW. 2010. Animals lacking link protein have attenuated perineuronal nets and persistent plasticity. Brain. 133:2331–2347. [DOI] [PubMed] [Google Scholar]
- Carulli D, Rhodes KE, Brown DJ, Bonnert TP, Pollack SJ, Oliver K, Strata P, Fawcett JW. 2006. Composition of perineuronal nets in the adult rat cerebellum and the cellular origin of their components. J Comp Neurol. 494:559–577. [DOI] [PubMed] [Google Scholar]
- Deepa SS, Carulli D, Galtrey C, Rhodes K, Fukuda J, Mikami T, Sugahara K, Fawcett JW. 2006. Composition of perineuronal net extracellular matrix in rat brain: a different disaccharide composition for the net-associated proteoglycans. J Biol Chem. 281:17789–17800. [DOI] [PubMed] [Google Scholar]
- Deepa SS, Umehara Y, Higashiyama S, Itoh N, Sugahara K. 2002. Specific molecular interactions of oversulfated chondroitin sulfate E with various heparin-binding growth factors. Implications as a physiological binding partner in the brain and other tissues. J Biol Chem. 277:43707–43716. [DOI] [PubMed] [Google Scholar]
- Deepa SS, Yamada S, Fukui S, Sugahara K. 2007. Structural determination of novel sulfated octasaccharides isolated from chondroitin sulfate of shark cartilage and their application for characterizing monoclonal antibody epitopes. Glycobiology. 17:631–645. [DOI] [PubMed] [Google Scholar]
- Desaire H, Leary JA. 2000. Detection and quantification of the sulfated disaccharides in chondroitin sulfate by electrospray tandem mass spectrometry. J Am Soc Mass Spectr. 11:916–920. [DOI] [PubMed] [Google Scholar]
- Dick G, Tan CL, Alves JN, Ehlert EME, Miller GM, Hsieh-Wilson LC, Sugahara K, Oosterhof A, Kuppevelt TH, Verhaagen J et al. 2013. Semaphorin 3A binds to the perineuronal nets via chondroitin sulfate type E motifs in rodent brains. J Biol Chem. 288:27384–27395. [DOI] [PMC free article] [PubMed] [Google Scholar]
- Djerbal L, Lortat-Jacob H, Kwok J. 2017. Chondroitin sulfates and their binding molecules in the central nervous system. Glycoconj J. 34:363–376. [DOI] [PMC free article] [PubMed] [Google Scholar]
- Domon B, Costello CE. 1988. A systematic nomenclature for carbohydrate fragmentations in FAB-MS/MS spectra of glycoconjugates. Glycoconjugate J. 5:397–409. [Google Scholar]
- Dou W, Xu Y, Pagadala V, Pedersen LC, Liu J. 2015. Role of deacetylase activity of N-deacetylase/N-sulfotransferase 1 in forming N-sulfated domain in heparan sulfate. J Biol Chem. 290:20427–20437. [DOI] [PMC free article] [PubMed] [Google Scholar]
- Estrella RP, Whitelock JM, Packer NH, Karlsson NG. 2007. Graphitized carbon LC−MS characterization of the chondroitin sulfate oligosaccharides of aggrecan. Anal Chem. 79:3597–3606. [DOI] [PubMed] [Google Scholar]
- Gama CI, Tully SE, Sotogaku N, Clark PM, Rawat M, Vaidehi N, Goddard WA 3rd, Nishi A, Hsieh-Wilson LC. 2006. Sulfation patterns of glycosaminoglycans encode molecular recognition and activity. Nat Chem Biol. 2:467–473. [DOI] [PubMed] [Google Scholar]
- Giamanco KA, Matthews RT. 2012. Deconstructing the perineuronal net: cellular contributions and molecular composition of the neuronal extracellular matrix. Neuroscience. 218:367–384. [DOI] [PMC free article] [PubMed] [Google Scholar]
- Gill VL, Aich U, Rao S, Pohl C, Zaia J. 2013. Disaccharide analysis of glycosaminoglycans using hydrophilic interaction chromatography and mass spectrometry. Anal Chem. 85:1138–1145. [DOI] [PMC free article] [PubMed] [Google Scholar]
- Grobe K, Esko JD. 2002. Regulated translation of heparan sulfate N-acetylglucosamine N-deacetylase/n-sulfotransferase isozymes by structured 5′-untranslated regions and internal ribosome entry sites. J Biol Chem. 277:30699–30706. [DOI] [PubMed] [Google Scholar]
- Hamai A, Hashimoto N, Mochizuki H, Kato F, Makiguchi Y, Horie K, Suzuki S. 1997. Two distinct chondroitin sulfate ABC lyases. An endoeliminase yielding tetrasaccharides and an exoeliminase preferentially acting on oligosaccharides. J Biol Chem. 272:9123–9130. [DOI] [PubMed] [Google Scholar]
- Hartig W, Brauer K, Bruckner G. 1992. Wisteria floribunda agglutinin-labelled nets surround parvalbumin-containing neurons. Neuroreport. 3:869–872. [DOI] [PubMed] [Google Scholar]
- Hensch TK. 2005. Critical period plasticity in local cortical circuits. Nat Rev Neurosci. 6:877–888. [DOI] [PubMed] [Google Scholar]
- Hinneburg H, Korać P, Schirmeister F, Gasparov S, Seeberger PH, Zoldoš V, Kolarich D. 2017. Unlocking cancer glycomes from histopathological formalin-fixed and paraffin-embedded (FFPE) tissue microdissections. Mol Cell Proteomics. 16:524–536. [DOI] [PMC free article] [PubMed] [Google Scholar]
- Horii-Hayashi N, Sasagawa T, Matsunaga W, Nishi M. 2015. Development and structural variety of the dhondroitin sulfate proteoglycans-contained extracellular matrix in the mouse brain. Neural Plast. 2015:256389. [DOI] [PMC free article] [PubMed] [Google Scholar]
- Ito Y, Hikino M, Yajima Y, Mikami T, Sirko S, Holst A, Faissner A, Fukui S, Sugahara K. 2005. Structural characterization of the epitopes of the monoclonal antibodies 473HD, CS-56, and MO-225 specific for chondroitin sulfate D-type using the oligosaccharide library. Glycobiology. 15:593–603. [DOI] [PubMed] [Google Scholar]
- Kalus I, Rohn S, Puvirajesinghe TM, Guimond SE, Eyckerman-Kolln PJ, Ten Dam G, Kuppevelt TH, Turnbull JE, Dierks T. 2015. Sulf1 and Sulf2 differentially modulate heparan sulfate proteoglycan sulfation during postnatal cerebellum development: evidence for neuroprotective and neurite outgrowth promoting functions. PLoS One. 10:e0139853. [DOI] [PMC free article] [PubMed] [Google Scholar]
- Kang I, Harten IA, Chang MY, Braun KR, Sheih A, Nivison MP, Johnson PY, Workman G, Kaber G, Evanko SP et al. 2017. Versican deficiency significantly reduces lung inflammatory response induced by polyinosine-polycytidylic acid stimulation. J Biol Chem. 292:51–63. [DOI] [PMC free article] [PubMed] [Google Scholar]
- Karlsson NG, Schulz BL, Packer NH, Whitelock JM. 2005. Use of graphitised carbon negative ion LC-MS to analyse enzymatically digested glycosaminoglycans. J Chromatogr. B, Analytical technologies in the biomedical and life sciences. 824:139–147. [DOI] [PubMed] [Google Scholar]
- Karumbaiah L, Anand S, Thazhath R, Zhong Y, McKeon RJ, Bellamkonda RV. 2011. Targeted downregulation of N-acetylgalactosamine 4-sulfate 6-O-sulfotransferase (GalNAc4S6ST) significantly mitigates chondroitin sulfate proteoglycan (CSPG) mediated inhibition. Glia. 59:981–996. [DOI] [PMC free article] [PubMed] [Google Scholar]
- Katelaris A, Kencian J, Duflou J, Hilton JM. 1994. Brains at necropsy: to fix or not to fix? J Clin Pathol. 47:718–720. [DOI] [PMC free article] [PubMed] [Google Scholar]
- Kubaski F, Osago H, Mason RW, Yamaguchi S, Kobayashi H, Tsuchiya M, Orii T, Tomatsu S. 2017. Glycosaminoglycans detection methods: applications of mass spectrometry. Mol Genet Metab. 120:67–77. [DOI] [PMC free article] [PubMed] [Google Scholar]
- Kurokawa T, Tsuda M, Sugino Y. 1976. Purification and characterization of a lectin from Wistaria floribunda seeds. J Biol Chem. 251:5686–5693. [PubMed] [Google Scholar]
- Kwok JC, Carulli D, Fawcett JW. 2010. In vitro modeling of perineuronal nets: hyaluronan synthase and link protein are necessary for their formation and integrity. J Neurochem. 114:1447–1459. [DOI] [PubMed] [Google Scholar]
- Kwok JCF, Dick G, Wang D, Fawcett JW. 2011. Extracellular matrix and perineuronal nets in CNS repair. Dev Neurobiol. 71:1073–1089. [DOI] [PubMed] [Google Scholar]
- Kwok JCF, Foscarin S, Fawcett JW. 2015. Perineuronal nets: a special structure in the central nervous system extracellular matrix In: Leach JB, Powell EM, editors. Extracellular Matrix. Springer New York: New York, NY; p. 23–32. [Google Scholar]
- Lau C, Ng L, Thompson C, Pathak S, Kuan L, Jones A, Hawrylycz M. 2008. Exploration and visualization of gene expression with neuroanatomy in the adult mouse brain. BMC bioinformatics. 9:153. [DOI] [PMC free article] [PubMed] [Google Scholar]
- Lau LW, Cua R, Keough MB, Haylock-Jacobs S, Yong VW. 2013. Pathophysiology of the brain extracellular matrix: a new target for remyelination. Nat Rev Neurosci. 14:722–729. [DOI] [PubMed] [Google Scholar]
- Lensjo KK, Christensen AC, Tennoe S, Fyhn M, Hafting T. 2017. Differential expression and cell-type specificity of perineuronal nets in hippocampus, medial entorhinal cortex, and visual cortex examined in the rat and mouse. eNeuro. 4. [DOI] [PMC free article] [PubMed] [Google Scholar]
- Li Q, Wu X, Na X, Ge B, Wu Q, Guo X, Ntim M, Zhang Y, Sun Y, Yang J et al. 2019. Impaired cognitive function and altered hippocampal synaptic plasticity in mice lacking dermatan sulfotransferase Chst14/D4st1. Front Mol Neurosci. 12. [DOI] [PMC free article] [PubMed] [Google Scholar]
- Maeda N, Ishii M, Nishimura K, Kamimura K. 2011. Functions of chondroitin sulfate and heparan sulfate in the developing brain. Neurochem Res. 36:1228–1240. [DOI] [PubMed] [Google Scholar]
- Miller MJC, Costello CE, Malmström A, Zaia J. 2006. A tandem mass spectrometric approach to determination of chondroitin/dermatan sulfate oligosaccharide glycoforms. Glycobiology. 16:502–513. [DOI] [PMC free article] [PubMed] [Google Scholar]
- Mirzadeh Z, Alonge KM, Cabrales E, Herranz-Pérez V, Scarlett JM, Brown JM, Hassouna R, Matsen ME, Nguyen HT, Garcia-Verdugo JM et al. 2019. Perineuronal net formation during the critical period for neuronal maturation in the hypothalamic arcuate nucleus. Nat Metab. 1:212–221. [DOI] [PMC free article] [PubMed] [Google Scholar]
- Mitsunaga C, Mikami T, Mizumoto S, Fukuda J, Sugahara K. 2006. Chondroitin sulfate/dermatan sulfate hybrid chains in the development of cerebellum. Spatiotemporal regulation of the expression of critical disulfated disaccharides by specific sulfotransferases. J Biol Chem. 281:18942–18952. [DOI] [PubMed] [Google Scholar]
- Miyata S, Kitagawa H. 2015. Mechanisms for modulation of neural plasticity and axon regeneration by chondroitin sulphate. J Biochem. 157:13–22. [DOI] [PubMed] [Google Scholar]
- Miyata S, Kitagawa H. 2016. Chondroitin 6-sulfation regulates perineuronal net formation by controlling the stability of aggrecan. Neural Plast. 2016:1305801. [DOI] [PMC free article] [PubMed] [Google Scholar]
- Miyata S, Komatsu Y, Yoshimura Y, Taya C, Kitagawa H. 2012. Persistent cortical plasticity by upregulation of chondroitin 6-sulfation. Nat Neurosci. 15:414, s411–422, 412. [DOI] [PubMed] [Google Scholar]
- Morawski M, Bruckner G, Arendt T, Matthews RT. 2012. Aggrecan: beyond cartilage and into the brain. Int J Biochem Cell Biol. 44:690–693. [DOI] [PubMed] [Google Scholar]
- Najmabadi H, Hu H, Garshasbi M, Zemojtel T, Abedini SS, Chen W, Hosseini M, Behjati F, Haas S, Jamali P et al. 2011. Deep sequencing reveals 50 novel genes for recessive cognitive disorders. Nature. 478:57–63. [DOI] [PubMed] [Google Scholar]
- Oguma T, Toyoda H, Toida T, Imanari T. 2001. Analytical method of chondroitin/dermatan sulfates using high performance liquid chromatography/turbo ionspray ionization mass spectrometry: application to analyses of the tumor tissue sections on glass slides. Biomed Chromatogr. 15:356–362. [DOI] [PubMed] [Google Scholar]
- Osago H, Shibata T, Hara N, Kuwata S, Kono M, Uchio Y, Tsuchiya M. 2014. Quantitative analysis of glycosaminoglycans, chondroitin/dermatan sulfate, hyaluronic acid, heparan sulfate, and keratan sulfate by liquid chromatography-electrospray ionization-tandem mass spectrometry. Anal Biochem. 467:62–74. [DOI] [PubMed] [Google Scholar]
- Prabhakar V, Capila I, Soundararajan V, Raman R, Sasisekharan R. 2009. Recombinant expression, purification, and biochemical characterization of chondroitinase ABC II from Proteus vulgaris. J Biol Chem. 284:974–982. [DOI] [PMC free article] [PubMed] [Google Scholar]
- Properzi F, Carulli D, Asher RA, Muir E, Camargo LM, Kuppevelt TH, Dam GB, Furukawa Y, Mikami T, Sugahara K et al. 2005. Chondroitin 6-sulphate synthesis is up-regulated in injured CNS, induced by injury-related cytokines and enhanced in axon-growth inhibitory glia. Eur J Neurosci. 21:378–390. [DOI] [PubMed] [Google Scholar]
- Reuter MS, Musante L, Hu H, Diederich S, Sticht H, Ekici AB, Uebe S, Wienker TF, Bartsch O, Zechner U et al. 2014. NDST1 missense mutations in autosomal recessive intellectual disability. Am J Med Genet A. 164:2753–2763. [DOI] [PubMed] [Google Scholar]
- Saad OM, Leary JA. 2003. Compositional analysis and quantification of heparin and heparan sulfate by electrospray ionization ion trap mass spectrometry. Anal Chem. 75:2985–2995. [DOI] [PubMed] [Google Scholar]
- Schenauer MR, Meissen JK, Seo Y, Ames JB, Leary JA. 2009. Heparan sulfate separation, sequencing, and isomeric differentiation: ion mobility spectrometry reveals specific iduronic and glucuronic acid-containing hexasaccharides. Anal Chem. 81:10179–10185. [DOI] [PMC free article] [PubMed] [Google Scholar]
- Sethi MK, Zaia J. 2017. Extracellular matrix proteomics in schizophrenia and Alzheimer’s disease. Anal Bioanal Chem. 409:379–394. [DOI] [PMC free article] [PubMed] [Google Scholar]
- Shao C, Shi X, Phillips JJ, Zaia J. 2013. Mass spectral profiling of glycosaminoglycans from histological tissue surfaces. Anal Chem. 85:10984–10991. [DOI] [PMC free article] [PubMed] [Google Scholar]
- Shipp EL, Hsieh-Wilson LC. 2007. Profiling the sulfation specificities of glycosaminoglycan interactions with growth factors and chemotactic proteins using microarrays. Chem Biol. 14:195–208. [DOI] [PubMed] [Google Scholar]
- Siddiqui S, Horvat-Broecker A, Faissner A. 2009. Comparative screening of glial cell types reveals extracellular matrix that inhibits retinal axon growth in a chondroitinase ABC-resistant fashion. Glia. 57:1420–1438. [DOI] [PubMed] [Google Scholar]
- Sikora AS, Delos M, Martinez P, Carpentier M, Allain F, Denys A. 2016. Regulation of the expression of heparan sulfate 3-O-sulfotransferase 3B (HS3ST3B) by inflammatory stimuli in human monocytes. J Cell Biochem. 117:1529–1542. [DOI] [PubMed] [Google Scholar]
- Slaker ML, Harkness JH, Sorg BA. 2016. A standardized and automated method of perineuronal net analysis using Wisteria floribunda agglutinin staining intensity. IBRO Reports. 1:54–60. [DOI] [PMC free article] [PubMed] [Google Scholar]
- Sorg BA, Berretta S, Blacktop JM, Fawcett JW, Kitagawa H, Kwok JC, Miquel M. 2016. Casting a wide net: Role of perineuronal nets in neural plasticity. J Neurosci. 36:11459–11468. [DOI] [PMC free article] [PubMed] [Google Scholar]
- Sugiura N, Shioiri T, Chiba M, Sato T, Narimatsu H, Kimata K, Watanabe H. 2012. Construction of a chondroitin sulfate library with defined structures and analysis of molecular interactions. J Biol Chem. 287:43390–43400. [DOI] [PMC free article] [PubMed] [Google Scholar]
- Tekotte H, Engel M, Margolis RU, Margolis RK. 1994. Disaccharide composition of heparan sulfates: brain, nervous tissue storage organelles, kidney, and lung. J Neurochem. 62:1126–1130. [DOI] [PubMed] [Google Scholar]
- Testa D, Prochiantz A, Di Nardo AA. 2019. Perineuronal nets in brain physiology and disease. Semin Cell Dev Biol. 89:125–135. [DOI] [PubMed] [Google Scholar]
- Tomatsu S, Shimada T, Mason RW, Kelly J, LaMarr WA, Yasuda E, Shibata Y, Futatsumori H, Montaño AM, Yamaguchi S et al. 2014. Assay for glycosaminoglycans by tandem mass spectrometry and its applications. J Anal Bioanal Tech. 2014:006–006. [DOI] [PMC free article] [PubMed] [Google Scholar]
- Turiák L, Shao C, Meng L, Khatri K, Leymarie N, Wang Q, Pantazopoulos H, Leon DR, Zaia J. 2014. Workflow for combined proteomics and glycomics profiling from histological tissues. Anal Chem. 86:9670–9678. [DOI] [PMC free article] [PubMed] [Google Scholar]
- Vazquez-Sanroman DB, Monje RD, Bardo MT. 2017. Nicotine self-administration remodels perineuronal nets in ventral tegmental area and orbitofrontal cortex in adult male rats. Addict Biol. 22:1743–1755. [DOI] [PMC free article] [PubMed] [Google Scholar]
- Wei W, Ninonuevo MR, Sharma A, Danan-Leon LM, Leary JA. 2011. A comprehensive compositional analysis of heparin/heparan sulfate-derived disaccharides from human serum. Anal Chem. 83:3703–3708. [DOI] [PMC free article] [PubMed] [Google Scholar]
- Yabe T, Hata T, He J, Maeda N. 2005. Developmental and regional expression of heparan sulfate sulfotransferase genes in the mouse brain. Glycobiology. 15:982–993. [DOI] [PubMed] [Google Scholar]
- Yamagata T, Saito H, Habuchi O, Suzuki S. 1968. Purification and properties of bacterial chondroitinases and chondrosulfatases. J Biol Chem. 243:1523–1535. [PubMed] [Google Scholar]
- Yi JH, Katagiri Y, Susarla B, Figge D, Symes AJ, Geller HM. 2012. Alterations in sulfated chondroitin glycosaminoglycans following controlled cortical impact injury in mice. J Comp Neurol. 520:3295–3313. [DOI] [PMC free article] [PubMed] [Google Scholar]
- Yu S, Dong J, Zhou W, Yang R, Li H, Zhao H, Zhang T, Guo H, Wang S, Zhang C et al. 2014. A rapid and precise method for quantification of fatty acids in human serum cholesteryl esters by liquid chromatography and tandem mass spectrometry. Journal of Chromatography B. 960:222–229. [DOI] [PubMed] [Google Scholar]
- Zaia J. 2009. On-line separations combined with MS for analysis of glycosaminoglycans. Mass Spectrom Rev. 28:254–272. [DOI] [PMC free article] [PubMed] [Google Scholar]
- Zaia J, Costello CE. 2001. Compositional analysis of glycosaminoglycans by electrospray mass spectrometry. Anal Chem. 73:233–239. [DOI] [PubMed] [Google Scholar]
- Zaia J, McClellan JE, Costello CE. 2001. Tandem mass spectrometric determination of the 4S/6S sulfation sequence in chondroitin sulfate oligosaccharides. Anal Chem. 73:6030–6039. [DOI] [PubMed] [Google Scholar]
- Zhang H, Wood T, Young SP, Millington DS. 2015. A straightforward, quantitative ultra-performance liquid chromatography-tandem mass spectrometric method for heparan sulfate, dermatan sulfate and chondroitin sulfate in urine: an improved clinical screening test for the mucopolysaccharidoses. Mol Genet Metab. 114:123–128. [DOI] [PubMed] [Google Scholar]
- Zlokovic BV. 2008. The blood-brain barrier in health and chronic neurodegenerative disorders. Neuron. 57:178–201. [DOI] [PubMed] [Google Scholar]
Associated Data
This section collects any data citations, data availability statements, or supplementary materials included in this article.