

Abstract
The pyridinophane molecule L2 (3,6,9,15-tetraazabicyclo[9.3.1]penta-deca-1(15),11,13-trien-13-ol) has shown promise as a therapuetic for neurodegenerative diseases involving oxidative stress and metal ion misregulation. Protonation and metal binding stability constants with Mg2+, Ca2+, Cu2+, and Zn2+ ions were determined to further explore the therapeutic and pharmacological potential of this water soluble small molecule. These studies show that incorporation of an –OH group in position 4 of the pyridine ring decreases the pI values compared to cyclen and L1 (3,6,9,15-tetraazabicyclo[9.3.1]penta-deca-1(15),11,13-triene). Furthermore, this approach tunes the basicity of the tetra-aza macrocyclic ligand through the enhanced resonance stabilization of the –OH in position 4 and rigidity of the pyridine ring such that L2 has increased basicity compared to previously reported tetra-aza macrocycles. A metal binding preference for Cu2+, a redox cycling agent known to produce oxidative stress, indicates that this would be the in vivo metal target of L2. However, the binding constant of L2 with Cu2+ is moderated compared to cyclen due to the rigidity of the ligand and shows how ligand design can be used to tune metal selectivity. An IC50=298.0 µM in HT-22 neuronal cells was observed. Low metabolic liability was determined in both Phase I and II in vitro models. Throughout these studies other metal binding systems were used for comparison and as appropriate controls. The reactivity reported to date and pharmacological features described herein warrant further studies in vivo and the pursuit of L2 congeners using the knowledge that pyridine substitution in a pyridinophane can be used to tune the structure of the ligand and retain the positive therapeutic outcomes.
Keywords: Ligand, Pyridinophane, tetra-aza macrocycle, binding, transition metal-ion
Graphical Abstract
Incorporation of pyridol into 12-membered pyridinophanes results in exceptional metabolic stability, low-toxicity, and controlled metal binding suggesting good pharmacological potential.

Introduction
The range of applications suitable for tetra-aza macrocycles is broad and includes catalysis, imaging, and therapeutics. Therefore, detailed characterization can provide insight into the potential applications of new tetra-aza macrocycles. The pyridinophane macrocycle pyclen (L1=1,4,7,10-tetraaza-2,6-pyridinophane or 3,6,9,15-tetraaza-bicyclo [9.3.1]pentadeca- 1(14), 11(15), 12-triene) has been in the chemical literature for over three decades.1 Transition metal complexes derived from L1 have been studied by D.H. Busch and others, including our group.1–8 Recently, we introduced L2 and L3 (Figure 1).6, 9, 10 These molecules can be considered hybrids of the well-established cyclen with molecules 1 and 2. L2 and L3 represent only the 4th and 5th examples of pyridine-modified 12-membered tetra-aza congeners of L1 to date. For reference, molecule 3 was reported in 1990 by Takalo et al. as a reagent used to produce larger macrocyclic systems but not studied as a metal-binding system itself.11 The Gd3+ complex of 4 was explored as a potential MRI contrast agent.12 N-atom and C-C linker based modifications of L1 have been reported to a much broader degree.1, 13–16 For example, derivatization of the N-atoms of L1, much like those shown with 4, have resulted in molecules with coordination numbers that efficiently bind lanthanide(III) ions and have found applications as MRI contrast agents.3, 17 L1-derived biomolecular conjugates and larger macrocycles have also been explored for applications as bio-affinity probes. Therefore, the addition of L2 and L3 to the literature represented an opportunity for further advancement and application of 12-membered pyridine modified pyridinophane systems.5, 6, 18, 19 One such application has involved the initial use of L1 and advancement of L2 as a potential therapeutic for neurodegenerative diseases derived from oxidative stress.9, 20
Figure 1.

Structure and abbreviations of the ligands described in the text.
Reactive oxygen species are generated by both endogenous and exogenous sources.21–27 If the body does not balance endogenous sources of reactive oxygen species with antioxidants or cannot combat exogenous sources of reactive oxygen species, the subsequent damage results in the rapid progression of various diseases. Reactive oxygen species can be rapidly produced by Fenton or Haber-Weiss type reduction/oxidation reactions if transition metal-ions are allowed to react with the copious amounts of oxygen in brain tissue; therefore, transition metal ions must be carefully regulated.28–33 This imbalance is exacerbated when the activity of enzymes responsible for maintaining homeostasis of oxidative stress are modified.22, 34–36 Other mechanisms responsible for the generation of reactive oxygen species include altered antioxidant pathways and protein aggregation, such as the formation of amyloid-beta fibrils (Aβ). The products of the metal-ion redox chemistry and these other pathways include , , and .37–39 These species damage multiple components of tissues and cells as well as contribute to the development of neurodegenerative diseases.22, 28, 30 Moreover, oxidative stress promotes inflammation, a pathway also currently being targeted for its relationship with many disease states.40
Water soluble molecules L1 and L2 have been studied as potential therapeutics targeting neurodegenerative disorders characterized by transition metal ion misregulation in conjunction with oxidative stress.5–7 The macrocylic core of both L1 and L2 disrupt and prevent the metal-induced formation of Aβ plaques in vitro, presumably through preferential chelation.5 In particular, molecule L2 has shown strong therapeutic potential against oxidative stress through three separate pathways. (1) Ex vivo and cell culture studies indicate that both L1 and L2 are able to detoxify oxygen containing molecules by virtue of the aromatic N-ring. Molecule L2 has the addition of an –OH moiety that adds a built-in radical scavenging antioxidant reactivity that was inspired by nature (e.g. tannins) for integration into pyridinophane molecules.5, 7, 41, 42 (2) This multimodal rational design strategy transforms simple heterocyclic amines into potent agents targeting oxidative stress in biological systems.5, 7, 43 The amine coordinate donor atoms stabilize the copper(II/I) redox cycling to redox potentials > 400 mV more negative than the biological conditions necessary to produce reactive oxygen species.5–7 Cell culture studies have shown that L2 quenches 100% of radical based toxicity at a concentration of 125 nM induced by BSO in FRDA cells.5 (3) Molecule L2 induces upregulation of nuclear-factor (erythroid derived 2) related factor-2 (Nrf-2) at only a 50 nM concentration.44 This factor is responsible for endogenous antioxidant cellular defenses by regulating the transcription of cytoprotective antioxidant genes. Alterations in levels of expression of this gene are implicated in cancer and neurodegenerative diseases.22 Treatment of cells with molecule L2 induced Nrf2 expression and its downstream molecular target, NQO1 (increased antioxidant response) in a concentration dependent manner (50–250 nM) thus activating the cells’ own defense system against reactive oxygen species related to oxidative stress.44
To date, molecule L2 has presented promising reactivities that warrant further studies of therapeutic and pharmacological potential, which are described herein. Proton dissociation constants (pKa) of L2 were measured to understand the protonation state and subsequent charge at biological pH, which plays a large role in cellular uptake and tissue penetration. The use of metal-binding agents as therapeutics is a continued concern expressed by the pharmaceutical industry. Therefore, the metal association constants were determined using potentiometric and UV-vis titrations. The toxicity of L2 in HT-22 neuronal cells was determined as well. Finally, Phase I and II metabolic stabilities of L2 using microsomal and hepatocyte assays, respectively, provide evidence for a low metabolic liability of L2. The results are compared to other macrocycles and appropriate open chain ligands throughout these studies.
Results and Discussion
Determination of ligand basicity.
The protonation state of a complex at biological pH is an important factor used to predict pharmacological behavior. Specifically, pKa affects solubility, permeability, log D, and oral absorption by modulating the distribution of neutral and charged species. The protonation constants for L2 were obtained by fitting the pH-potentiometric data and the results were compared to measurements of pyridinophane congeners L1 and L3 (Table 1), as well as literature reports for cyclen and other related molecules (1–2, Figure 1) to determine how the structural differences in ligands would impact pKa values. Pyridinophanes L1-L3 contain three secondary amine atoms and one pyridine N-atom that all undergo protonation equilibria. Moreover, ligands L2 and L3 also contain hydroxyl groups capable of pH dependent protonation reactivity.
Table 1.
Protonation constantsa (pKa) of studied pyridinophanes L1-L4 and congeners discussed in this work (I=0.15 M NaCl and T=298 K).
| cyclenb | L1 | L2 | L3 | L4 | |
|---|---|---|---|---|---|
| log K1H | 10.66 | 11.37 (1) | 11.56(3) | 11.16(1) | 10.47(1) |
| log K2H | 9.69 | 8.22(5) | 9.05(5) | 9.46(2) | 7.76(2) |
| log K3H | 1.41 | 1.61(5) | 5.45(6) | 6.91(2) | 2.35(4) |
| log K4H | – | – | 1.68(5) | 2.17(3) | – |
| ∑ log KiH | 21.76 | 21.20 | 27.74 | 29.70 | 20.58 |
| ∑ log KN-donors | 21.76 | 21.20 | 22.29 | 22.79 | 20.58 |
Defined as KiH = [HiLi+]/([H+][Hi-1L(i−1)+]) for i = 1–4.
ref. 45 (I=0.15 M, NaClO4).
Four protonation constants were determined for L2 and L3 using potentiometric methods (Table 1). The measurement for L1 was also carried out under the same conditions and reported here; the results are in good agreement with literature (I=0.15 M, NaClO4).46 The presence of an –OH moiety in the pyridine ring of L2 and L3 compared to L1 provides another protonation step and generates significant changes to those remaining. In addition, the pKa values determined for each protonation step are highly dependent on the position of substitution on the pyridine ring: L2, 4-hydroxy vs. L3, 3-hydroxy. The 1H NMR titration curve (Figure 2) shows the effect of the consecutive protonation steps on the basic sites of L2. The first protonation occurs on the N(2)-atom based on the shift in the resonances associated with protons c and d on the fully deprotonated form of [L2]− observed with the first equivalent of acid (Figure 3). Assignment of the second protonation step must consider the most stable resonance structure of L2, which is boxed in Figure 3. This keto-resonance form could be considered to have a formal double bond, thus placing significant electron density on C3 and C5. Therefore, only subtle changes in the resonance of Ha are expected between [H(L2)]0 → [H2(L2)]+, as observed. Moreover, the chemical shifts attributed to Hb and Hc do not shift noticeably downfield at the pH values corresponding to the second protonation step. Such a shift would be expected if protonation of either N(1) or N(3) occurred concomitant to rearrangement of the proton from N(2), which was previously reported for L1 by Costa (Figure 3).47 Furthermore, the observed bathochromic and hyperchromic shifts from pH 11 to pH 8 in the L2 UV titrations point to the same changing/extending conjugated electron system (Figure S3). L3 does not have this type of resonance stabilization and this UV shift is not observed at any of the protonation steps (Figure S6). Addition of the third equivalent of acid (pD = 6.5 – 4.5) results in a drastic shift in resonance a and indicates protonation of the O-atom, which would be expected for a conversion of keto-enol rearrangement. This is further confirmed by comparison to molecule L4 (Figure 1), the benzyl protected congener of L2. In particular, a large difference in the log K2H versus log K3H values of L4 is observed: Δ[log K2H – log K3H] = 5.41. Finally, the shift in resonances c and d are consistent with the proton rearrangement and subsequent re-protonation of N(2) shown in Figure 3.47 The final N(4) protonation step is outside the measurable window of the experimental setup but expected to be < 1.47 Based on these results, a similar protonation pathway is anticipated for L3 (Figure S3).
Figure 2.

pH dependent 1H resonance shifts measured for L2.
Figure 3.
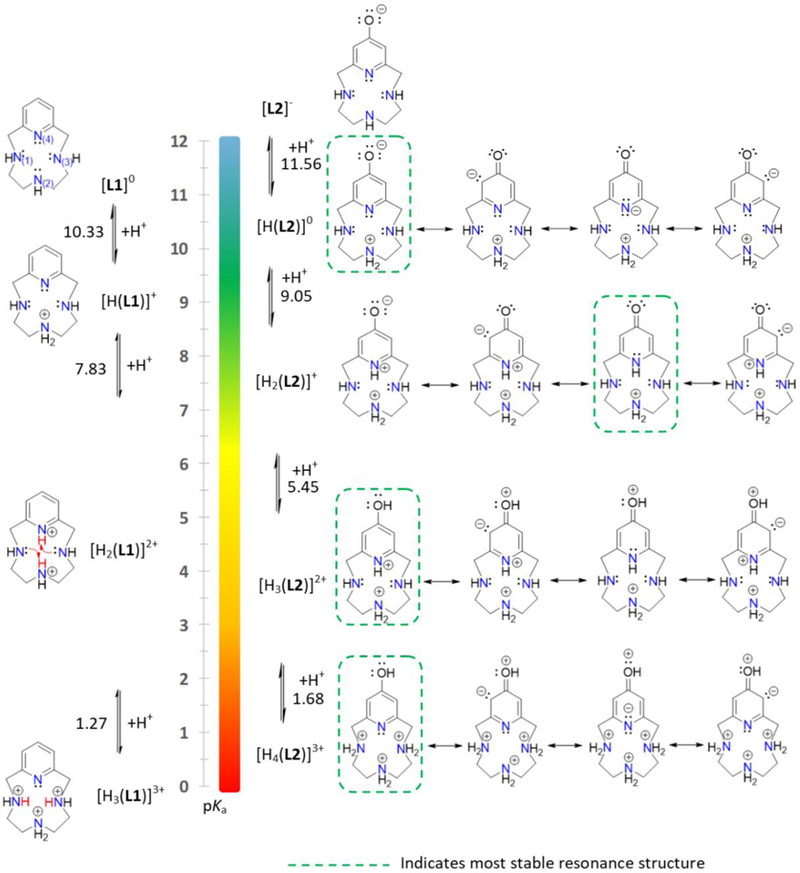
Comparison of protonation constants for L1 and L2 and associated resonance structures for L2.
Overall, the N-donor atoms (∑ log KN-donorsH, Table 1) of both L2 and L3 are an order of magnitude more basic compared to L1 and moderately more basic (+0.5) than cyclen. This demonstrates that the presence of the electron donating -OH group on the pyridine ring compensates for the electron withdrawing nature of the aromatic system itself. The results are consistent with previous studies that showed L2 and L3 to be stronger donors than L1 based on cyclic voltammetry studies of the copper(II) complexes.6 The resonance structures of L2 place electron density localized on the N(4)-atom, C3, and C5 positions of the pyridine ring, which are more favorable than those of L3 (Figure 3 and S4). Therefore, the acidification reaction is less favorable than due to the enhanced stability of the L2 resonance structure. Likewise, the protonation of the O-atom (log K3H) for L2 (5.45) requires more acidic conditions compared to L3 (6.91). These results show the sensitivity of the pKa values to differences in pyridinophane systems L1-L3 and can be harnessed in future applications of L1-L3 and the design of subsequent daughter molecules.
Overall, the results indicate that at biological pH the [H2(L2)]+ species would be predominant and account for 97% of the species in solution (Figure 4). The isoelectric point of L2 (pI = 10.31) is more basic compared to typical pharmaceutical molecules (pI=5–9), which may be a feature for improvement in the future work.48–50 Finally, the acidity constants assigned to the –OH moiety of L2 and L3 were determined to be lower than typical aromatic –OH functionalities: 4-pyridol (11.09), 3-pyridol (8.72) and 2 (10.75).51, 52 In fact, the pyridol -OH acidity constants of L2 (5.45(6)) and L3 (6.91(2)) were observed to be within the range of biological pH. This interesting observation could be applied specifically to imaging or sensing applications in future work.
Figure 4.

Overlay of the equilibrium distribution diagrams of L2 (solid lines) and L3 (dashed lines).
Metal-binding studies.
As a means of assessing the thermodynamic stability and future applications of L2 and its congeners, the metal binding constants of L2 and L3 were determined for biologically relevant metal ions including Mg2+, Ca2+, Cu2+, and Zn2+ and compared to cyclen and L1 (Table 2).
Table 2.
Compositions and formation constants (log βpqr) of the species formed in cyclen, L1, L2, and L3 with Mg2+ and Ca2+. (I=0.15 M NaCl and T=298 K).
Potentiometric titrations were used to measure the formation constants of L1-L3 with the alkaline earth metals Mg2+ and Ca2+. Interestingly, the log β values of L1-L3 for Mg2+ increase over two orders of magnitude compared to cyclen.53 In contrast, the log β values for Ca2+ incrementally increase from cyclen54 (3.12) < L1 (3.65) < L2 (4.17) < L3 (4.46). While open chain ligands often prefer Ca2+, the preference shifts to Mg2+ with the less flexible pyridinophane ligands. Pyridinophane macrocycles L1-L3 have increased rigidity compared to cyclen thanks to the six membered pyridine ring and this results in an increase in metal-binding affinity of small divalent cationic ions for these ligands.53, 55 The difference is largely attributed to the cavity size of the pyridinophane macrocycles providing a better match for Mg2+ (Ir=0.72 Å) compared to Ca2+ (Ir=1.00 Å).56 This observation is consistent with L2 and other 12-membered tetraazamacrocycles showing high affinity for first row transition metals like Cu2+ (Ir = 0.73 Å) that have ionic radii closer to Mg2+, which will be discussed below.
The potential for L2 and L3 to exist in different resonance forms gives rise to identifiable differences in metal binding properties at different pH ranges. For example, the [ML] species of Mg2+ and Ca2+ both favor L3. However, the [MHL] species for both metal cations result in a larger log β value with L2. These differences are attributed to the [MHL] resonance structures predicted for L2 that have electron density on the pyridine N-atom, which will stabilize the [MHL] complexes with Mg2+ and Ca2+. The [MHL] species of L3 does not form such a structure. The affinity studies further support that the position of the hydroxyl group on the pyridol ring provided significant differences to tune the interaction of the ligands L2 and L3 with cations.
Formation constants were also determined using potentiometric and/or UV-vis titrations for both L2 and L3 with Cu2+ and Zn2+ transition metal-ions as a compliment to interests in using L2 as a therapeutic for diseases involving oxidative stress derived from metal-ion misregulation.5–7, 59–61 The formation of the Ni2+ complexes were too slow for evaluation but the complexes themselves are known, albeit in low yields (Figure 5).6 The formation constants of cyclen and L1 with Cu2+ and Zn2+ have been previously described in a series of reports by others and are included for comparison (Table 3).47, 57, 58, 62 Pyridinophane ligands L1-L3 readily support octahedral, trigonal bipyramidal, and square pyramidal geometries but are less flexible than cyclen. Therefore, for metals that are stable in these geometries, the binding stablity constants parallel the order of ligand basicity as observed with Zn2+. However, ligands L1-L3 cannot readily accomodate the Jahn-Taller distortions induced by the Cu2+ metal. Therefore, cyclen has an increased stability with Cu2+ compared to the pyridinophane ligands. As shown in Figure 5, pyridinophane ligands like L1-L3 form five coordinate cupric complexes that vary between trigonal bipyramidal and square pyramidal geometries; this behavior is not observed in other metal complexes within this series.6 The decrease in stability between Cu2+ and L2 is attributed to the additional resonance structures of L2 adding to the donor strength of the ligand. However, the Cu2+ species cannot accomodate this interaction due to the lack of ligand flexibility, thereby lowering the log β value of L2 with Cu2+ compared to cyclen. L2 has higher selctivity for Zn2+ and lower selectivity for Cu2+ compared to the series evaluated here. This is evidenced by the magnitude of difference between Zn2+ and Cu2+ metal-binding affinities being six orders of magnitude for cyclen, L1, and L3.47, 57, 58 However, the difference is only two orders of magnitude for L2. Altogether, these results show that metal binding geometry may play a larger role in transition metal-ion formation constants and that metal ion preference varies greatly between the molecules studied. Furthermore, the results validate that Cu2+ ions would be the most likely target for L2 to interact with in a biological context where metal ion misregulation is occuring. Moreover, the studies show that incorporation of and modification to a pyridine ring can be used to tune metal binding properties.63–66
Figure 5.

Transition metal coordination varies for L1 – L3 with different transition metal ions. Examples include (a) Cu(L2)Cl+ and (b) (Ni(L2)µ-Cl)22+. These structure were previously reported in ref 6. Counter ions have been removed for clarity.
Table 3.
Compositions and formation constants (log βpqr) of the species formed in cyclen, L1, L2, and L3 with transition metal dications. (I=0.15 M NaCl and T=298 K).
| Metal ion | Eq. | Cyclen | L1 | L2 | L3 |
|---|---|---|---|---|---|
| Cu2+ | [ML]/[M][L] | 23.3d | 20.14b | 19.16(11) | 22.66(4) |
| [MHL]/[M][L][H+] | – | – | 25.79(3) | 29.04(4) | |
| [MH2L]/[M][L][H+]2 c | – | – | 28.38(5)a | 30.53(5)a | |
| [ML]/[M][L][OH−] | – | 7.48c | 8.55(13) | 12.67(4) | |
| Zn2+ | [ML]/[M][L] | 16.2e | 14.40f | 17.18(7) | 16.83(6) |
| [MHL]/[M][L][H+] | – | – | 23.02(3) | 23.82(3) | |
| [MH2L]/[M][L][H+]2 | – | – | 25.72(7) | 27.04 (5) | |
| [ML]/[M][L][OH−] | – | 8.50f | 8.92(9) | 7.99(7) |
Cell Toxicity Studies.
The interest in using L2 for therapeutic applications prompted cell toxicity studies to be carried out in a HT-22 mouse hippocampal neuronal cell line. The results of concentration dependent dosing with L2 and measurements of cell viability with MTT yielded the calculated IC50 values shown in Table 4. The results are compared to the L1 parent compound as well as cyclen. Comparison of IC50 values in neuronal cell culture indicates that L2 is the least toxic compound with an IC50 value of 298.0 µM, compared to L1 (IC50 = 231.8 µM) and cyclen (IC50 = 73.63 µM). These results suggest that the presence of the hydroxyl group on L2 provides biocompatability within the molecules evaluated in neuronal cell culture. Therapeutic windows are ideally 102-103 or less than the toxicity of a molecule. Therefore, the results show that L2 can be explored for its antioxidant, protective effects at nanomolar concentrations. Furthermore, this data helps alleviate any concerns regarding metal binding disrupting normal pathways essential in cellular homeostasis.
Table 4.
Cell Toxicity data for cyclen, L1,and L2 with HT-22 neuronal cells.
| IC50 (µM) | |
|---|---|
| Cyclen | 73.63 ± 1.13 |
| L1 | 231.8 ± 1.2 |
| L2 | 298.0 ± 1.1 |
Metabolic Stability.
Metabolic stability is a measurable parameter that refers to the susceptibility of compounds to biotransformation. It is a major consideration when screening new drug entities for favourable pharmacokinetic properties.67 Metabolic stability influences both oral bioavailability and plasma half-life of a compound, which in turn, affect the efficacy of the drug. Good metabolic stability is important for achieving therapeutic concentrations for the sufficient amount of time in vivo. Therefore, molecule L2 was evaluated using two in vitro assay approaches to gauge applicability as a therapeutic.
Phase I metabolism is associated with oxidation or reduction reactions facilitated by Cytochrome P450 and Flavin monoxygenase (FMO) enzymes.68–70 Murine liver microsomes in the presence of an NADPH regenerating system were used to model this form of metabolism. The in vitro half-life was determined by the method of substrate depletion.71 As shown in Figure 7, molecule L2 showed high stability in the Phase I metabolic study with half-lives greater than 120 min. At the termination of monitoring the experiment, 65% of molecule L2 was retained. From this data, the intrinsic clearance (Clint) was determined to be 11.55 µL/min/million cells, which classifies L2 as a low-moderate clearance molecule.72 Compounds with high clearance are generally considered to be unfavorable as they are likely to be rapidly cleared in vivo resulting in a short duration of action. However, these results indicate that the simple macrocyclic structure of L2 has strong resistance to structural modifications by the Phase I metabolic pathways.
Figure 7.
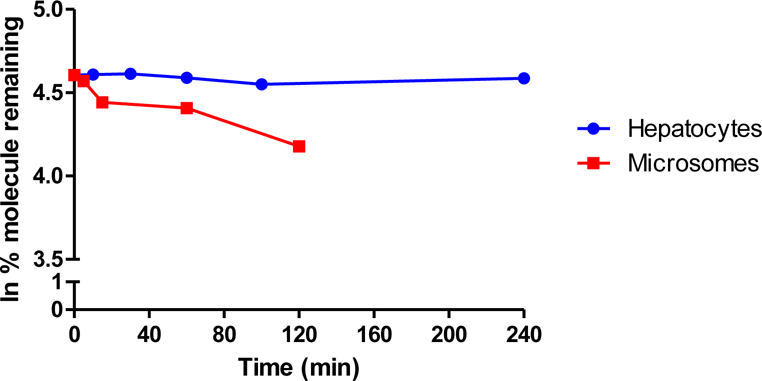
Metabolic stability of L2 in mouse microsomes (Phase I oxidation and reduction reactions) and mouse hepatocytes (Phase I and II oxidation/reduction and conjugation reactions) measured as a function of % molecule remaining at each time point.
The positive results from studies using the liver microsome model for resistance to Phase I metabolism prompted a more rigorous investigation of potential metabolism. Intact hepatocytes are a model commonly used in drug discovery and preclinical drug development to establish the impact of drug-metabolizing enzymes related four categories of xenobiotic biotransformation: hydrolysis, reduction, oxidation and conjugation, which encompass both Phase I and Phase II metabolism.73 As shown in Figure 7, the half-life for molecule L2 in the hepatocyte model is greater than 240 min and correlates to calculated Clint <0.02 µL/min/million cells (low clearance). Exceptional stability in intact hepatocytes is further indicated by only 2–9% of L2 depleted over the time course of the experiment. The strong T1/2 and Clint values in both models suggest that L2 will have slow clearance, thus increasing the delivery of the molecule to the blood brain barrier. To the best of our knowledge, this is the first example of metabolic stability studies of a synthetic tetra-aza macrocyclic small molecules to date. The studies indicate that L2, which contain multiple C-N bonds that could be prone to modification in an open chain fashion, are stabilized against metabolic degradation when arranged in the 12-membered fashion observed with L2.
Conclusions
Molecule L2 was explored in depth for features suitable for a potential therapeutic molecule as it was shown in previous reports to provide positive attributes against oxidative stress. The results indicate that the molecule would be observed as predominately [H2(L2)]+ at pH 7.4 as a result of modification to the pyridine ring with an –OH group at position 4 of the pyridine ring compared to the dicationic species predicted for predecessor ligands [H2(L1)]2+ and [H2(cyclen)]2+. The highest metal affinity for L2 was determined to be for copper(II) (log KCu = 19.16(11)), which is attenuated by pyridinophane rigidity versus the flexible cyclen (23.3). This indicates that unregulated copper(II) ions, a major source of damaging ROS, would be the target if L2 were used in vivo but less likely to pertubate metal-ion trafficing or metalloenzyme processes compared to cyclen or other tradition macrocyclic scaffolds. Overall, the metal binding geometry of each ligand was observed to play a significant role in transition metal ion formation constants and should be a factor considered in future ligand design. Moreover, low toxicity (IC50=298.0 µM) in HT-22 neuronal cells was observed, which indicates a therapeutic window of nM or less. These studies also show that L2 is less toxic than parent molecules cyclen and L1 in neuronal cell culture, an encouraging observation for further biological studies. Finally, in vitro models of metabolism indicate that L2 has low metabolic liability indicated by long half-lives in both hepatocytes and microsomes. To the best of our knowledge, this is the first metabolic liability study of a small molecule tetra-aza macrocyle to date and the positive results should encourage further explorations of such systems. Altogether, these studies suggest that the antioxidant L2 molecule has the potential for therapeutic applications and further studies in animal models.
Experimental
General methods.
All reagents and solvents were obtained from commercial sources and used as received, unless noted otherwise. Ligands L1-L3 were produced as the 3HCl salt according to previously published procedures.4-6 Cyclen was purchased from TCI. Metabolic liability studies were carried out at the UT Southwestern Preclinical Pharmacology Core.
Potentiometeric Methods
The concentration of each ligand as well as its protonation constants were determined by using pH-potentiometric titrations. A Metrohm 785 DMP Titrino equipped with a Metrohm 6.0233.100 combined electrode was used to measure the pH in titration experiments. For the pH calibration of the electrode, KH-phthalate (pH 4.005) and borax (pH 9.177) buffers were used. The calculation of [H+] from the measured pH values was performed with the use of the method proposed by Irving et al.74 by titrating a 0.02 M HCl solution with a standardized NaOH solution (0.2 M). The differences between the measured and calculated pH values were used to obtain the [H+] concentrations from the pH-data collected in the titrations. The ion product of water was determined (pKw= 13.820) from the same experiment in the pH range 11.40–12.00. The ionic strength in the titrated and thermostat controlled (at 25 °C) samples of 6.00 mL was kept constant and set to 0.15 M NaCl. The samples were stirred by a mechanical stirrer and kept under inert gas atmosphere (N2) to avoid the effect of CO2.The protonation constants of the ligand were determined by direct pH-potentiometric titration by titration of 2.28 mM ligand solutions with a standardized NaOH solution in the pH range of 1.80–12.00. The stability constants of the metal complexes were determined using the direct pH-potentiometric method by titrating samples with 1 : 1 and 2 : 1 metal-to-ligand ratios (the number of data pairs were between 150–200), allowing 1 min for the sample equilibration to occur. In the presence of metal excess the titration was continued until the appearance of the precipitate (pH = 7–9). The protonation and stability constants were calculated from the titration data with the PSEQUAD program.75 The stability constant of the Cu2+ complexes was too high to be determined by pH-potentiometry, hence a direct UV-vis spectrophotometric method was used. The spectrophotometric measurements were performed with a Cary 100 Bio spectrophotometer at 25 °C, using semimicro 1.0 cm cells. For the determination of the stability constant, the absorbance was measured at different acid concentrations (0.01–0.15 M) at wavelengths between 600 and 850 nm (the concentration of the complex was 3.0 mM). The molar absorption coefficients of the CuCl2 and the protonated complexes were determined independently and were fixed during the stability constant calculations.
Cell Culture Methods.
The mouse neuronal hippocampal cell line (HT22) was obtained from the UNT Health Science Research Center, Fort Worth, TX. HT22 cells were cultured in Dulbecco’s Modified Eagle Medium supplemented with 100 units per mL penicillin/100 μg mL−1 streptomycin, 1 mM glutamine, and charcoal stripped fetal bovine serum (15%, Sigma Aldrich). Both cell lines were grown in a water-jacketed incubator at 37°C with 5% CO2 and 95% air atmospheric conditions). To prepare dilutions of compounds the same media was used excluding the addition of the serum and antibiotics. The data obtained was processed using Prism 5 for Windows to determine IC50 values presented. Analysis tables are available in supporting information.
The MTT (3-(4,5-dimethylthiazolyl-2)-2,5-diphenyltetrazolium bromide) assay was used to determine cell line sensitivity to the drugs used in this study. To perform this assay cells/well were plated into 96 well plates for 24 hours and then treated with increasing concentrations of the molecule of interest in replicates of 8 and incubated for 24 hours at 37°C. Medium was replaced by 100 µL of 1 mg/mL MTT in serum free medium. The cells were then incubated for 4 hours at 37°C, after which MTT was replaced by 100 µL of DMSO to solubilize the precipitate. The plate was placed in a shaker for 5 min and absorbance was measured at 540 nm using a plate reader (Molecular Dynamics).
In vitro Metabolism Models
Mouse Microsomes (Phase I): Male ICR/CD-1 mouse microsomes (Lot ZMC) were purchased from BioIVT (Baltimore, MD). 0.25 mg of microsomes were added on ice to a 50 mM Tris, pH 7.5 solution, containing L2 added from a DMSO stock. The final concentration of compound after addition of all reagents was 2 µM. An NADPH-regenerating system (1.7 mg/ml NADP, 7.8 mg/ml glucose-6-phosphate, 6 U/ml glucose-6-phosphate dehydrogenase in 2% w/v NaHCO3/10 mm MgCl2) was added for analysis of Phase I metabolism. The tube was then placed in a 37°C shaking water bath. At varying time points after addition of phase I cofactors, the reaction was stopped by the addition of 0.5 ml of acetonitrile containing an internal standard (IS), tolbutamide, and 0.2% formic acid to quench the reaction and precipitate protein. Time 0 samples were quenched prior to addition of compound or NADPH-regenerating system. The samples were incubated 10’ at RT and then spun at 16,100 × g for 5 min in a microcentrifuge. The supernatant was analyzed by LC-MS/MS. Analytical methods were developed for each compound using a Sciex (Foster City, CA) 4000 QTRAP®, a combination triple quadrupole/ion trap instrument. The parent ion and the two most prominent daughter ions were followed to confirm compound identity, although only the most abundant daughter was used for quantitation. L2 was monitored by the 223.1 to 180.1 transition and the tolbutamide IS as the 269.1 to 169.9 transition using the following ion source parameters: CUR = 25, CAD = high, IS = 4000, TEM =600, GS1 = 60, GS2 = 60. A Shimadzu (Columbia, MD) Prominence LC with Agilent C18 XDB column (5 micron packing; 50 × 4.6 mm) was used for chromatography under the following conditions: Buffer A: Water + 0.1% formic acid; Buffer B: MeOH + 0.1% formic acid; flow rate 1.5 mL/min; 0 – 1 min 3% B, 1.0–2.0 min gradient to 100% B, 2.0 – 3.5 min 100% B, 3.50 – 3.6 min gradient to 3% B, 3.6 – 4.5 3% B.
Mouse Hepatocytes (Phase I and II):
L2 (DMSO stock, 2 µM final) was incubated with murine hepatocytes (Lot NNS) for 0–240 min at 37C, 5% CO2. Final concentration of hepatocytes in reaction was 1×10⁶/mL. The enzymatic reaction was quenched with a two-fold volume of of acetonitrile containing 0.15% formic acid, and tolbutamide IS. Samples were vortexed for 15 seconds, incubated at RT for 10 min and spun for 5 min at 16,100 × g. Supernatant was collected and analyzed by LC-MS/MS as described above for the microsome stability assay.
The method described in McNaney, et al70 was used with modification for determination of metabolic stability half-life by substrate depletion. A “% remaining” value was used to assess metabolic stability of a compound over time. The LC-MS/MS peak area of the incubated sample at each time point was divided by the LC-MS/MS peak area of the time 0 (T0) sample and multiplied by 100. The natural log (ln) of the % remaining of compound was then plotted versus time (in min) and a linear regression curve plotted going through y-intercept at ln(100). If the metabolism of a compound failed to show linear kinetics at later time point, those time points were excluded. The half-life (T 1/2) was calculated as T 1/2 = 0.693/slope.To determine Intrinsic Clearance, the ln peak area ratio (compound peak area/internal standard peak area) is plotted against time and the gradient of the line determined.76–79
| (1) |
| (2) |
| (3) |
| (4) |
Supplementary Material
Figure 6.

MTT colorimetric response of HT22 cells after 24 hours of exposure to cyclen, L1, and L2 [1 nM-10 mM]. Error bars (minimum of n=8) for each measurement are shown in black.
Acknowledgements
Metabolic stability studies were conducted by the Preclinical Pharmacology Core at UT Southwestern Medical Center; the authors thank Dr. Noelle Williams for helpful conversations regarding these studies. This work was funded by the National Institutes of Health (R15GM123463 to KG and GA). The authors are also grateful for generous financial support from TCU Andrews Institute of Mathematics & Science Education (to KG) and TCU Research and Creativity Activity Grant (to KG). Gy.T. is grateful for the support arriving form the Hungarian National Research, Development and Innovation Office (NKFIH K-120224 project) and for the János Bolyai Research Scholarship of the Hungarian Academy of Sciences. Gy.T. thanks the scholarship supported by the ÚNKP-18–4 New National Excellence Program of the Ministry of Human Capacities. The research was also supported in a part by the EU and co-financed by the European Regional Development Fund under the projects GINOP-2.3.2–15-2016–00008 and GINOP-2.3.3–15-2016–00004 to Gy. T.
References Cited
- 1.Stetter H, Frank W and Mertens R, Tetrahedron, 1981, 37, 767–772. [Google Scholar]
- 2.Alcock NW, Busch DH and Liu CY, Journal, 2007.
- 3.Tircso G, Benyo ET, Suh EH, Jurek P, Kiefer GE, Sherry AD and Kovacs Z, Bioconjugate Chem, 2009, 20, 565–575. [DOI] [PMC free article] [PubMed] [Google Scholar]
- 4.Lincoln KM, Arroyo-Curras N, Johnston HM, Hayden TD, Pierce BS, Bhuvanesh N and Green KN, J Coord Chem, 2015, 68, 2810–2826. [Google Scholar]
- 5.Lincoln KM, Gonzalez P, Richardson TE, Julovich DA, Saunders R, Simpkins JW and Green KN, Chem. Commun, 2013, 49, 2712–2714. [DOI] [PMC free article] [PubMed] [Google Scholar]
- 6.Lincoln KM, Offutt ME, Hayden TD, Saunders RE and Green KN, Inorg Chem, 2014, 53, 1406–1416. [DOI] [PubMed] [Google Scholar]
- 7.Lincoln KM, Richardson TE, Rutter L, Gonzalez P, Simpkins JW and Green KN, Acs Chem Neurosci, 2012, 3, 919–927. [DOI] [PMC free article] [PubMed] [Google Scholar]
- 8.Johnston HM, Palacios PM, Pierce BS and Green KN, J Coord Chem, 2016, 69, 1979–1989. [Google Scholar]
- 9.Lincoln KM, Gonzalez P, Richardson TE, Rutter L, Julovich DA, Simpkins JW and Green KN, Chem. Commun, 2013, 49, 2712–2714. [DOI] [PMC free article] [PubMed] [Google Scholar]
- 10.United States Pat, 2014.
- 11.Takalo H and Kankare J, J Heterocyclic Chem, 1990, 27, 167–169. [Google Scholar]
- 12.Aime S, Cavallotti C, Gianolio E, Giovenzana GB, Palmisano G and Sisti M, Org Lett, 2004, 6, 1201–1204. [DOI] [PubMed] [Google Scholar]
- 13.Mishra AK, Draillard K, FaivreChauvet A, Gestin JF, Curtet C and Chatal JF, Tetrahedron Lett, 1996, 37, 7515–7518. [Google Scholar]
- 14.Siaugue JM, Segat-Dioury F, Sylvestre I, Favre-Reguillon A, Foos J, Madic C and Guy A, Tetrahedron, 2001, 57, 4713–4718. [Google Scholar]
- 15.Le Fur M, Molnár E, Beyler M, Fougère O, Esteban-Gómez D, Rousseaux O, Tripier R, Tircsó G and Platas-Iglesias C, Inorg Chem, 2018, 57, 6932–6945. [DOI] [PubMed] [Google Scholar]
- 16.Tseberlidis G, Intrieri D and Caselli A, Eur J Inorg Chem, 2017, 2017, 3589–3603. [Google Scholar]
- 17.Rojas-Quijano FA, Benyo ET, Tircso G, Kalman FK, Baranyai Z, Aime S, Sherry AD and Kovacs Z, Chem-Eur J, 2009, 15, 13188–13200. [DOI] [PMC free article] [PubMed] [Google Scholar]
- 18.Lincoln KM, Arroyo-Currás N, Johnston HM, Hayden TD, Pierce BS, Bhuvanesh N and Green KN, J. Coord. Chem, 2015, 68, 2810–2826. [Google Scholar]
- 19.Brewer SM, Palacios PM, Johnston HM, Pierce BS and Green KN, Inorg Chim Acta, 2018, 478, 139–147. [Google Scholar]
- 20.Green KN, Johnston HM, Burnett ME and Brewer SM, Comments on Inorganic Chemistry, 2017, 37, 146–167. [Google Scholar]
- 21.Tramutola A, Lanzillotta C, Perluigi M and Butterfield DA, Brain Research Bulletin, 2016. [DOI] [PubMed]
- 22.Niedzielska E, Smaga I, Gawlik M, Moniczewski A, Stankowicz P, Pera J and Filip M, Molecular Neurobiology, 2016, 53, 4094–4125. [DOI] [PMC free article] [PubMed] [Google Scholar]
- 23.Czerska M, Mikolajewska K, Zielinski M, Gromadzinska J and Wasowicz W, Medycyna Pracy, 2015, 66, 393. [DOI] [PubMed] [Google Scholar]
- 24.Zhao Y and Zhao BL, Oxid Med Cell Longev, 2013, Article ID 316523. [DOI] [PMC free article] [PubMed]
- 25.Dasuri K, Zhang L and Keller JN, Free radical biology & medicine, 2013, 62, 170–185. [DOI] [PubMed] [Google Scholar]
- 26.Gandhi S and Abramov AY, Oxid Med Cell Longev, 2012, 2012, 428010. [DOI] [PMC free article] [PubMed] [Google Scholar]
- 27.Federico A, Cardaioli E, Da Pozzo P, Formichi P, Gallus GN and Radi E, Journal of the Neurological Sciences, 2012, 322, 254–262. [DOI] [PubMed] [Google Scholar]
- 28.Sastre M, Ritchie CW and Hajji N, JSM Alzheimer’s Dis. Relat. Dement, 2015, 2, 1014. [Google Scholar]
- 29.Xu J, Begley P, Church SJ, Patassini S, McHarg S, Kureishy N, Hollywood KA, Waldvogel HJ, Liu H and Zhang S, Scientific Reports, 2016, 6. [DOI] [PMC free article] [PubMed] [Google Scholar]
- 30.Bush AI, J Alzheimers Dis, 2013, 33, S277–S281. [DOI] [PubMed] [Google Scholar]
- 31.Cardoso BR, Hare DJ, Lind M, McLean CA, Volitakis I, Laws SM, Masters CL, Bush AI and Roberts BR, Acs Chem Neurosci, 2017, 8, 1459–1464. [DOI] [PubMed] [Google Scholar]
- 32.Roberts BR, Ryan TM, Bush AI, Masters CL and Duce JA, J. Neurochem, 2012, 120, 149–166. [DOI] [PubMed] [Google Scholar]
- 33.Guilloreau L, Combalbert S, Sournia-Saquet A, Mazarguil H and Faller P, Chembiochem, 2007, 8, 1317–1325. [DOI] [PubMed] [Google Scholar]
- 34.Bonda DJ, Lee H.-g., Blair JA, Zhu X, Perry G and Smith MA, Metallomics, 2011, 3, 267–270. [DOI] [PMC free article] [PubMed] [Google Scholar]
- 35.Xu J, Church SJ, Patassini S, Begley P, Waldvogel HJ, Curtis MA, Faull RLM, Unwin RD and Cooper GJS, Metallomics, 2017, 9, 1106–1119. [DOI] [PubMed] [Google Scholar]
- 36.Kim TS, Pae CU, Yoon SJ, Jang WY, Lee NJ, Kim JJ, Lee SJ, Lee C, Paik IH and Lee CU, Int J Geriatr Psych, 2006, 21, 344–348. [DOI] [PubMed] [Google Scholar]
- 37.Faller P, Chembiochem, 2009, 10, 2837–2845. [DOI] [PubMed] [Google Scholar]
- 38.Hureau C and Faller P, Biochimie, 2009, 91, 1212–1217. [DOI] [PubMed] [Google Scholar]
- 39.Faller P, Hureau C, Dorlet P, Hellwig P, Coppel Y, Collin F and Alies B, Coordin Chem Rev, 2012, 256, 2381–2396. [Google Scholar]
- 40.Kumar DKV, Choi SH, Washicosky KJ, Eimer WA, Tucker S, Ghofrani J, Lefkowitz A, McColl G, Goldstein LE, Tanzi RE and Moir RD, Science Translational Medicine, 2016, 8, 340ra372–340ra372. [DOI] [PMC free article] [PubMed] [Google Scholar]
- 41.Steenken S and Oneill P, J Phys Chem-Us, 1979, 83, 2407–2412. [Google Scholar]
- 42.Savelieff MG, Nam G, Kang J, Lee HJ, Lee M and Lim MH, Chem Rev, 2019, 119, 1221–1322. [DOI] [PubMed] [Google Scholar]
- 43.Gonzalez P, da Costa VCP, Hyde K, Wu Q, Annunziata O, Rizo J, Akkaraju G and Green KN, Metallomics, 2014, 6, 2072–2082. [DOI] [PMC free article] [PubMed] [Google Scholar]
- 44.Sajja RK, Green KN and Cucullo L, PLOS, 2015, 10, e0122358. [DOI] [PMC free article] [PubMed] [Google Scholar]
- 45.Cabani S, Ceccanti N, Pardini R and Tiné MR, Polyhedron, 1999, 18, 3295–3303. [Google Scholar]
- 46.Martínez-Camarena Á, Liberato A, Delgado-Pinar E, Algarra AG, Pitarch-Jarque J, Llinares JM, Mañez MÁ, Domenech-Carbó A, Basallote MG and García-España E, Inorg Chem, 2018, 57, 10961–10973. [DOI] [PubMed] [Google Scholar]
- 47.Costa J and Delgado R, Inorg Chem, 1993, 32, 5257–5265. [Google Scholar]
- 48.Di L and Kerns EH, Curr Opin Chem Biol, 2003, 7, 402–408. [DOI] [PubMed] [Google Scholar]
- 49.Levene PA and Simms HS, J Biol Chem, 1923, 55, 801–813. [Google Scholar]
- 50.Tibbitts J, Canter D, Graff R, Smith A and Khawli LA, mAbs, 2016, 8, 229–245. [DOI] [PMC free article] [PubMed] [Google Scholar]
- 51.Jakusch T, Jin WZ, Yang LQ, Kiss T and Crans DC, J Inorg Biochem, 2003, 95, 1–13. [DOI] [PubMed] [Google Scholar]
- 52.Albert A and Phillips JN, Journal of the Chemical Society (Resumed), 1956, DOI: 10.1039/jr9560001294, 1294–1304. [DOI]
- 53.Ruangpornvisuti VW, Probst MM and Rode BM, Inorg Chim Acta, 1988, 144, 21–23. [Google Scholar]
- 54.Hancock RD, Shaikjee MS, Dobson SM and Boeyens JCA, Inorg Chim Acta, 1988, 154, 229–238. [Google Scholar]
- 55.Tircso G, Regueiro-Figueroa M, Nagy V, Garda Z, Garai T, Kalman FK, Esteban-Gomez D, Toth E and Platas-Iglesias C, Chemistry, 2016, 22, 896–901. [DOI] [PubMed] [Google Scholar]
- 56.Shannon RD, Acta crystallographica section A: crystal physics, diffraction, theoretical and general crystallography, 1976, 32, 751–767. [Google Scholar]
- 57.Thom VJ, Hosken GD and Hancock RD, Inorg Chem, 1985, 24, 3378–3381. [Google Scholar]
- 58.Hancock RD, Dobson SM, Evers A, Wade PW, Ngwenya MP, Boeyens JCA and Wainwright KP, J Am Chem Soc, 1988, 110, 2788–2794. [Google Scholar]
- 59.Yepremyan A, Mehmood A, Brewer SM, Barnett MM, Janesko BG, Akkaraju G, Simanek EE and Green KN, RSC Advances, 2018, 8, 3024–3035. [DOI] [PMC free article] [PubMed] [Google Scholar]
- 60.Gonzalez P, Pota K, Turan LS, da Costa VCP, Akkaraju G and Green KN, Acs Chem Neurosci, 2017, 8, 2414–2423. [DOI] [PubMed] [Google Scholar]
- 61.Savelieff MG, Nam G, Kang J, Lee HJ, Lee M and Lim MH, Chem Rev, 2018. [DOI] [PubMed]
- 62.Thom VJ and Hancock RD, J Chem Soc Dalton, 1985, 1877–1880.
- 63.Rubino JT and Franz KJ, J Inorg Biochem, 2012, 107, 129–143. [DOI] [PubMed] [Google Scholar]
- 64.Zheng Z, White C, Lee J, Peterson TS, Bush AI, Sun GY, Weisman GA and Petris MJ, J. Neurochem, 2010, 114, 1630–1638. [DOI] [PMC free article] [PubMed] [Google Scholar]
- 65.White C, Kambe T, Fulcher YG, Sachdev SW, Bush AI, Fritsche K, Lee J, Quinn TP and Petris MJ, J. Cell Sci, 2009, 122, 1315–1321. [DOI] [PMC free article] [PubMed] [Google Scholar]
- 66.Acevedo KM, Hung Y-H, Dalziel AH, Li Q-X, Laughton K, Wikhe K, Rembach A, Roberts B, Masters CL, Bush AI and Camakaris J, J. Biol. Chem, 2011, 286, 8252–8262. [DOI] [PMC free article] [PubMed] [Google Scholar]
- 67.Masimirembwa CM, Bredberg U and Andersson TB, Clin Pharmacokinet, 2003, 42, 515–528. [DOI] [PubMed] [Google Scholar]
- 68.Kwon Y, Handbook of Essential Pharmacokinetics, Pharmacodynamics and Drug Metabolism for Industrial Scientists, Kluwer Academic/Plenum Publishers, New York, 2001. [Google Scholar]
- 69.Schlichting I, Berendzen J, Chu K, Stock AM, Maves SA, Benson DE, Sweet RM, Ringe D, Petsko GA and Sligar SG, Science, 2000, 287, 1615–1622. [DOI] [PubMed] [Google Scholar]
- 70.Guengerich FP, Chemical Research in Toxicology, 2001, 14, 611–650. [DOI] [PubMed] [Google Scholar]
- 71.McNaney CA, Drexler DM, Hnatyshyn SY, Zvyaga TA, Knipe JO, Belcastro JV and Sanders M, Assay Drug Dev Techn, 2008, 6, 121–129. [DOI] [PubMed] [Google Scholar]
- 72.Williamson B, Wilson C, Dagnell G and Riley RJ, Journal of pharmacological and toxicological methods, 2017, 84, 31–36. [DOI] [PubMed] [Google Scholar]
- 73.Obach RS, Drug Metab Dispos, 1999, 27, 1350–1359. [PubMed] [Google Scholar]
- 74.Irving H, Miles M and Pettit L, Anal Chim Acta, 1967, 38, 475–488. [Google Scholar]
- 75.Zékány L and Nagypál I, in Computational Methods for the Determination of Formation Constants, Springer, 1985, pp. 291–353. [Google Scholar]
- 76.Houston JB, Biochemical Pharmacology, 1994, 47, 1469–1479. [DOI] [PubMed] [Google Scholar]
- 77.Davies B and Morris T, Pharmaceut Res, 1993, 10, 1093–1095. [DOI] [PubMed] [Google Scholar]
- 78.Barter ZE, Bayliss MK, Beaune PH, Boobis AR, Carlile DJ, Edwards RJ, Houston J. Brian, Lake BG, Lipscomb JC and Pelkonen OR, Current drug metabolism, 2007, 8, 33–45. [DOI] [PubMed] [Google Scholar]
- 79.Iwatsubo T, Suzuki H and Sugiyama Y, Journal of Pharmacology and Experimental Therapeutics, 1997, 283, 462–469. [PubMed] [Google Scholar]
Associated Data
This section collects any data citations, data availability statements, or supplementary materials included in this article.