

Abstract
The objectives of this study were twofold: (1) to evaluate the longitudinal change in cartilage T1ρ and T2 6- and 12-months after ACL reconstruction (ACLR) in both reconstructed and intact contralateral knees with the aim of validating the role of the contralateral knee as an internal control in longitudinal studies; (2) to explore relationships between bone shape at the time of injury and the progression of T1ρ and T2 over 12-months after ACLR. T1ρ and T2 cartilage relaxation times and 3D MRI-based statistical shape modeling (SSM) of tibia and femur were computed for both knees of forty ACL-injured patients and 15 healthy controls. ACL subjects were scanned 8.4 ± 6.4 weeks after injury (2.4 ± 3.7 weeks prior to ACLR), 6- and 12-months after ACLR. Longitudinal changes in T1ρ and T2 values were assessed using linear mixed model, and partial correlation coefficients were calculated between bone shape and longitudinal changes in T1ρ and T2 values. Significant longitudinal increases in T1ρ and T2 values were observed in reconstructed and contralateral knees 6-months after ACLR. Tibial bone shape features, associated with the medial plateau height and width, were observed to be correlated with cartilage T1ρ and T2 progression in reconstructed knees. Our results suggest that caution should be used in considering contralateral knee as internal controls in longitudinal ACL studies and 3D MRI-based-SSM might serve as an imaging biomarker for the early stratification of patients at risk for developing post-traumatic accelerated cartilage degeneration and potentially osteoarthritis after ACL tear.
Keywords: ACL, post-traumatic osteoarthritis, T1ρ/T2, bone shape, statistical shape modeling
Anterior cruciate ligament (ACL) tears are one of the most common traumatic knee injuries and often involve concomitant damage to the meniscus, cartilage, or other ligaments.1–4 Additionally, patients typically have osseous injuries beneath the cartilage surface.5 While ACL reconstruction (ACLR) has been shown to improve patient symptoms, function, activity level, and stability,6,7 studies have demonstrated that tibiofemoral mechanics, such as anterior tibial translation and internal tibial rotation, are not completely restored following ACLR.8–10 The initial damage and abnormal post-surgical kinematics are factors that can contribute to the early onset of post-traumatic osteoarthritis (PTOA), a long-term outcome that will affect more than 50% of patients who undergo ACL injury and reconstruction.11,12 To date, the pathophysiology of PTOA remains unclear, but in the past few years there have been a number of studies aimed at defining imaging biomarkers that are able to identify patients at risk for developing accelerated degenerative disease.13,14
Recent technical advances in quantitative magnetic resonance imaging (MRI) have provided tools that are able to probe the biochemical composition of the articular cartilage.15 T1ρ and T2 relaxation time constants are two suitable and complementary parameters for the assessment of the cartilage matrix biochemical composition. Previous studies demonstrated that cartilage T2 relaxation times were primarily affected by hydration and collagen structure due to dipolar interactions.16 By using spin-lock techniques, cartilage T1ρ relaxation has reduced dipolar interactions and chemical exchange between OH and NH protons on proteoglycan and water protons was suggested to contribute to T1ρ in cartilage.17 T1ρ has been reported to be more sensitive to proteoglycan (PG) contents than T2,18 although T1ρ changes in cartilage may be affected by hydration and collagen structure as well. Elevations of both T1ρ and T2 have been observed in individuals with OA.19
Additionally, T1ρ and T2 imaging was shown to be able to detect cartilage degeneration 12- and 24-months after ACL injury and reconstruction when no radiographic signs of degeneration were present.20,21 However, it has not been reported if such cartilage matrix changes occur even earlier than 12-months after ACLR. T1ρ and T2 differences between injured and contralateral knees were also previously observed 12- and 16-months after the ACLR,22 while baseline side-to-side differences were shown to predict 12-month patient-reported outcomes.23 In those studies, contralateral knees were used as an internal control. However, no previous studies investigated the effect of ACL injury and reconstruction on longitudinal cartilage compositional changes in the contralateral uninjured knee.
Bone shape has been also proposed as a possible imaging biomarker for the prediction of hip and knee primary osteoarthritis (OA).24,25 Bredbenner et al.26 studied knee MRI data from the Osteoarthritis Initiative (OAI) database and showed that variability in knee subchondral bone surface geometry (obtained using 3D statistical shape modeling [SSM]) differentiated patients at risk and those not at risk for developing OA. Neogi et al.27 found that 3D bone shape predicted the onset of radiographic knee osteoarthritis (OA). Longitudinal bone shape changes as a potential biomarker for knee OA progression were also studied.28
Recently, a new method for the extraction of 3D-SSM was developed, amply evaluated and applied to study the contribution of bone shape to ACL injuries.29 However, to date, no studies have been conducted analyzing the potential role of 3D bone shape in progression of rapid cartilage degeneration following ACL injury and reconstruction.
Accordingly, the aim of our study was twofold: (1) to study the longitudinal change in T1ρ and T2 measurements 6- and 12-months after ACLR in both reconstructed and intact contralateral knees, with the aim to validate the role of the contralateral knee as an internal control in longitudinal studies and (2) to explore possible relationships between bone shape at the time of injury and the progression of T1ρ and T2 over 12-months after ACLR.
We hypothesize that significant longitudinal increase in T1ρ and T2 on both reconstructed and contralateral knees will be observed, and that specific bone shape features are significantly associated with those changes.
METHODS
This is an analytic case-control study (Level of Evidence: III). All subjects gave informed consent, and the study was carried out in accordance with the regulations of the Committee for Human Research at our institution.
Subjects
Forty patients with unilateral ACL tears were imaged within 1–33 weeks of injury (8.4 ± 6.4 weeks) prior to surgical reconstruction (10.8 ± 7.4 weeks after injury) (baseline) and 6- and 12-months after ACLR. Baseline MRI visit date did not affect the f/u scan date. Additionally, 15 controls with no history of knee injuries underwent MR imaging at the time of recruitment (baseline) and after 12-months. All patients underwent anatomic single-bundle ACLR by board-certified, fellowship-trained orthopedic surgeons with over 10 years experience. Only soft tissue grafts were used: hamstrings, either allograft or autograft, or posterior tibialis allograft. The femoral tunnels were drilled using anteromedial portal drilling. Notchplasty was not performed. All patients underwent a standard postoperative rehabilitation protocol and completed the Knee-Injury and Osteoarthritis Outcome Score (KOOS)30 at each follow-up visit.
MRI Imaging Protocol
All images were acquired using a 3T MRI scanner (GE Milwaukee, WI) with an eight-channel knee coil (Invivo, Inc., Gainesville, FL). Our cartilage-dedicated MRI protocol is described in Table 1.
Table 1.
Cartilage-Sensitive MRI Protocol
| MRI Sequence | Sequence Parameters |
|---|---|
| Sagittal 3D fast spin-echo (CUBE) | With fat suppression, repetition time (TR) 1,500 ms; echo time (TE), 25 ms; echo train length (ETL), 32; matrix, 384 × 384; field of view (FOV), 16 cm; slice thickness, 1 mm |
| Sagittal Combined T1r/T2-weighted (MAPSS)31 | With fat suppression, repetition time (TR)/echo time (TE) 9 ms/min; matrix, 256 × 128; field of view (FOV), 14 cm; slice thickness, 4 mm; view per segment, 64; spin-lock frequency, 500 Hz; T1r time spin-lock: [0,10,40,80] ms; T2 preparation TE: [0, 13.7, 27.3, 54.7] ms |
| Sagittal T2 fast spin-echo (FSE) | Without fat suppression, repetition time (TR)/echo time (TE) 4,000/49.3 ms; echo train length (ETL), 9; matrix, 512 × 512; field of view (FOV), 16 cm; slice thickness, 1.5 mm |
Semi-Quantitative Image Analysis
Semi-quantitative grading of cartilage lesions, bone marrow edema-like lesions (BMEL), and meniscus abnormalities were performed using the CUBE images by experienced musculoskeletal radiologists (MK and TML). The radiologists were blinded to subject information and T1ρ and T2 values. Cartilage, BMEL, and meniscal abnormalities were evaluated using the modified whole-organ magnetic resonance imaging score (WORMS),32 a widely used and extensively evaluated scoring system. One previous study reported intra- and inter-observer agreement equal to 0.87 (0.804–0.932) and 0.84 (0.771–0.911) for meniscus WORMS and 0.84 (0.771–0.911) and 0.79 (0.72–0.868) for cartilage WORMS.33
Image Processing
All the image post-processing was performed using an inhouse MATLAB-based program (Mathworks, Natick, MA).34
Bone Shape Quantification
3D SSM of tibia and femur was performed at baseline using a previously presented technique.35 Briefly, the tibia and femur of all the cases were segmented semi-automatically using an edge-based method and Bezier spline interpolation to obtain a dense 3D cloud of points that were then rigidly aligned on a single reference. All the vertices of the reference were mapped on all the surfaces in the dataset using a fully automatic landmark-matching algorithm based on the analysis of local curvatures and spectral coordinates. A 8,120 and 11,222 landmarks were identified for the tibia and the femur, respectively. Principal component analysis (PCA) was performed to calculate the most important modes of variation of all the surfaces from the mean surface. Twenty modes that describe >90% of the total variation in this dataset were considered for the description of femur and tibia.35 Each mode describes a specific shape model and each bone is defined by a linear combination of those models. The coefficients assigned to each mode define how a specific shape feature characterizes the analyzed surface. Thus, a vector describes each bone; and each component of the vector represents a shape feature.35
Repeated bone segmentation showed average surface distances equal to 0.79 and 0.78 mm for the femur and tibia, respectively. Average SSM RMS-CVs were equal to 7.23% and 7.27% for the first 10 modes and 2.65% and 4.89% in the first 5 modes of the femur and tibia, respectively. Scan/re-scan RMS-CVs for all five volunteers were equal to 12.25% and 14.7% for the first 10 modes and 7.33% and 12.25% for the first 5 modes of the femur and tibia, respectively.35
Cartilage T1ρ and T2 Quantification
CUBE images of the injured knee were rigidly registered and down-sampled in the sagittal direction to match the first T1ρ image TSL = 0 using an ITK library. Cartilage was segmented semi-automatically on the CUBE into six compartments (lateral femoral condyle [LF], lateral tibia [LT], medial femoral condyle [MF], medial tibia [MT], femoral trochlea [TrF], and patella [P]).36
Piecewise rigid registration was applied along the echoes to take into account movement of the articulation. Additionally, all T1ρ and T2 echoes of the contralateral and longitudinal scans were registered to the first T1ρ-weighted image of the baseline injured knee to assure that the same anatomical regions of cartilage were being compared in the analysis and to apply the ROIs identified on the baseline injured images on all contralateral and follow-up scans. An intensity-based multi-resolution pyramidal approach was applied to accomplish the registration task, basing our strategy on the elastix ITK library.37,38 The registration process was performed on the first echo and the transformation obtained was applied on the later echoes.39 The longitudinal registration strategy adopted in this study considerably decreased the amount of human intervention, reducing it to a simple quality check and local adjusting in the event of poor automatic performance.
The T1ρ and T2 maps were computed on a pixel-by-pixel basis using a two-parameter, Levenberg–Marquardt mono-exponential: (S(TSL) ∝ exp(−TSL/T1ρ)) and (S(TE) ∝ exp(−TE/T2)).40 The mean T1ρ and T2 values were calculated for each compartment. The scan-rescan RMS-CV for a previous study that used the same MRI protocol and post-processing pipeline was 3.1% and 4.0% for T1ρ and T2, respectively.41
During the course of this longitudinal study, the 3T HDx Long Bore MRI used during the first year of this study was replaced with a 3T MR750 Wide Bore. Potential variations in T1ρ and T2 values related to different MR systems were assessed by scanning phantoms and study subjects.41,23 A linear regression model was used to adjust T1ρ and T2 values between the two systems as previously described.23
Knee Alignment
Knee alignment at baseline was computed in a subset of the ACL patients considered in this study (N = 25) by drawing two lines in the A/P plane X-ray. The first line was drawn between the center of the femoral head and the center of the knee, while the second line was drawn from this point to the center of the ankle. The knee alignment was measured as the internal angle between these two lines.
Statistical Analysis
A generalized linear mixed model was used to study the association between time and values of T1ρ and T2 in reconstructed, contralateral and control knees. This took into account the correlation between the repeated measures over time. The association between the value of each of the bone shape modes and the 12-months T1ρ and T2 in the reconstructed side were studied using partial correlation. Demographic information such as age, gender, BMI, baseline morphological MRI findings (WORMS cartilage lesion in the corresponding cartilage compartment and meniscus lesion), meniscus surgical treatment (0: no treatment; 1: partial meniscectomy; 2: meniscus repair), time between injury and surgery, and time between injury and baseline MRI were considered as adjusting factors. To account multiple comparisons in forty modes, the significance level was set to 0.00125.
RESULTS
Table 2 shows the demographic information and KOOS of the 40 ACL subjects and 15 controls analyzed in this study. No significant differences in demographic characteristics were observed between ACL-injured and control groups. KOOS in all subcategories was significantly lower in ACL-injured patients than that of controls at baseline. Surgical characteristics, including graft type and meniscus treatment, and WORMS for cartilage and meniscus are reported in Tables 3 and 4, respectively.
Table 2.
All Subjects Baseline Demographic and Clinical Characteristics (N = 55)
| Characteristic | ||
|---|---|---|
| ACL Subjects (N = 40) | Controls (N = 15) | |
| Sexa | ||
| Male | 25 (62.5%) | 10 (66.7%) |
| Female | 15 (37.4%) | 5 (33.3%) |
| Age (years)b | 29.95 ± 8.11 | 31.5 ± 5.09 |
| BMI (kg/m2)b | 23.6 ± 2.52 | 23.7 ±1.87 |
| KOOS (0–100, 0 = worst outcome)b | ||
| Pain | 75.6 ± 15.90 | 99.44 ± 1.17 |
| Symptoms | 70.0 ± 18.56 | 98.52 ± 2.98 |
| Quality of life (SOL) | 42.9 ± 24.15 | 97.08 ± 7.03 |
| Sports/recreation | 56.65 ± 25.9 | 99.33 ± 2.58 |
| Function in daily leaving | 84.42 ± 15.40 | 100.00 ± 0 |
Data expressed as count (percentage %).
Data expressed as mean ± standard deviation.
Table 3.
ACL Patient Surgical Information (N = 40)
| Characteristic | ||
|---|---|---|
| Graft typea | ||
| Autograft | 29 (72.5%) | |
| Allograft | 11 (27.5%) | |
| Meniscus surgical observations and treatmenta | ||
| Observed | Medial (N = 4, 10%) |
Lateral (N = 11, 27.5%) |
| No treatment | 2 (50%) | 2 (18%) |
| Partial meniscectomy | 2 (50%) | 8 (72%) |
| Repair | 0 (0%) | 1 (1%) |
Data expressed as count (percentage %).
Table 4.
ACL Patient Baseline MR Clinical Characteristics (WORMS)a
| Characteristics | |||
|---|---|---|---|
| Cartilage lesions WORMS (N = 40) | |||
| MF cartilage lesion | LF cartilage lesion | ||
| Normal | 35 (87.5%) | Normal | 37 (92.5%) |
| Grade 1 | 1 (2.5%) | Grade 1 | 2 (5%) |
| Grade 2 | 2 (5%) | Grade 2 | 1 (2.5%) |
| Grade 3 | 2 (5%) | Grade 3 | 0 (2%) |
| MT cartilage lesion | LT cartilage lesion | ||
| Normal | 33 (82.5%) | Normal | 25 (62.5%) |
| Grade 1 | 4 (10%) | Grade 1 | 7 (17.5%) |
| Grade 2 | 3 (7.5%) | Grade 2 | 8 (20%) |
| Grade 3 | 0 (0%) | Grade 3 | 0 (0%) |
| Patellar cartilage lesion | Trochlear cartilage lesion | ||
| Normal | 30 (75%) | Normal | 33 (82.5%) |
| Grade 1 | 2 (5%) | Grade 1 | 2 (5%) |
| Grade 2 | 3 (7.5%) | Grade 2 | 3 (7.5%) |
| Grade 3 | 5 (12.5%) | Grade 3 | 2 (5%) |
| Meniscus WORMS (N = 40) | |||
| Medial meniscus | Lateral meniscus | ||
| Normal | 22 (55%) | Normal | 15 (37.5%) |
| Grade 1 | 3 (7.5%) | Grade 1 | 6 (15%) |
| Grade 2 | 9 (22.5%) | Grade 2 | 16 (40%) |
| Grade 3 | 2 (5%) | Grade 3 | 1 (2.5%) |
| Grade 4 | 3 (7.5%) | Grade 4 | 2 (5%) |
| Grade 5 | 1 (2.5%) | Grade 5 | 0 (0%) |
Data expressed as count (percentage %).
MF, medial femoral condyle; LF, lateral femoral condyle; MT, medial tibial plateau; LT, lateral tibial plateau.
T1ρ and T2 Longitudinal Analysis
The descriptive analysis of the T1ρ and T2 averages showed increases in both reconstructed and contralateral sides in the first 6-months after ACL reconstruction in all of the femoral compartments (MF, LF, and TrF) (Fig. 1). A more gradual increase was observed in MT from baseline to 12-months. Subtle increases in the LT and Patella compartments were also detected. The linear mixed model analysis for T1ρ and T2 reflected the descriptive analysis of the averages (Tables 5 and 6).
Figure 1.
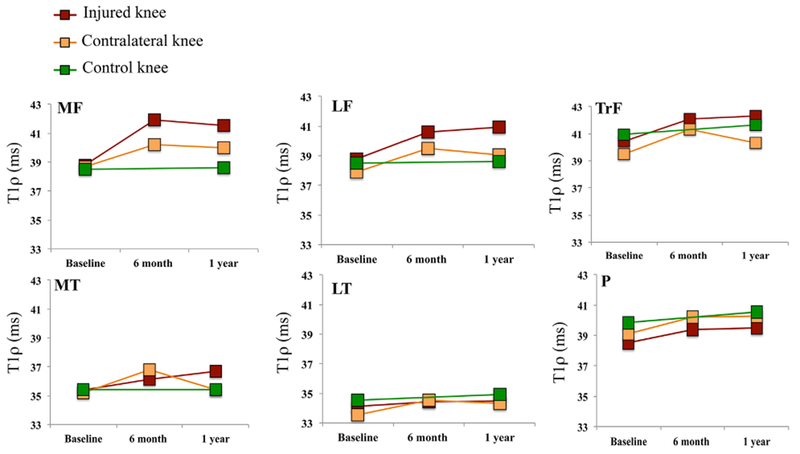
Analysis of the T1ρ averages changes over time in ACL-injured, contralateral, and control knees in the six global compartments: (medial femoral condyle [MF], lateral femoral condyle [LF], femoral trochlea [TrF], medial tibia [MT], lateral tibia [LT], and patella [P]), relaxation times are expressed in milliseconds (ms).
Table 5.
Results of the Linear Mixed Model for the Analysis of the Relationship Between Time and the Values of T1ρ in Injured Contralateral and Control Knees
| 95%CI |
||||||
|---|---|---|---|---|---|---|
| Dependent Variable | Group | Parameter | Estimate | Lower Bound | Upper Bound | p-Value |
| MF T1ρ | ||||||
| Injured | [BL – 6M] | −2.69 | −3.34 | −1.73 | <0.0001* | |
| [6M – 12M] | 0.18 | −0.46 | 1.14 | 0.511 | ||
| Contra | [BL – 6M] | −1.14 | −1.75 | −0.37 | 0.002* | |
| [6M – 12M] | 0.29 | −0.31 | 0.89 | 0.34 | ||
| Controls | [BL – 12M] | −0.2 | −1.13 | 0.74 | 0.658 | |
| LF T1ρ | ||||||
| Injured | [BL – 6M] | −2.05 | −2.91 | −1.12 | <0.0001* | |
| [6M – 12M] | −0.37 | −0.95 | 0.37 | 0.323 | ||
| Contra | [BL – 6M] | −1.12 | −1.57 | −0.35 | 0.001* | |
| [6M – 12M] | 0.48 | −0.13 | 1.20 | 0.131 | ||
| Controls | [BL – 12M] | −0.78 | −1.34 | −0.22 | 0.070 | |
| MT T1ρ | ||||||
| Injured | [BL – 6M] | −1.52 | −2.72 | −0.31 | 0.010* | |
| [6M – 12M] | −1.02 | −2.05 | 0.02 | 0.036* | ||
| Contra | [BL – 6M] | 0.00 | −1.13 | 1.13 | 0.967 | |
| [6M – 12M] | 1.90 | 0.95 | 2.86 | <0.0001# | ||
| Controls | [BL – 12M] | −1.19 | −2.54 | 0.17 | 0.081 | |
| LT T1ρ | ||||||
| Injured | [BL – 6M] | −0.37 | −1.09 | 0.35 | 0.231 | |
| [6M – 12M] | −0.10 | −1.00 | 0.810 | 0.696 | ||
| Contra | [BL – 6M] | −0.88 | −1.56 | −0.19 | 0.010* | |
| [6M – 12M] | 0.28 | −0.36 | 0.91 | 0.539 | ||
| Controls | [BL – 12M] | 0.34 | −0.88 | 1.55 | 0.562 | |
| TrF T1ρ | ||||||
| Injured | [BL – 6M] | −1.58 | −2.38 | −0.77 | <0.0001* | |
| [6M – 12M] | −0.05 | −0.86 | 0.77 | 0.757 | ||
| Contra | [BL – 6M] | −0.63 | −1.3 | 0.03 | 0.050 | |
| [6M – 12M] | 1.05 | 0.40 | 1.71 | 0.002# | ||
| Controls | [BL – 12M] | −0.15 | −1.30 | 0.99 | 0.775 | |
| P T1ρ | ||||||
| Injured | [BL – 6M] | −0.68 | −1.71 | 0.34 | 0.151 | |
| [6M – 12M] | 0.02 | −0.92 | 0.95 | 0.891 | ||
| Contra | [BL – 6M] | −1.18 | −2.16 | −0.20 | 0.016* | |
| [6M – 12M] | −0.06 | −0.94 | 0.81 | 0.743 | ||
| Controls | [BL – 12M] | −0.17 | −1.13 | 0.79 | 0.712 | |
Bold indicates significant differences;
significant increase over time,
significant decrease over time.
Table 6.
Results of the Linear Mixed Model for the Analysis of the Relationship Between Time and the Values of T2 in Injured Contralateral and Control Knees
| 95%CI |
||||||
|---|---|---|---|---|---|---|
| Dependent Variable | Group | Parameter | Estimate | Lower Bound | Upper Bound | p-Value |
| MF T2 | ||||||
| Injured | [BL – 6M] | −2.31 | −3.04 | −1.39 | <0.0001* | |
| [6M – 12M] | 0.18 | −0.94 | 0.62 | 0.67 | ||
| Contra | [BL – 6M] | −0.93 | −1.46 | −0.32 | 0.003* | |
| [6M – 12M] | 0.64 | −0.11 | 0.21 | 0.021# | ||
| Controls | [BL – 12M] | −0.37 | −1.16 | 0.41 | 0.326 | |
| LF T2 | ||||||
| Injured | [BL – 6M] | −1.68 | −2.43 | −0.78 | <0.0001* | |
| [6M – 12M] | −0.48 | −1.08 | 0.17 | 0.142 | ||
| Contra | [BL – 6M] | −0.66 | −1.18 | −0.1 | 0.065 | |
| [6M – 12M] | 0.12 | −0.32 | 0.83 | 0.524 | ||
| Controls | [BL – 12M] | 0.12 | −0.58 | 0.82 | 0.717 | |
| MT T2 | ||||||
| Injured | [BL – 6M] | −1.35 | −2.32 | −0.39 | 0.005* | |
| [6M – 12M] | −0.68 | −1.49 | 0.12 | 0.072 | ||
| Contra | [BL – 6M] | −0.63 | −1.44 | 0.19 | 0.126 | |
| [6M – 12M] | 0.95 | 0.22 | 1.68 | 0.019# | ||
| Controls | [BL – 12M] | −1.13 | −2.02 | −0.24 | 0.015* | |
| LT T2 | ||||||
| Injured | [BL – 6M] | 0.07 | −0.67 | 0.81 | 0.984 | |
| [6M – 12M] | 0.02 | −0.68 | 0.720 | 0.871 | ||
| Contra | [BL – 6M] | −0.87 | −1.62 | −0.12 | 0.019* | |
| [6M – 12M] | −0.05 | −0.65 | 0.55 | 0.665 | ||
| Controls | [BL – 12M] | −0.71 | −1.33 | −0.09 | 0.028* | |
| TrF T2 | ||||||
| Injured | [BL – 6M] | −1.93 | −2.93 | −0.94 | <0.0001* | |
| [6M – 12M] | −0.69 | −1.55 | 0.16 | 0.073 | ||
| Contra | [BL – 6M] | −1.61 | −2.21 | −1.00 | <0.0001* | |
| [6M – 12M] | 0.54 | 0.00 | 1.08 | 0.089 | ||
| Controls | [BL – 12M] | −0.71 | −1.33 | −0.09 | 0.028* | |
| P T2 | ||||||
| Injured | [BL – 6M] | −0.95 | −1.83 | −0.07 | 0.025* | |
| [6M – 12M] | −0.23 | −1.07 | 0.6 | 0.452 | ||
| Contra | [BL – 6M] | −1.17 | −1.76 | −0.59 | <0.0001* | |
| [6M – 12M] | −0.08 | −0.59 | 0.42 | 0.519 | ||
| Controls | [BL – 12M] | 0.06 | −0.67 | 0.8 | 0.854 | |
Bold indicates significant differences;
significant increase over time,
significant decrease over time.
In the reconstructed knees, T1ρ and T2 in LF, MF, and TrF significantly increased from baseline to 6-month follow-up only, while MT T1ρ increased significantly from baseline to 6-month and from 6- to 12-month follow-ups. MT T2 increased significantly from baseline to 6-month and showed a trend toward a significant increase from 6- to 12-month (p = 0.07). T2 in the patella significantly increased from baseline to 6-month only.
In the contralateral knees, T1ρ in LF, MF, LT, and patella also increased significantly from baseline to 6-month, while T1ρ in MT and TrF decreased significantly from 6- to 12-month. T2 in MF and patella also increased significantly from baseline to 6-month, while MF T2 increased from 6- to 12-month. Following the same trend as T1ρ, T2 in the MT decreased significantly from 6- to 12-month. Control knees showed no significant changes over time in general, except for the TrF that showed a significant increase in T2 from baseline to 12-months.
Relationship Between Knee Bone Shape and T1ρ and T2 Progression
Several bone shape features showed a moderate association with changes in T1ρ and T2 12-months after ACL reconstruction (|R| > 0.4, p-value < 0.05), where R is the Pearson partial correlation coefficient between ΔT1ρ or ΔT2 and each shape feature and p-value is the associated statistical significance level; all the results will be presented using this convention.
The effect of those modes was modeled (changing the values from mean to mean ± standard deviation) by generating 3D surfaces that differed from the average surface by the specific shape feature of the modeled mode. The 3D modeling was visualized using colored meshes. The color of each mesh’s face is related to the local Euclidean distance (mm) between the position of the closest landmark in the average surface and in the modeled surface. Additionally, the Euclidean distance was decomposed in three components along medial to lateral, distal to proximal and anterior to posterior components to better interpret the physical meaning of the modes.
Two tibia modes, Tibia 6 and Tibia 2, were significant after correction for multiple comparison, p-value < 0.00125. Considering the T1ρ and T2 progression between baseline and 6-month, none of the baseline shape feature shown a correlation strong enough to pass the significant test after correction for multiple comparison.
Figure 2 shows the 3D modeling of Tibia 6 and Tibia 2 and scatter plots of the association between these bone shape features and patella ΔT2 (R = −0.57, p-value = 0.0001) and LT ΔT1ρ (R = 0.53, p-value = 0.0005).
Figure 2.
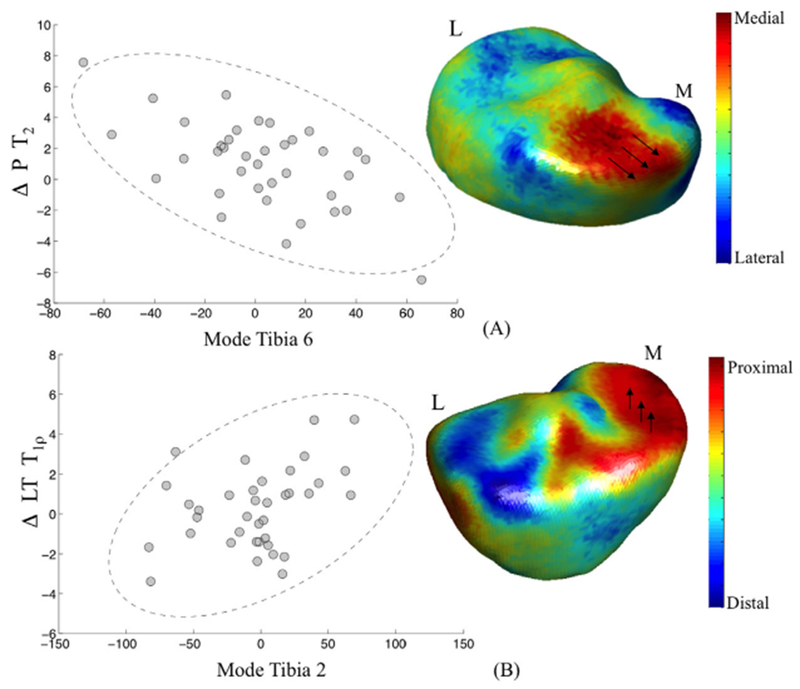
Modeling of the 3D shape features significantly associated with the change in T2 in patella and T1ρ in lateral tibia (LT) (A) Tibia 6: low values are related with a wider medial plateau, associated with higher progression in patella (P) T2. (B) Tibia 2: high values are related with a more proximal medial tibia plateau, associated with higher progression in Lateral Tibia (LT) T1ρ.
The colors in the mesh shown in Figure 2A depict the lateral to medial component of the distances between the average tibia in this population and the modeled mean—3SD Tibia 6. The mesh is red where lower values of Tibia 6 represent vertexes more medially located compared with the average surface. The mesh is blue where lower values of Tibia 6 represent vertexes more laterally located compared with the average surface.
The value of the modes is related to a complex 3D shape characteristic not definable by a simple geometrical interpretation; however, in this representation, is notable an ample involvement of the medial plateau displaced in medial direction; thus, lower values in Tibia 6 are associated with a wider medial tibia plateau. However, this is not the only area of change. Vertex displacement in the lateral direction is also observed in the most posterior aspect of the medial tibia.
Subjects that showed these baseline characteristics are observed with a higher increase in patella T2 12-months after ACLR. No significant associations of this mode with progression in T1ρ were observed. Although not significant after adjusting for multiple comparison, a trend was observed in the association of this mode and the baseline to 6-month progression patella T2 (R = − 0.33, p-value = 0.04).
The colors in the mesh shown in Figure 2B depict the distal to proximal component of the distances between the vertexes of the average tibia in this population and the modeled mean + 3SD Tibia 2. The mesh is red where higher values of Tibia 2 represent vertexes more proximally located compared with the average surface. The mesh is blue where higher values of Tibia 2 represent vertexes more distally located compared with the average surface.
Higher values in Tibia 2 are associated with a higher medial tibial plateau (proximal displacement) and lower lateral plateau (distal displacement). Subjects that show this baseline characteristics are observed with a higher T1ρ in the lateral tibia 12-months after ACL reconstruction. No significant associations of this mode with progression in T2 are observed. Although not significant, a trend was observed in the association of this mode and the baseline to 6-months progression lateral tibia T1ρ (R = 0.34, p-value = 0.03).
A symmetrical bone shape feature in the femur (Femur 18), which is characterized by a more distally located medial femoral condyle, showed a trend toward a significant association with change in lateral tibia T1ρ (R = 0.42, p-value = 0.007) (Fig. 3A). Additionally, this bone shape feature showed a significant negative correlation with the knee alignment at baseline (R = −0.41, p-value = 0.04). Subjects with higher values in Femur 18 also showed higher progression of T2 in the lateral tibia and a more varus knee alignment at baseline. These results suggest that the bone shape features characterizing tibial plateau (Tibia 2) and femur condyle (Femur 18) symmetry may be associated with cartilage degeneration after ACL injury, and such associations may be due to alignment alterations and consequent loading changes.
Figure 3.
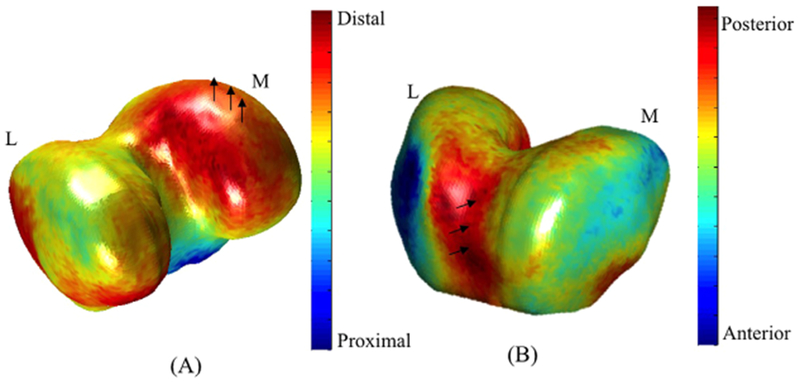
Modeling of the 3D femur bone shape features associated with the change in T1ρ lateral tibia (A) and in T1ρ and T2 medial femoral condyle (B).
While not significant, it should be noted that subjects with a deeper trochlear groove (Femur 17, Fig. 3B) were observed to have a higher increase in both T1ρ and T2 in the medial femoral condyle (R = 0.43, p-value = 0.006).
DISCUSSION
In this study, the longitudinal progression of knee cartilage T1ρ and T2 after ACL injury and reconstruction and the associations of those changes with baseline bone shape were analyzed. Significant T1ρ and T2 increases are observed in the first 6-months after surgery in both the reconstructed and contralateral uninjured sides, with the contralateral knees showing a lower magnitude of increase compared to the reconstructed knees. Significant associations between baseline medial tibial plateau height and width and change in T1ρ and T2 from baseline to 12-months after ACL reconstruction were observed.
Li et al.15 and Theologis et al.22 previously analyzed cartilage composition after ACL injury and reconstruction using T1ρ and T2 showing T1ρ prolongation in the medial side compared with controls and contralateral knees 12 months after ACLR.
Consistent with the findings of these two pilot studies, we observed T1ρ elevations in the MF and MT. However, we also observed T1ρ elevations in LF and TrF compartments that did not show significant differences in the cross-sectional analysis conducted by these two previous studies. Moreover, our 6-month time point allowed us to observe a significant elevation present in the femoral compartments in the first 6-months following ACL reconstruction and a smaller change from 6- to 12-month. Contrary to what was observed by Li et al., our study showed that T2 follow similar elevation pattern as T1ρ, with changes that were significant in the MF, LF, and TrF over the first 6-months. The bigger sample size and the improved post-processing pipeline, including inter-echo and longitudinal registration, could be the cause of better sensitivity of the technique in detecting additional differences in T2 which has a lower dynamic range and is more affected by technical issues, such as magic angle effect, as compared to T1ρ.
To the best of our knowledge, this study is the first to analyze the longitudinal changes in biochemical composition of the contralateral knee. Our results suggest that the contralateral knee is also subject to early cartilage degeneration that could be explained by altered biomechanics and neuromuscular function, which are known to affect both the reconstructed and the contralateral limbs after an ACL reconstruction.42 It could also be speculated that a change in gait intended to stabilize the reconstructed knee joint could affect the loading pattern in the contralateral knee triggering the cartilage matrix changes also in the uninjured side. Interestingly, although significant elevations of T1ρ and T2 of the contralateral knees were observed during the first 6-months, significant decrease of T1ρ in MT and TrF and T2 in MT were observed from 6- to 12-month. These results suggest that the matrix changes of the cartilage of the contralateral knees may be transient and may recover toward normal levels when the subjects return to normal activity. Longer follow-up is warranted to investigate the cartilage health of the contralateral knees.
The second main result of this study is the association between baseline bone shape features and the progression of T1ρ and T2 6- and 12-months after ACL reconstruction. Bone shape features were observed to be associated with the change in cartilage composition. A wider medial tibia plateau (presented by Tibia Mode 6) was observed to be associated with higher progression in patella T2. Previous studies suggested that with increasing severity of radiographic knee osteoarthritis, tibial plateau size increases.43 Medial tibial plateau area was observed as a stronger factor in distinguishing OA subjects from controls than lateral tibial plateau area. However, the role of tibia plateau size in pathogenesis of osteoarthritis or as a risk factor is not completely understood.44 Our results suggest that subjects with a wider medial tibia plateau may have accelerated cartilage degeneration after ACL injury.
Moreover, a taller medial tibia plateau (presented by Tibia Mode 2) was observed in subjects that had higher differences between baseline and 12-months T1ρ in the lateral tibia. This specific geometry could affect the load distribution across the articular surface and the proportion of load between medial and lateral compartments.
While our results showed a major involvement of the medial tibia shape in the cartilage degeneration after ACL reconstruction, several recent studies reported the shape of the lateral tibia as a risk factor for ACL injury and graft failure after ACL injury.44,45 This may suggest a major involvement of the lateral side in injury process, but not in the post-traumatic cartilage degeneration.
Among the bone shape features that showed moderate association with ΔT1ρ and ΔT2 but did not pass the multiple comparison threshold, trochlear groove depth is particularly interesting. This specific geometrical feature has been extensively discussed in literature, but reporting its association with OA has remained controversial. Teichtahl et al.46 showed that as the distal femoral trochlear groove becomes more flattened, there is an associated increase in patella cartilage volume without an increased prevalence of patella cartilage defects among healthy adults with no history of knee pain or clinical disease. This suggests that a flattened distal trochlear groove may protect against degenerative conditions, such as OA. Davies-Tuck et al.47 substantiated those results, showing that a shallower sulcus in the context of established osteoarthritis may be an advantageous anatomical variant. Both of these results would support our finding that a deeper trochlear groove is associated with worsened cartilage composition 12-months after ACL reconstruction. On the other hand, several studies reported that a dysplastic trochlea (shallower trochlea) would lead to abnormal patellar tracking, chronic patellar dislocation, and an abnormal distribution of loading, which could be associated with a higher risk for OA.48,49 These controversial results could be partially explained by the technical difficulties in establishing a reliable geometrical measure of the trochlea sulcus in 2D. A 3D unbiased model such as the one we used in our experiments could potentially overcome these issues.
Despite the promising results, this study had several limitations. The sample size was relatively small, and the follow-up was limited to 12-months after ACL reconstruction. While we observed a longitudinal increase of T1ρ and T2 suggesting degeneration, it is worth mention that injury and ACLR could also affect the relaxation times and the observed elevation could be transitory and not directly disease related. However the persistent elevation observed at 12 months, in particular in MT, suggests actual cartilage degeneration. Longer follow-up are needed for a better understanding of the phenomena.
Despite a careful scanner cross-calibration was performed in this longitudinal study, the usage of two scanners needs to be acknowledged as a limitation. In this study, time to ACLR ranged from 1 to 35 weeks after injury. Although this was considered as adjusting factor in our statistics, a more controlled design could benefit the analysis. More focused investigation need to be done to better understand the effect of these variables on cartilage degeneration. Furthermore, only bone shapes of femur and tibia were considered. The analysis of the patella shape could be also of interest. As with all PCA-based methods, SSM is data-driven, and results obtained on different datasets could be potentially difficult to compare with the results obtained in this study.
This study considered just ROI-based analysis for T1ρ and T2, relaxation time assessment; a novel fully automatic and unbiased voxel-based relaxometry technique was recently proposed to solve this task and in the future it could be adopted to improve sensitivity.39,50
In conclusion, this study demonstrated that significant increase in the T1ρ and T2 values were observed as soon as 6-months after ACL reconstruction in both reconstructed and contralateral knees. Contralateral knees, however, showed lower amplitude of increase compared to reconstructed knees. Thus, caution should be used in considering contralateral knee as internal controls in longitudinal ACL studies.
Bone shape features at the time of injury were observed to be significantly associated with the progression of T1ρ and T2 12-months after ACL reconstruction, suggesting certain bone geometry may predispose subjects to post-traumatic joint degeneration. Our results suggest that bone shape features, computed with 3D MRI-based SSM, could be used as a potential imaging biomarker for an early stratification of subjects with a major risk of biochemical changes in the cartilage matrix following ACL injury and reconstruction.
ACKNOWLEDGMENTS
The authors would like to thank Drew A. Lansdown, MD, Musa Zaid, MD, and Lauren Tufts for their help.
Grant sponsor: NIH/NIAMS; Grant number: P50 AR060752.
REFERENCES
- 1.Dargel J, Gotter M, Mader K, et al. 2007. Biomechanics of the anterior cruciate ligament and implications for surgical reconstruction. Strategies Trauma Limb Reconstr 2:1–12. [DOI] [PMC free article] [PubMed] [Google Scholar]
- 2.Gordon MD, Steiner ME. 2004. Anterior cruciate ligament injuries In: Garrick JG, editor. Orthopaedic knowledge update sports medicine III. Rosemont: American Academy of Orthopaedic Surgeons; p 169. [Google Scholar]
- 3.Prodromos CC, Han Y, Rogowski J, et al. 2007. A meta-analysis of the incidence of anterior cruciate ligament tears as a function of gender, sport, and a knee injury-reduction regimen. Arthroscopy 23:1320.e6–1325.e6. [DOI] [PubMed] [Google Scholar]
- 4.Fleming BC, Hulstyn MJ, Oksendahl HL, et al. 2005. Ligament injury, reconstruction and osteoarthritis. Curr Opin Orthop 16:354–362. [DOI] [PMC free article] [PubMed] [Google Scholar]
- 5.Patel SA, Hageman J, Quatman CE, et al. 2014. Prevalence and location of bone bruises associated with anterior cruciate ligament injury and implications for mechanism of injury: a systematic review. Sports Med 44:281–293. [DOI] [PMC free article] [PubMed] [Google Scholar]
- 6.Papannagari R, Gill TJ, Defrate LE, et al. 2006. In vivo kinematics of the knee after anterior cruciate ligament reconstruction: a clinical and functional evaluation. Am J Sports Med 34:2006–2012. [DOI] [PubMed] [Google Scholar]
- 7.Leys T, Salmon L, Waller A, et al. 2012. Clinical results and risk factors for reinjury 15 years after anterior cruciate ligament reconstruction: a prospective study of hamstring and patellar tendon grafts. Am J Sports Med 40:595–605. [DOI] [PubMed] [Google Scholar]
- 8.Zaid M, Lansdown D, Su F, et al. 2015. Abnormal tibial position is correlated to early degenerative changes one year following ACL reconstruction. J Orthop Res 33:1079–1086. [DOI] [PMC free article] [PubMed] [Google Scholar]
- 9.Tashman S, Daisuke A. 2013. Effects of ACL reconstruction on in-vivo, dynamic knee function. Clin Sports Med 32:47–59. PMC. [DOI] [PMC free article] [PubMed] [Google Scholar]
- 10.Amano K, Pedoia V, Su F, et al. 2016. Persistent biomechanical alterations after ACL reconstruction are associated with early cartilage matrix changes detected by quantitative MR. Orthop J Sports Med 4:2325967116644421. [DOI] [PMC free article] [PubMed] [Google Scholar]
- 11.Christiansen BA, Anderson MJ, Lee CA, et al. 2012. Musculoskeletal changes following non-invasive knee injury using a novel mouse model of post-traumatic osteoarthritis. Osteoarthritis Cartilage 20:773–782. [DOI] [PubMed] [Google Scholar]
- 12.Stiebel M, Miller LE, Block JE. 2014. Post-traumatic knee osteoarthritis in the young patient: therapeutic dilemmas and emerging technologies. Open Access J Sports Med 5: 73–79. [DOI] [PMC free article] [PubMed] [Google Scholar]
- 13.Kijowski R, Roemer F, Englund M, et al. 2014. Imaging following acute knee trauma. Osteoarthritis Cartilage 22: 1429–1443. [DOI] [PubMed] [Google Scholar]
- 14.Hunter D, Eckstein F, Kraus VB, et al. 2013. Imaging biomarker validation and qualification report: 6th OARSI workshop on imaging in osteoarthritis combined with 3rd OA biomarkers workshop. Osteoarthritis Cartilage 21:939–942. [DOI] [PMC free article] [PubMed] [Google Scholar]
- 15.Li X, Majumdar S. 2013. Quantitative MRI of articular cartilage and its clinical applications. J Magn Reson Imaging 38:991–1008. [DOI] [PMC free article] [PubMed] [Google Scholar]
- 16.Nieminen MT, Rieppo J, Toyras J, et al. 2001. T2 relaxation reveals spatial collagen architecture in articular cartilage: a comparative quantitative MRI and polarized light microscopic study. Magn Reson Med 46:487–493. [DOI] [PubMed] [Google Scholar]
- 17.Akella SV, Regatte RR, Wheaton AJ, et al. 2004. Reduction of residual dipolar interaction in cartilage by spin-lock technique. Magn Reson Med 52:1103–1109. [DOI] [PubMed] [Google Scholar]
- 18.Li X, Cheng J, Lin K, et al. 2011. Quantitative MRI using T1rho and T2 in human osteoarthritic cartilage specimens: correlation with biochemical measurements and histology. Magn Reson Imaging 29:324–334. [DOI] [PMC free article] [PubMed] [Google Scholar]
- 19.Li X, Pai A, Blumenkrantz G, et al. 2009. Spatial distribution and relationship of T1rho and T2 relaxation times in knee cartilage with osteoarthritis. Magn Reson Med 61:1310–1318. [DOI] [PMC free article] [PubMed] [Google Scholar]
- 20.Li X, Kou D, Theologis A, et al. 2011. Cartilage in anterior cruciate ligament—reconstructed knees: MR imaging T1ρ and T2—initial experience with 1-year follow-up. Radiology 258:505–514. [DOI] [PMC free article] [PubMed] [Google Scholar]
- 21.Su F, Hilton JF, Nardo L, et al. 2013. Cartilage morphology and T1ρ and T2 quantification in ACL-reconstructed knees: a 2-year follow-up. Osteoarthritis Cartilage 21:1058–1067. [DOI] [PMC free article] [PubMed] [Google Scholar]
- 22.Theologis AA, Haughom B, Liang F, et al. 2014. Comparison of T1rho relaxation times between ACL-reconstructed knees and contralateral uninjured knees. Knee Surg Sports Traumatol Arthrosc 22:298–307. [DOI] [PMC free article] [PubMed] [Google Scholar]
- 23.Su F, Pedoia V, Teng HL, et al. 2016. The association between MR T1ρ and T2 of cartilage and patient-reported outcomes after ACL injury and reconstruction. Osteoarthritis Cartilage 24:1180–1189. [DOI] [PMC free article] [PubMed] [Google Scholar]
- 24.Lynch JA, Parimi N, Chaganti RK, et al. 2009. The association of proximal femoral shape and incident radiographic hip OA in elderly women. Osteoarthritis Cartilage 17:1313–1318. [DOI] [PMC free article] [PubMed] [Google Scholar]
- 25.Haverkamp DJ, Schiphof D, Bierma-Zeinstra SM, et al. 2011. Variation in joint shape of osteoarthritic knees. Arthritis Rheum 63:3401–3407. [DOI] [PubMed] [Google Scholar]
- 26.Bredbenner TL, Eliason TD, Potter RS, et al. 2010. Statistical shape modeling describes variation in tibia and femur surface geometry between Control and Incidence groups from the osteoarthritis initiative database. J Biomech 43:1780–1786. [DOI] [PMC free article] [PubMed] [Google Scholar]
- 27.Neogi T, Bowes MA, Niu J, et al. 2013. Magnetic resonance imaging-based three-dimensional bone shape of the knee predicts onset of knee osteoarthritis. Arthritis Rheum 68:2048–2058. [DOI] [PMC free article] [PubMed] [Google Scholar]
- 28.Hunter D, Nevitt M, Lynch J, et al. 2016. Longitudinal validation of periarticular bone area and 3D shape as biomarkers for knee OA progression? Data from the FNIH OA Biomarkers Consortium. Ann Rheum Dis 75:1607–1614. [DOI] [PubMed] [Google Scholar]
- 29.Pedoia V, Lansdown DA, Zaid M, et al. 2015. Three-dimensional MRI-based statistical shape model and application to a cohort of knees with acute ACL injury. Osteoarthritis Cartilage 23:1695–1703. [DOI] [PMC free article] [PubMed] [Google Scholar]
- 30.Roos EM, Roos HP, Lohmander LS, et al. 1998. Knee Injury and Osteoarthritis Outcome Score (KOOS)—development of a self-administered outcome measure. J Orthop Sports Phys Ther 28:88–96. [DOI] [PubMed] [Google Scholar]
- 31.Li X, Wyatt C, Rivoire J, et al. 2014. Simultaneous acquisition of T1ρ and T2 quantification in knee cartilage: repeatability and diurnal variation. J Magn Reson Imaging 39:1287–1293. [DOI] [PMC free article] [PubMed] [Google Scholar]
- 32.Peterfy CG, Guermazi A, Zaim S, et al. 2004. Whole-Organ Magnetic Resonance Imaging Score (WORMS) of the knee in osteoarthritis. Osteoarthritis Cartilage 2004:177–190. [DOI] [PubMed] [Google Scholar]
- 33.Bucknor MD, Nardo L, Joseph GB, et al. 2015. Association of cartilage degeneration with four year weight gain- 3T MRI data from the Osteoarthritis Initiative. Osteoarthritis Cartilage 23:525–531. [DOI] [PMC free article] [PubMed] [Google Scholar]
- 34.Carballido-Gamio J, Bauer J, Stahl R, et al. 2008. Inter-subject comparison of MRI knee cartilage thickness. Med Image Anal 12:120–113. [DOI] [PMC free article] [PubMed] [Google Scholar]
- 35.Cootes FT, Taylor CY, Cooper DH, et al. 1995. Active shape models-their training and application. Comput Vis Image Underst 61:38–59. [Google Scholar]
- 36.Li X, Ma C, Link T, et al. 2007. In vivo T1ρ and T2 mapping of articular cartilage in osteoarthritis of the knee using 3 Tesla MRI. Osteoarthritis Cartilage 15:789–797. [DOI] [PMC free article] [PubMed] [Google Scholar]
- 37.Klein S, Staring M, Murphy K, et al. 2010. Elastix: a toolbox for intensity based medical image registration. IEEE Trans Med Imaging 29:196–205. [DOI] [PubMed] [Google Scholar]
- 38.Shamonin DP, Bron EE, Lelieveldt BPF, et al. 2014. Fast parallel image registration on CPU and GPU for diagnostic classification of Alzheimer’s disease. Front Neuroinform 7:1–15. [DOI] [PMC free article] [PubMed] [Google Scholar]
- 39.Pedoia V, Li X, Su F, et al. 2016. Fully automatic analysis of the knee articular cartilage T1ρ relaxation time using voxel-based relaxometry. J Magn Reson Imaging 43:970–980. [DOI] [PMC free article] [PubMed] [Google Scholar]
- 40.Marquardt D 1963. An algorithm for least-squares estimation of nonlinear parameters. J Soc Ind Appl Math 11:431–441. [Google Scholar]
- 41.Li X, Pedoia V, Kumar D. Cartilage T1ρ and T2 relaxation times: longitudinal reproducibility and variations using different coils, MR systems and sites. Osteoarthritis Cartilage 23:2214–2223. [DOI] [PMC free article] [PubMed] [Google Scholar]
- 42.Swärd P, Kostogiannis I, Roos H. 2010. Risk factors for a contralateral anterior cruciate ligament injury. Knee Surg Sports Traumatol Arthros 18:277–291. [DOI] [PubMed] [Google Scholar]
- 43.Ding C, Cicuttini F, Jones G. 2007. Tibial subchondral bone size and knee cartilage defects: relevance to knee osteoarthritis. Osteoarthritis Cartilage 15:479–486. [DOI] [PubMed] [Google Scholar]
- 44.Dare DM, Fabricant PD, McCarthy MM, et al. 2015. Increased lateral tibial slope is a risk factor for pediatric anterior cruciate ligament injury: an MRI-based case-control study of 152 patients. Am J Sports Med 43:1632–1639. [DOI] [PubMed] [Google Scholar]
- 45.Song GY, Zhang H, Wang QQ, et al. 2015. Risk factors associated with grade 3 pivot shift after acute anterior cruciate ligament injuries. Am J Sports. pii: 0363546515613069. [Epub ahead of print]. [DOI] [PubMed] [Google Scholar]
- 46.Teichtahl AJ, Parkins K, Hanna F, et al. 2007. The relationship between the angle of the trochlear groove and patella cartilage and bone morphology—a cross-sectional study of healthy adults. Osteoarthritis Cartilage 15:1158–1162. [DOI] [PubMed] [Google Scholar]
- 47.Davies-Tuck M, Teichtahl AJ, Wluka AE, et al. 2008. Femoral sulcus angle and increased patella facet cartilage volume in an osteoarthritic population. Osteoarthritis Cartilage 16:131–135. Epub 2007 Sep. [DOI] [PubMed] [Google Scholar]
- 48.Fitoussi F, Akoure S, Chouteau Y, et al. 1994. Femoral trochlea and femoropatellar osteoarthritis. Rev Chir Orthop Reparatrice Appar Mot 80:520–524. [PubMed] [Google Scholar]
- 49.Dejour H, Walch G, Neyret P, et al. 1990. Dysplasia of the femoral trochlea. Rev Chir Orthop Reparatrice Appar Mot 76:45–54. [PubMed] [Google Scholar]
- 50.Russell C, Pedoia V, Amano K, et al. 2016. Baseline cartilage quality is associated with voxel-based T1ρ and T2 following ACL reconstruction: a multicenter pilot study. J Orthop Res. doi: 10.1002/jor.23277. [Epub ahead of print]. [DOI] [PMC free article] [PubMed] [Google Scholar]