

Abstract
This study explores the potential of lead resistant bacterium Acinetobacter junii Pb1 for adsorption/accumulation of lead using various techniques. In the present work, growth of A. junii Pb1 was investigated in the presence of a range of Pb(II) concentrations (0, 100, 250, 500, and 1000 mg l−1). Lead was found to have no toxic effect on the growth of A. junii Pb1 at 100 and 250 mg l−1 concentrations. However, further increase in Pb(II) concentration (500 mg l−1) showed increase in lag phase, though growth remained unaffected and significant growth inhibition was observed when concentration was increased to 1000 mg l−1. Same was confirmed by the observations of flow cytometry. Further, the effect of Pb(II) on A. junii Pb1 was evaluated by using fluorescence microscopy, spectrofluorimetry, and flow cytometry. The spectrofluorimetry and fluorescence microscopy results revealed the accumulation of Pb(II) inside the bacterial cells as evident by green fluorescence due to lead binding fluorescent probe, Leadmium Green AM dye. Flow cytometry observations indicate an increase in cell size and granularity of exposure to lead. Thus, present work provides a new understanding of Pb(II) tolerance in A. junii Pb1 and its potential use in remediation of lead from contaminated soil.
Keywords: Lead, Acinetobacter junii, Cytotoxicity, Propidium iodide, Leadmium Green AM dye
Introduction
Heavy metals are defined as elements with densities between 3.5 to 7 g cm−3. Heavy metals/metalloids include lead (Pb), cadmium (Cd), mercury (Hg), arsenic (As), chromium (Cr), nickel (Ni), and uranium (U) [1–3]. Heavy metals are important both industrially and biologically, due to their non-biodegradable nature, they are steady in the environment and pose a serious threat to it and their excessive deposition in the soil can cause serious damage to soil ecosystem [4]. Of these, lead is one of the major pollutants and needs an immediate concern. Common anthropogenic sources of lead contamination in the environment include smelting of ores, burning of coal, mining, effluents from battery industries, automobile exhausts, metal plating, leather tanning, finishing operations, fertilizers, and pesticides [5, 6]. Due to urbanization and contamination of agricultural soil by Pb(II), it has severely affected the health of higher animals as lead containing compounds enter the food chain. Its increasing level has severely affected the soil microbial diversity and on growth and metabolism of plants. In plants, Pb(II) leads to oxidative stress which results in cellular damage and disturbance of cellular ionic homeostasis. It impairs plant growth, root elongation, seed germination, seedling development, cell division, transpiration, chlorophyll production, and lamellar organization in the chloroplast [7, 8]. Besides that, it can be accumulated in different parts of plants and thereby enter in food chain. Lead can affect any organ in the body but most sensitive parts are developing nervous system, hematological and cardiovascular system, reproductive system, and kidney.
Irrespective of the fact that many regulatory steps are being in practice to limit the discharge of lead compounds into ecosystem still Pb(II) contamination is increasing [9]. Various physicochemical methods have been employed for the remediation of Pb(II) contaminated soil. These include excavation, landfill, thermal treatment, and electro-reclamation but these methods are not suitable for remediation of Pb(II) contaminated sites at large-scale due to their high cost and low efficacy [10, 11]. In addition, these methods cause destruction of soil fertility, structure, and other properties.
Microbial remediation of Pb(II) polluted sites has been considered as a cost effective, promising, and environment-friendly approach as these microbes such as Acinetobacter junii Pb1, Pseudomonas stutzeri M-9, Vibrio harveyi M-11, and Ralstonia metallidurans CH34 are known to be resistant to heavy metals to a very high concentration [12–14]. Various mechanisms are known in microbes which help them to oppose the toxic effect of Pb(II). These mechanisms include sequestration by exopolymers, bioaccumulation, efflux, immobilization, and precipitation [13, 15, 16]. However, to understand the lead-microbe interactions and test the practicality of the microbial strategy more work needs to be done.
Flow cytometer is a technology to characterize cell populations based on the measurement of scattered light and fluorescence emitted by dyes. Acinetobacter species shows different mechanisms for remediating the toxicity of lead via binding of lead on cell wall, adsorption on polysaccharides, extracellular sequestration, and efflux mechanism or by intracellular accumulation [12, 13, 16]. This helps in neutralizing the toxic effect of lead in the environment. Because Pb(II) is an ongoing problem, it is important to explore potential microbial bioremediation of this persistent heavy metal. Therefore, in the present study, Acinetobacter junii Pb1 is studied as it has potential use in remediation of lead from contaminated soil. The physiological response of Acinetobacter junii Pb1 when challenged with different concentration of lead was investigated by flow cytometry, spectrofluorimetry, and fluorescence microscopy. For lead accumulation, cells must remain intact and be metabolically active. The effect of lead on cytoplasmic integrity is observed using two fluorescent dyes, propidium iodide (PI) and Leadmium Green AM dye (LG AM dye).
Materials and methods
The strain was isolated from coal mine dump, Uttar Pradesh, India, and it was identified as Acinetobacter junii Pb1 on the basis of morphological, biochemical, BIOLOG and 16S rRNA gene sequence (accession no. KP284268). The strain is reported to be highly resistant to Pb(II) and other heavy metals [12]. LG AM dye and PI was purchased from ThermoFisher Scientific and Sigma-Aldrich, respectively. All other reagents and media were purchased from HiMedia unless otherwise noted.
Growth profile of A. junii Pb1
Effect of various lead [Pb(II)] concentrations (0, 100, 250, 500, and 1000 mg l−1) on growth of A. junii Pb1 was monitored at various time intervals. One hundred milliliter of Luria Bertani (LB) broth was spiked with various concentrations of Pb(II) as lead nitrate [Pb (NO3)2] (Merck), inoculated with 0.1 ml of bacterial culture (optical density 1.0) and incubated at 30 °C at 110 rpm. Samples were withdrawn periodically and analyzed for biomass dry weight, optical density at 600 nm, bacterial (viable) population by plate count.
Fluorescence microscopy and flow cytometry
Fluorescent dyes
The stock solution of LG dye was made as per the manufacturer’s protocol. Briefly, 50 μl DMSO (aqueous) was added to one vial of dye containing 50 μg of dye. The solution was mixed well and protected from light. The working solution of LG dye was prepared by diluting appropriate amount of LG stock solution in saline (0.85% NaCl) 1:10 (i.e., adding 20 μl stock solution dye to 180 μl saline). Similarly, working solution of PI was made by diluting PI in saline. Three hundred microliter of bacterial suspension was taken and to it 10 μl of PI (1 mg ml−1) was added and vortexed gently to mix well. Further, it was incubated for 10–20 min in dark at room temperature.
Fluorescence microscopy
The adsorption and/or accumulation of Pb(II) by A. junii Pb1 was studied by fluorescence microscope (FM). A. junii Pb1 was grown in LB broth spiked with Pb(II) (100 mg l−1) for 24 h at 30 °C at 110 rpm. After incubation, cells were harvested by centrifugation at 7000 rpm for 10 min at 4 °C. Cells were washed and resuspended in 0.85% NaCl. After suspending pellet in saline, suspension was divided into two portions. To one portion of cell suspension LG dye was added and incubated at room temperature for 1 h and to the other portion PI dye was added and incubated for 30 min. After incubation samples were washed and resuspended in 0.85% NaCl and studied by fluorescence microscope (LS-45 PerkinElmer).
Spectrofluorimetry
Spectrofluorimetry measurements of LG dye was performed on the salt (de-esterified) species as described by Malaiyandi et al. (2016) [17]. Briefly, the commercially available, LG dye was converted to the salt form. Fifty microgram LG dye was dissolved in 50 μl DMSO, followed by an equal volume of methanol and 25 μl of 2 M potassium hydroxide. After 1 h incubation, pH was adjusted to seven with HCl. The de-esterified form was used fresh and discarded at the end of the day. To assess the adsorption and/or accumulation of Pb(II), A. junii Pb1 was grown in the presence of Pb(II) (1 mg l−1) in LB broth for 24 h at 30 °C at 110 rpm. After 24 h, pellet was harvested by centrifugation at 7000 rpm for 10 min at 4 °C. Pellet was washed twice and resuspended in 0.85% NaCl. After suspending the pellet in saline, suspension was divided into two portions. To one portion of cell suspension LG dye was added and incubated at room temperature for 1 h. To confirm that perceived fluorescence is due to the presence of Pb(II) in other portion of cell suspension EDTA (100 mM) was added, which is a cell permeant and a metal chelator, along with LG dye and incubated at room temperature for 1 h. After incubation, samples were analyzed by spectrofluorimetry (P-8Y ST-1 Olympus) for the presence of Pb(II) in pellet.
Flow cytometry study (FACS) using LG dye and PI
Cell cultivation
A. junii Pb1 was grown overnight at 30 °C in LB broth at 110 rpm. Six flasks consisting of LB broth with different concentrations of lead (0, 100, 250, 500, and 1000 mg l−1) was inoculated with overnight grown culture of O.D. 1.0 and incubated for 24 h at 30 °C at 110 rpm. The pellet was harvested by centrifugation at 7000 rpm for 10 min at 4 °C. Pellet was washed and resuspended in 0.85% NaCl to reach an optical density of 1.0 at 600 nm.
Staining with LG AM dye and PI
To the harvested cells in the “Cell cultivation” section, 4 μl of LG AM dye was added from working solution to all the tubes and vortexed briefly to mix. The tubes were incubated in a water bath at 37 °C for 40 min, protected from light. After incubation, 4 ml of warm saline was added to each tube. The cells were harvested by centrifugation at 7000 rpm for 10 min. The pellet was suspended in 0.5 ml saline and mixed well. To the cell suspension, 10 μl of PI (1 mg ml−1) was added and vortexed gently and incubated for 15 min at room temperature. The sample was analyzed by the flow cytometer within an hour.
FACS study
Flow cytometric measurements (FCM) were carried out using The BD Accuri™ C6 equipped with blue and red laser having constant wavelength excitation at 488 nm and 640 nm, respectively; two light scatter detectors and four fluorescence detectors with optical filters to detect green, yellow-orange, and red fluorescence simultaneously. Excitation was done at 488 nm, the red (FL2, 585 nm) and green color (FL1, 525/10 nm) fluorescence detector was used for the current study. PI stained (dead cells) were detected as red fluorescence (FL2) whereas LG stained (live cells) were detected as green fluorescence (FL1). The light scattering data forward scatter (FSC) and side scatter (SSC) allows the discrimination of cells on the basis of size and granularity, respectively.
Statistical analysis
All the experiments were carried out in triplicates and the values are expressed as mean ± standard deviation (SD) The results of effect of different Pb(II) concentrations (0, 100, 250, 500, and 1000 mg l−1) on cell density, biomass dry weight and viable count, and FACs study were analyzed by ANOVA Dunnett’s post hoc tests using KyPlot. A value of P < 0.05 was considered to be statistically significant.
Results
Growth profile of A. junii Pb1
Fig. 1 shows the growth of A. junii Pb1 in the absence and presence of Pb(II). There was no significant (P > 0.05) difference in the cell density, biomass dry weight, and viable count of the bacterium at 100, 250, and 500 mg l−1 Pb(II) concentration when compared with that of control (0 mg l−1 Pb). However, at 1000 mg l−1 Pb(II) concentration a significant difference was observed in the cell density, biomass dry weight, and viable count when compared with the control. In the absence of Pb(II) maximum cell density, biomass dry weight and viable count was reached at 24 h. At 100 mg l−1 and 250 mg l−1 of Pb(II), growth profile of A. junii Pb1 was similar as in the absence of Pb(II) and maximum cell density, biomass dry weight, and viable count was achieved at 24 h (Fig. 1) suggesting that there was no toxic effect of Pb(II) on A. junii Pb1. At 500 mg l−1, maximum viable count was achieved at 72 h indicating the toxic effect of Pb(II) on A. junii Pb1. At 500 mg l−1, cell density and biomass dry weight showed an increase in lag phase and maximum values were obtained at 72 h, though cell density, biomass dry weight, and viable count is comparable with that observed at 100 and 250 mg l−1 Pb(II) concentration. This suggests that at 500 mg l−1 the maximum cell density achieved is similar to that achieved at 100 and 250 mg l−1; however, due to the toxic levels of Pb(II), the strain requires some time to acclimatize to the environment so there is an increase in lag phase. Increase in O.D600 was observed at 0 h in the medium containing 1000 mg l−1 of Pb(II) which is due to the precipitation of Pb(II) in LB broth.
Fig. 1.
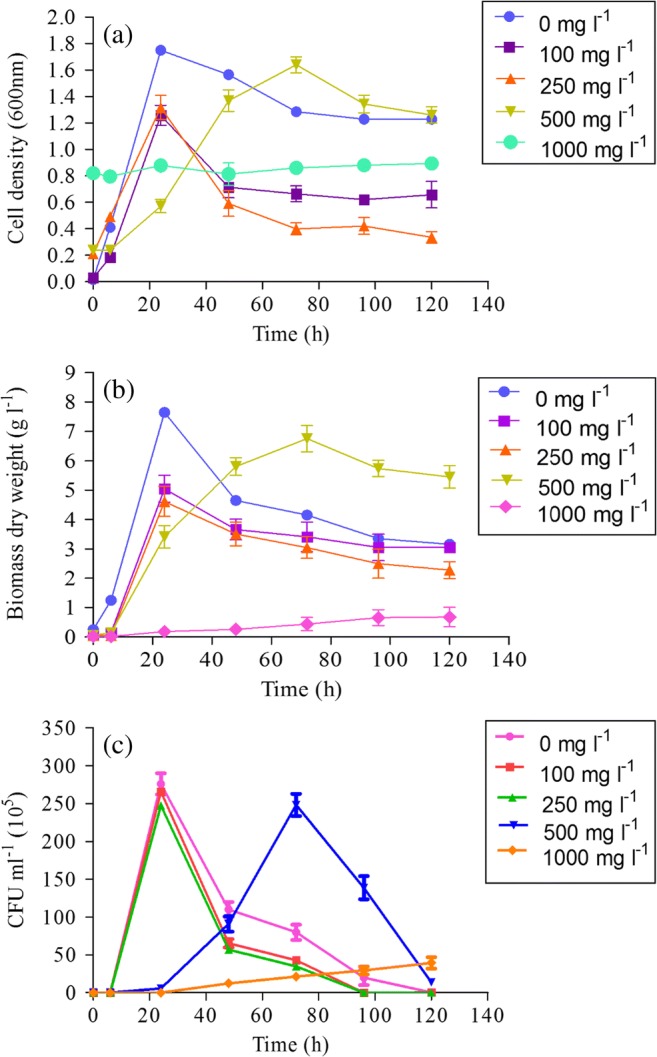
Growth profile of A. junii Pb1 in the presence of different Pb(II) concentration (0, 100, 250, 500, and 1000 mg l−1) a cell density, b biomass dry weight (g l−1), and c CFU count (CFU ml−1) (n = 3)
Fluorescence microscopy
Fig. 2 shows the A. junii Pb1exposed to Pb(II) as viewed by FM. It is clearly observed from the Fig. 2a that when A. junii Pb1 is stained with LG dye, maximum population of cells were live and accumulated Pb(II) inside the cells. Thus, Pb(II) shows less toxicity to A. junii Pb1. When cells were stained with PI, a very less population was stained signifying less cell death (Fig. 2b).
Fig. 2.
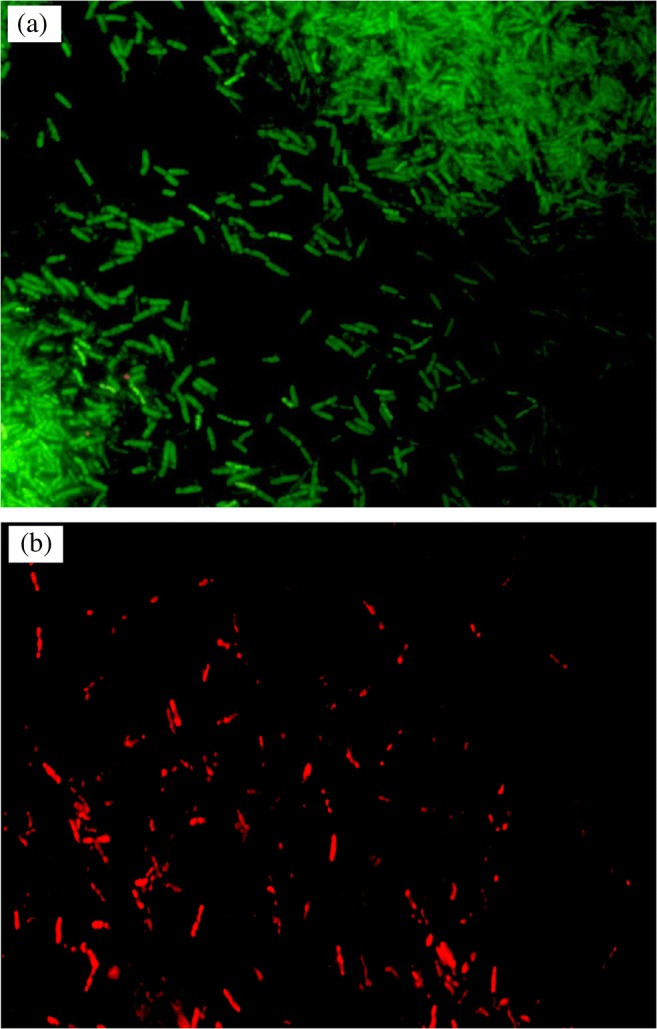
Fluorescence microscopy of A. junii Pb1 stained with a leadmium green dye, b propidium iodide in the presence of lead (100 mg l−1) (1000X) (Green fluorescence indicated live and Pb(II) accumulating bacteria; Red fluorescence indicates dead cells)
Spectrofluorimetry
LG dye was used to detect intracellular free Pb(II) at nanomolar level. Fig. 3 shows the emission spectra of LG in response to added Pb(II) in the range of 0–4 mg l−1. It is clearly viewed from Fig. 3 that with the increase in Pb(II) concentration there was increase in fluorescence. Emission of green fluorescence by the bacterial cells stained with LG indicates the presence of Pb(II) associated with the biomass (Fig. 3). Further, decline in the fluorescence following treatment of biomass with EDTA confirms the presence of free Pb(II) inside the bacterial cells, as EDTA limits the availability of free Pb(II) ions by chelating to them and making them unavailable for LG dye.
Fig. 3.

Emission spectra of Leadmium Green at different Pb(II) concentration (0, 2, 3, and 4 mg 1−1) and A. junii Pb1 grown in the presence of Pb(II) (1 mg l−1). (B, cell biomass; E, EDTA)
FACS study
Effect of Pb(II) on viability of A. junii Pb1
Cell viability was studied by staining with PI (dead cells) and LG dye (live and Pb(II) accumulating cells) at varying Pb(II) stress conditions of 0, 100, 250, 500, 1000 mg l−1. Fig. 4 shows that with the increase in Pb(II) concentration, viability of A. junii Pb1 was found to decrease significantly (P < 0.05) except at 100 mg l−1 (P > 0.05). At 1000 mg l−1, 42% cell death was observed followed by 500 mg l−1 (10%) then 9% cell death at 250 mg l−1, and finally 2% cell death at 100 mg l−1. The population of live and Pb(II) accumulating cells (LG stained) was found to increased significantly (P < 0.05) at all Pb(II) concentrations. Injured cell population (PI+LG stained) was also found to increase significantly (P < 0.05) with increase in Pb(II) concentration except at 100 mg l−1 (P > 0.05).
Fig. 4.

Percentage of PI positive (dead cells); Ledmium green positive (live and Pb(II) accumulating cells); Leadmium and PI positive population (injured cells), and unstained bacterial cell population (n = 3); ** indicates P < 0.01; *** indicates P < 0.001; ns indicates non-significant
Size and complexity of A. junii Pb1
The effect of Pb(II) on bacterium size and complexity was also monitored. Cell size and granularity was significantly (P < 0.05) correlated with Pb(II) concentration (r = 0.95). Cell size (FSC) was found to increase significantly (P < 0.05) with an increasing Pb(II) concentration except at 1000 mg l−1 (Fig. 5). The relative size of the bacterium increased significantly (P < 0.05) by 47, 90, and 92 at 100, 250, and 500 mg l−1 Pb(II) concentration, respectively. (Fig. 5). Based on SSC value, cell complexity (in term of granularity) was found to significantly (P < 0.05) increase by 27, 56, 68, and 70% at 100, 250, 500, and 1000 mg l−1 Pb(II) concentration, respectively (Fig. 6).
Fig. 5.
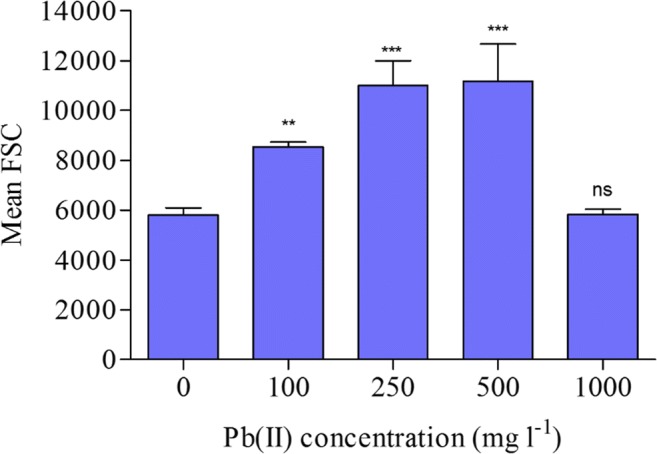
Effect of Pb(II) on relative cell size of A. junii Pb1 (n = 3); ** indicates P < 0.01; *** indicates P < 0.001; ns indicates non-significant
Fig. 6.

Effect of Pb(II) on cell granularity of A. junii Pb1 (n = 3); * indicates P < 0.05; *** indicates P < 0.001
Confirmation of Pb(II) accumulation by A. junii Pb1
A population of live cells, injured cells as well as dead cells is shown by double staining with LG AM and PI dyes. LG AM dye is known to specifically bind with Pb(II) at nanomolar concentration in cells and becomes fluorescent (green in color). Leadmium positive population shows Pb(II) containing cells in FL1 detector which is represented by UL (Upper Left) quadrant. PI positive population appears in FL 2 detector and shows dead cells due to toxicity of lead (Pb) which is represented by LR (Lower Right) quadrant. UR (Upper Right) quadrant shows the population which take both dye PI as well as LG AM dye. UR quadrant contain such kind of population which are injured due to lead toxicity or the cell which initially take up Pb(II) from media but not withstand with environment at last cell dead. LL (Lower Left) quadrant shows that the cells do not take anything.
A significant (P < 0.05) positive correlation (r = 0.96) existed between Pb(II) concentration and PI positive cells. At 100, 250, and 500 mg l−1 Pb(II) concentrations, the population of PI positive cells is relatively less and the population of LG positive cells is high, in comparison with that at 1000 mg l−1 Pb(II) concentration, signifying that at these concentrations Pb(II) is taken up by cells without much toxic effect (Fig. 7). However, at 1000 mg l−1 Pb(II) concentration, the population of PI positive cells is high and LG positive cells is low indicating the cell death due to Pb(II) toxicity.
Fig. 7.

Dot plots (side versus forward scatter) of A. junii Pb1 at various Pb(II) concentrations a 0 mg l−1, b 100 mg l−1, c 250 mg l−1, d 500 mg l−1, and e 1000 mg l−1 showing live and (II) accumulating population (leadmium positive; FL1-A) and dead population (PI positive; FL2-A)
Discussion
Soil contamination with metals exerts deleterious effects on soil microorganisms and microorganisms resist against these metals through various mechanisms. The microorganisms present in such type of ecosystem can be explored for their potential application of remediation of contaminated sites.
In the present study, the effect of different Pb(II) concentration on growth of A. junii Pb1 was studied and it was observed that there was no significant (P > 0.05) change in cell density, biomass dry weight, and viable count of the bacterium in the presence of 100, 250, and 500 mg l−1 of Pb(II) in the growth medium, though prolonged lag case was observed in the case of 500 mg l−1. However, at 1000 mg l−1 all the three parameters no significant growth was observed due to high Pb(II) toxicity. Marzan et al. (2017) reported decrease in cell density with increase in Pb(II) concentration in LB broth, from 300 to 1000 mg l−1 by multi-heavy metal resistant strains Gemella sp., Micrococcus sp., and Hafnia sp [18]. Chen et al. (2015) reported the inhibition of growth of Bacillus thuringiensis 016 above 400 mg l−1 Pb(II) concentration [19]. Chatterjee et al. (2014) reported the slight variations in lag phase and exponential phase when a heavy metal resistant bacterial isolate was grown in the presence of Pb(II) [20]. The Pb(II) resistant bacterium reported in the present study possess tolerance for Pb(II) up to 500 mg l−1 concentration without any deleterious effect on its growth.
The effect of Pb(II) on A. junii Pb1 was further studied by fluorescence microscopy. The fact that a higher proportion of cells were stained with LG AM dye and less cells were stained with PI, signifies that there was less toxic effect of Pb(II) on A. junii Pb1. Furthermore, the accumulation of Pb(II) by A. junii Pb1 was studied by spectrofluorimetry. The results showed that A. junii Pb1 adsorbed and/or accumulated Pb(II) when grown in LB broth. It was also observed that in the presence of EDTA there was a decrease in fluorescence signifying the chelation of Pb(II) with EDTA thereby, limiting the free Pb(II) ions availability. Malaiyandi et al. (2016) also reported the increase in fluorescence with the increase in intracellular Pb(II) concentration in mouse hippocampal HT22 cells [17].
The resistance of A. junii Pb1 towards Pb(II) was further studied by FACS. In the current study, the effect of Pb(II) on bacterium size and complexity was studied by FSC and SSC. The FSC value shows that the relative size of bacterium increased with an increase in Pb(II) concentration till 500 mg l−1 and further declined at 1000 mg l−1. Many researchers reported the increase in bacterial cell size in the presence of heavy metals using scanning electron microscopy (SEM). Increase in size of the bacterium on Pb(II) exposure has also been evidenced by SEM imaging [12]. Khan et al. (2016) also used SEM to assess the impact of Cd(II) on the cell size of Salmonella enterica 43C and reported the increase in cell size in the presence of Cd(II) [21]. Jobby et al. (2015) studied the effect of Ni(II) on Sinorhizobium sp., BEL5B, and SEM images revealed the increase in cell size [22]. The SSC value shows an increase in cell granularity with the increase in Pb(II) concentration. Thus, it can be concluded that in the presence of Pb(II), relative size and complexity of bacterium is greatly affected.
Conclusion
The present study focusses on the ability of A. junii Pb1 to tolerate high concentration of Pb(II), without growth inhibition up to 500 mg l−1. The resistance pattern of A. junii Pb1 towards Pb(II) was studied by analyzing cell viability by FM, FCM, and Spectrofluorimetry using fluorescence dye PI and LG AM dye which confirm its intracellular accumulation by the bacterium. The use of FCM is a rapid, excellent means to detect the physiological changes in bacteria cells under stress. Dead (PI stained) cell population was insignificant at 100, 250, and 500 mg l−1 Pb(II) concentration, thereafter (1000 mg l−1) it significantly increased, as observed by FCM studies. Physiological changes in the bacterium following Pb(II) exposure included increase in cell size and cell granularity. Because of its capacity to survive and grow at highly toxic Pb(II) concentrations, the strain A. junii Pb1 can be used for the bioremediation of Pb(II) contaminated sites.
Acknowledgements
The authors are grateful to MNNIT, Allahabad for this research. The authors are grateful to CIR, MNNIT, Allahabad and CMDR, MNNIT, Allahabad for providing facility for spectrofluorimetry and flow cytometry respectively. The authors are grateful to Dr. Jyotsna Sinha for the proofread for English language and grammar.
Compliance with ethical standards
Conflict of interest
The authors declare that they have no conflict of interest.
Footnotes
Purushottam Kumar Singh and Anamika Kushwaha are considered as first author
Publisher’s note
Springer Nature remains neutral with regard to jurisdictional claims in published maps and institutional affiliations.
References
- 1.Bind A, Goswami L, Prakash V. Comparative analysis of floating and submerged macrophytes for heavy metal (copper, chromium, arsenic and lead) removal: sorbent preparation, characterization, regeneration and cost estimation. Geol Ecol Landsc. 2018;2(2):61–72. doi: 10.1080/24749508.2018.1452460. [DOI] [Google Scholar]
- 2.Arul Manikandan N, Alemu AK, Goswami L, Pakshirajan K, Pugazhenthi G. Waste litchi peels for Cr (VI) removal from synthetic wastewater in batch and continuous systems: sorbent characterization, regeneration and reuse study. J Environ Eng. 2016;142(9):C4016001. doi: 10.1061/(ASCE)EE.1943-7870.0001099. [DOI] [Google Scholar]
- 3.Kushwaha A, Rani R, Kumar S, Gautam A. Heavy metal detoxification and tolerance mechanisms in plants: implications for phytoremediation. Environ Rev. 2015;23:1–13. doi: 10.1139/er-2014-0039. [DOI] [Google Scholar]
- 4.Kushwaha A, Rani R, Kumar S (2017) Mechanism of soil-metal-microbe interactions and their implication on microbial bioremediation and phytoremediation. In book: Environmental science and engineering volume 8 biodegradation and bioremediation edition: edition 1st volume 8, Publisher: Studium press LLC, U.S.A. Editors: Pravinder Kumar, Bhola R Gurjar, J N Govil
- 5.Kushwaha A, Hans N, Rani R, Kumar S. A critical review on speciation, mobilization and toxicity of lead in soil-microbe-plant system and bioremediation strategies. Ecotoxicol Environ Saf. 2018;147:1035–1045. doi: 10.1016/j.ecoenv.2017.09.049. [DOI] [PubMed] [Google Scholar]
- 6.Goswami L, Manikandan NA, Pakshirajan K, Pugazhenthi G. Simultaneous heavy metal removal and anthracene biodegradation by the oleaginous bacteria Rhodococcus opacus. 3 Biotech. 2017;7(1):37. doi: 10.1007/s13205-016-0597-1. [DOI] [PMC free article] [PubMed] [Google Scholar]
- 7.Gupta DK, Huang HG, Yang XE, Razafindrabe BHN, Inouhe M. The detoxification of lead in Sedum alfredii H. is not related to phytochelatins but the glutathione. J Hazard Mater. 2010;177:437–444. doi: 10.1016/j.jhazmat.2009.12.052. [DOI] [PubMed] [Google Scholar]
- 8.Maestri E, Marmiroli M, Visioli G, Marmiroli N. Metal tolerance and hyperaccumulation: costs and trade-offs between traits and environment. Environ Exp Bot. 2010;68:1–13. doi: 10.1016/j.envexpbot.2009.10.011. [DOI] [Google Scholar]
- 9.Ghosh M, Singh S. A review on phytoremediation of heavy metals and utilization of it’s by products. Asian J Energy Environ. 2005;6(4):18. [Google Scholar]
- 10.Glick BR. Using soil bacteria to facilitate phytoremediation. Biotechnol Adv. 2010;28:367–374. doi: 10.1016/j.biotechadv.2010.02.001. [DOI] [PubMed] [Google Scholar]
- 11.Ali H, Khan E, Sajad MA. Phytoremediation of heavy metals-concepts and applications. Chemosphere. 2013;91:869–881. doi: 10.1016/j.chemosphere.2013.01.075. [DOI] [PubMed] [Google Scholar]
- 12.Kushwaha A, Rani R, Kumar S, Thomas T, David AA, Ahmed M. A new insight to adsorption and accumulation of high lead concentration by exopolymer and whole cells of lead-resistant bacterium Acinetobacter junii L. Pb1 isolated from coal mine dump. Environ Sci Pollut Res. 2017;24:10652–10661. doi: 10.1007/s11356-017-8752-8. [DOI] [PubMed] [Google Scholar]
- 13.Naik MM, Dubey SK. Lead resistant bacteria: lead resistance mechanisms, their applications in lead bioremediation and biomonitoring. Ecotoxicol Environ Saf. 2013;98:1–7. doi: 10.1016/j.ecoenv.2013.09.039. [DOI] [PubMed] [Google Scholar]
- 14.Borremans B, Hobman JL, Provoost A, Brown NL, van der Lelie D. Cloning and functional analysis of the pbr lead resistance determinant of Ralstonia metallidurans CH34. J Bacteriol. 2001;183:5651–5658. doi: 10.1128/JB.183.19.5651-5658.2001. [DOI] [PMC free article] [PubMed] [Google Scholar]
- 15.Park JH, Bolan N, Megharaj M, Naidu R. Concomitant rock phosphate dissolution and lead immobilization by phosphate solubilizing bacteria (Enterobacter sp.) J Environ Manag. 2011;92:1115–1120. doi: 10.1016/j.jenvman.2010.11.031. [DOI] [PubMed] [Google Scholar]
- 16.Jaafar R, Al-Sulami A, Al-Taee A. Bioaccumulation of cadmium and lead by Shewanella oneidensis isolated from soil in Basra governorate, Iraq. Afr J Microbiol Res. 2016;10:370–375. doi: 10.5897/AJMR2016.7912. [DOI] [Google Scholar]
- 17.Malaiyandi LM, Sharthiya H, Dineley KE. Fluorescence detection of intracellular cadmium with Leadmium Green. Biometals. 2016;29:625–635. doi: 10.1007/s10534-016-9939-z. [DOI] [PubMed] [Google Scholar]
- 18.Marzan LW, Hossain M, Mina SA, Akter Y, Chowdhury AMA. Isolation and biochemical characterization of heavy-metal resistant bacteria from tannery effluent in Chittagong city, Bangladesh: bioremediation viewpoint. Egypt J Aquat Res. 2017;43(1):65–74. doi: 10.1016/j.ejar.2016.11.002. [DOI] [Google Scholar]
- 19.Chen Z, Pan X, Chen H, Lin Z, Guan X. Investigation of lead (II) uptake by Bacillus thuringiensis 016. World J Microbiol Biotechnol. 2015;31(11):1729–1736. doi: 10.1007/s11274-015-1923-1. [DOI] [PubMed] [Google Scholar]
- 20.Chatterjee S, Das J, Chatterjee S, Choudhuri P, Sarkar A. Isolation, characterization and protein profiling of Lead resistant Bacteria. Br Microbiol Res J. 2014;4(1):116–131. doi: 10.9734/BMRJ/2014/5862. [DOI] [Google Scholar]
- 21.Khan Z, Rehman A, Hussain SZ, Nisar MA, Zulfiqar S, Shakoori AR. Cadmium resistance and uptake by bacterium, Salmonella enterica 43C, isolated from industrial effluent. AMB Express. 2016;6(1):54. doi: 10.1186/s13568-016-0225-9. [DOI] [PMC free article] [PubMed] [Google Scholar]
- 22.Jobby R, Jha P, Desai N. Sinorhizobium, a potential organism for bioremediation of nickel. Int J Adv Res. 2015;3:706–717. [Google Scholar]