

Abstract
The production of a highly concentrated probiotic preparation of Lactococcus lactis CECT 539 was studied in both batch and realkalized fed-batch fermentations in diluted whey (DW) media (DW25, DW50, DW75, DW100, and DW125) supplemented with MRS broth nutrients (except glucose and Tween 80) at 25, 50, 75, 100, and 125% of their standard concentrations in the complex medium. The fed-batch culture using DW100 medium provided the highest concentrations of probiotic biomass (5.98 g/L) and nisin (258.47 BU/mL), which were obtained at lower production costs than those estimated for the fed-batch culture in DW medium. The batch and fed-batch cultures reduced the initial chemical oxygen demand (COD) of the media by 29.1–41.7% and 31.2–54.2%, respectively.
Graphical abstract
Electronic supplementary material
The online version of this article (10.1007/s42770-019-00114-1) contains supplementary material, which is available to authorized users.
Keywords: Batch fermentation, Fed-batch fermentation, Probiotic biomass, Nisin, Whey
Introduction
Whey is a byproduct of the dairy industry that contains approximately 4.7% (w/w) lactose, proteins (20% of milk proteins), lipids, phosphorus, nonprotein nitrogen, water-soluble vitamins, and minerals [1, 2]. To take advantage of these nutrients, this waste has been used for different industrial bioproduction processes to obtain high value-added products, including single-cell proteins, enzymes, organic acids (lactic, succinic, and propionic), exopolysaccharides, bacteriocins, and bioplastics [1–4].
From an environmental perspective, these applications for whey allow for its initial nutrient concentration to be reduced considerably [3–5], consequently reducing its high chemical (50–102 g/L) and biological (27–60 g/L) oxygen demands [6]. This aspect contributes to a considerable decrease in both the contamination effect and cost associated with the depuration and disposal of this waste [2–4, 7].
In recent years, our lab has successfully designed a fed-batch fermentation technique based on successive realkalization of the fermentation medium (diluted whey, DW) to produce whey-based probiotic products containing high amounts of nisin [1, 3, 4, 7]. The use of probiotics in animal feed has gained great interest for replacing antibiotics in animal feeds [1, 8], since the use of the latter compounds was banned by the European Union (EU) in 2006 [9] due to the serious side effects on human health [8, 9]. Nisin has been approved by both the FDA and the EU (with an E-number of E234 (preservative)) for use in food preservation and has been used in different countries [10]. This bacteriocin has broad-spectrum antibacterial activity against Gram-positive bacteria, including many important food-spoilage and pathogenic bacteria, such as Listeria monocytogenes, Staphylococcus aureus, Bacillus cereus, Clostridium botulinum, and Enterococcus faecalis [4, 11].
However, the use of unsupplemented DW medium as a fermentation substrate has resulted in considerably lower levels of biomass and nisin than those obtained in MRS broth [3, 4, 11]. Therefore, the use of DW media supplemented with the nutrients present in the MRS medium could potentially produce probiotic cultures with enhanced levels of probiotic biomass and nisin in fed-batch cultures. However, to the best of our knowledge, no information is currently available on the use of DW containing different concentrations of MRS broth nutrients for the production of probiotic products by lactic acid bacteria.
For these reasons, the aim of the present work was to study the production of probiotic biomass and nisin by Lactococcus lactis CECT 539 in realkalized fed-batch cultures in DW media supplemented with different concentrations of the nutrients present in MRS broth.
Materials and methods
Bacterial cultures
Lactococcus lactis CECT 539 and Carnobacterium piscicola CECT 4020 strains, which were both acquired from the Spanish Type Culture Collection (CECT, Valencia, Spain), were used as nisin-producing and nisin-sensitive indicator bacteria, respectively. C. piscicola CECT 4020 was selected as the target bacterium in the bacteriocin activity assay since it showed the highest sensitivity to nisin among 19 indicator strains screened for their sensibility to this bacteriocin [11].
Working cultures of both bacteria were grown on MRS (De Man, Rogosa and Sharpe, Merck, Germany) as agar slants and were propagated twice in MRS broth (30 °C, 12 h) before use [11].
Culture medium and fermentation conditions
In this study, the culture media used were prepared with concentrated (CW) and diluted (DW) whey, both of which were obtained from a local dairy plant. Before being used for culture media, both substrates were deproteinized by acidification to pH 4.5 with 5 M HCl, heating (121 °C/15 min) to denature the proteins, and centrifugation (12,000×g/15 min) to remove the precipitates. This treatment was carried out to avoid protein precipitation at acidic pH values, which interferes with biomass measurements [3]. The resulting CW medium contained (per L) 53.401 ± 0.154 g lactose, 0.994 ± 0.017 g total nitrogen, 0.472 ± 0.005 g total phosphorus, and 4.573 ± 0.016 g soluble proteins. The resulting DW medium contained (per L) 20.035 ± 0.323 g lactose, 0.435 ± 0.023 g total nitrogen, 0.227 ± 0.016 g total phosphorus, and 2.056 ± 0.023 g soluble proteins.
DW25, DW50, DW75, DW100, and DW125 media were prepared by supplementing the DW medium with the nutrients present in MRS broth (except glucose and Tween 80) at 25, 50, 75, 100, and 125% (w/v) of the standard concentrations of each component in the complex medium, respectively (Table 1). Since the addition of glucose to the DW medium induces substrate inhibition of both the growth and bacteriocin production of L. lactis CECT 539 [3], this monosaccharide was not used as an additive in this study. Similarly, Tween 80 was not used to supplement the fermentation medium because the addition of this compound inhibits [12] or does not improve [13] bacteriocin synthesis by L. lactis strains ATCC 11454 and UQ2, respectively.
Table 1.
Mean composition (g/L) of the DW media
| Culture medium | |||||
|---|---|---|---|---|---|
| Nutrient | DW25 | DW50 | DW75 | DW100 | DW125 |
| Bacteriological peptone | 2.5 | 5.0 | 7.5 | 10.0 | 12.5 |
| Meat extract | 2.0 | 4.0 | 6.0 | 8.0 | 10.0 |
| Yeast extract | 1.0 | 2.0 | 3.0 | 4.0 | 5.0 |
| Di-potassium hydrogen phosphate | 0.5 | 1.0 | 1.5 | 2.0 | 2.5 |
| Diammonium hydrogen citrate | 0.5 | 1.0 | 1.5 | 2.0 | 2.5 |
| Sodium acetate | 1.25 | 2.50 | 3.75 | 5.00 | 6.25 |
| Magnesium sulfate | 0.05 | 0.10 | 0.15 | 0.20 | 0.25 |
| Manganese (II) sulfate | 0.0125 | 0.0250 | 0.0375 | 0.0500 | 0.0625 |
| Total sugars | 20.962 | 21.925 | 22.887 | 23.852 | 24.812 |
| Total nitrogen | 1.198 | 1.960 | 2.722 | 3.485 | 4.247 |
| Total phosphorus | 0.296 | 0.365 | 0.434 | 0.502 | 0.571 |
| Proteins | 5.391 | 8.721 | 12.053 | 15.381 | 18.711 |
Batch fermentations were carried out in the unsupplemented DW medium (control) and in the DW25, DW50, DW75, DW100, and DW125 media adjusted to pH 7.0 with 5 M NaOH or in DW100 medium adjusted to initial pH values of 4.5, 5.0, 5.5, 6.0, 6.5, and 7.5 with 5 M HCl or 5 M NaOH. These batch cultures were carried out in duplicate 250-mL Erlenmeyer flasks containing 50 mL of the corresponding culture medium, which were previously sterilized at 121 °C for 15 min, in a rotary shaker at 200 rpm and 30 °C. Every 3 h, two flasks were withdrawn from each series of cultures to perform analytical determinations.
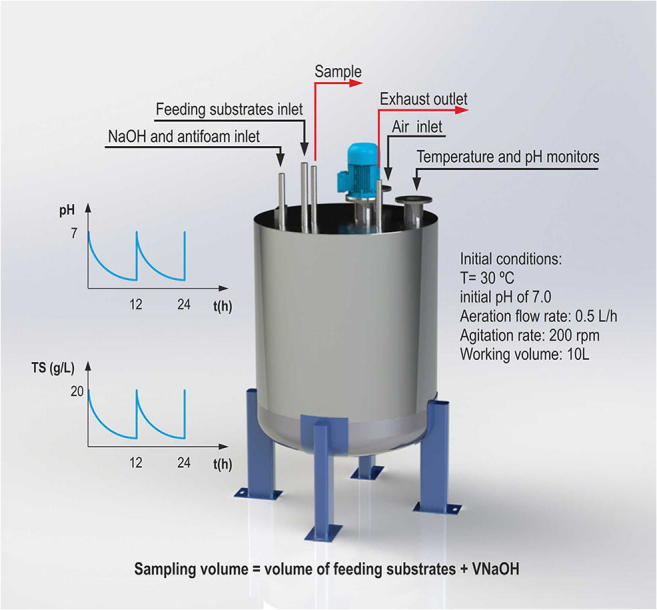
Four duplicate fixed-volume realkalized fed-batch fermentations were carried out in two 13-L fermenters placed in a twin configuration with 10-L working volumes of DW25, DW50, DW75, or DW100 media that had been previously adjusted to pH 7.0 with 5 M NaOH and sterilized (121 °C/15 min). A mixture of CW medium and a 400-g/L solution of concentrated glucose (CG) was used as the feeding medium. The CW medium (53.401 ± 0.154 g lactose/L) was used to supplement the growing cultures in the different realkalization and feeding cycles with additional amounts of nutrients similar to those present in the unsupplemented DW medium to prevent the nutrient exhaustion observed in the control cultures fed with concentrated solutions (400 g/L) of lactose or glucose [3]. Since the total sugar concentration of the CW medium was only 2.55, 2.43, 2.33, 2.24, and 2.15 times higher than those of the DW25, DW50, DW75, DW100, and DW125 media, respectively, the CG substrate was also used as a concentrated feeding medium to supplement the growing culture with lower volumes of feeding media and kept the fermentation volume in the fermenter constant (see supplementary information).
The fermentation conditions (30 °C, an aeration flow rate of 0.5 L/h, an agitation rate of 200 rpm, and a 12-h period of realkalization with 5 M NaOH and feeding) were identical to those used by Costas et al. [4]. After determining the total sugar concentration in the sample withdrawn (~ 100 mL) every 12 h, the medium was realkalized up to the initial pH (7.0) with 5 M NaOH, and the volume of alkali was registered. Then, the volumes of feeding substrates needed to restore the initial total sugar concentration in the corresponding fermentation medium in every period of realkalization and feeding were consecutively calculated on an Excel spreadsheet using the appropriate mass balance equations [1, 3, 4, 7, 8, 14].
In both the batch and realkalized fed-batch cultures, the fermentation media were inoculated with 2% (v/v) of a 12-h culture of L. lactis CECT 539 (containing 7.4 × 10⁹ cfu/mL) in MRS medium to yield an initial biomass concentration of 0.03 g/L (1.5 × 10⁹ cfu/mL) in the fermentation medium.
The samples collected from each culture were divided into two subsamples, the first of which was used to measure the culture pH, the total viable cells (as colony-forming units (cfu)/mL), and the concentrations (g/L) of total sugars (TS), nitrogen (TN), phosphorus (TP), proteins (Pr), glucose (G), and lactose (L), biomass (X), lactic acid (LA), acetic acid (AA), and butane-2,3-diol (B). The second subsample was used to quantify the nisin activity (Nis) as bacteriocin units (BU) per mL [7, 15, 16].
Analytical methods
The concentrations of nutrients (glucose, lactose, total sugars, nitrogen, phosphorus, and proteins), biomass, and fermentation products (lactic acid, acetic acid, and butane-2,3-diol) in the different media (Table 1) and in the fermented samples withdrawn every 3 h (batch cultures) or 12 h (fed-batch cultures) were determined in triplicate using the corresponding analytical methods described in a previous work [4] (see, supplementary information). The total viable cell counts were enumerated in triplicate samples on MRS agar at 30 °C for 48 h and expressed as colony-forming units (cfu)/mL, as indicated by Costas et al. [7].
Bacteriocin activity assay
Aliquots from cultures of L. lactis CECT 539 were adjusted to pH 3.5 with 5 M HCl, heated in a boiler water bath for 3 min, and centrifuged (27,200×g for 15 min at 4 °C) to remove dead cells from the supernatants. The cell-free supernatants (CFS) containing nisin activity were adjusted to pH 6.0 with 5 M NaOH and serially diluted as needed in sterile distilled water.
Nisin activity was determined by a photometric bioassay method [15]. Equivolume aliquots of the diluted CFS and a culture of the indicator strain diluted to an absorbance of 0.2 at 700 nm with sterile MRS broth (buffered at pH 6.3 with 0.1 M potassium hydrogen phthalate-NaOH) were added into sterile culture tubes [15]. Then, the tubes were incubated for 6 h at 30 °C and 200 rpm. Controls consisted of three culture tubes in which the diluted CFS was replaced with sterile distilled water. The absorbance of each tube was measured at 700 nm, and the growth inhibition percentage (GIP) was calculated to build dose-response curves (GIP values against the inverse of the corresponding dilution (1/D) of each sample). The nisin activity titers (as bacteriocin units (BU) per mL CFS) were calculated by establishing a dose-response model [16].
Chemical oxygen demand analyses
Chemical oxygen demand (COD) was determined in paper-filtered media before and after fermentation using the closed reflux colorimetric method described by the American Public Health Association (APHA) [17].
Buffering capacity of the DW, DW25, DW50, DW75, DW100, and DW125 media
The buffering capacity of the nutrient-supplemented DW media was determined by titrating 100 mL of the corresponding medium with 0.1 M NaOH or 0.1 M HCl. The buffering capacity was defined as the number of milliequivalents of NaOH or HCl required to shift the pH of 1 L of the medium by 1 unit [18].
Statistical analyses
The mean values for the culture pH; the concentrations of nutrients, biomass, nisin, and fermentation products; and the COD values obtained after averaging the culture (two) and run (three) replicates in the different batch and fed-batch cultures of L. lactis CECT 539 were statistically analyzed by a paired-samples t test (P < 0.05). The comparisons were performed with the software package IBM SPSS Statistics for Windows (Version 21.0, Armonk, NY: IBM Corp., 2012) with the level of significance set to 5% [3].
Results
Batch cultures in DW, DW25, DW50, DW75, DW100, and DW125 media
Figure 1 a shows the pH values, growth kinetics, nisin and lactic acid production, and nutrient (TS, TN, TP, and Pr) consumption observed for L. lactis CECT 539 in the DW, DW25, DW50, DW75, DW100, and DW125 media. The highest final concentrations of biomass and bacteriocin were obtained in the DW100 culture, and the addition of more nutrients (DW125 culture) did not significantly improve (P > 0.05) the final biomass, lactic acid, or nisin levels, or the amounts of TS, TN, TP, and Pr consumed (Fig. 1b). In addition, the batch cultures reduced the chemical oxygen demand (COD) by 29.1% (in DW medium), 38.6% (in DW25 medium), 41.5% (in DW50 medium), 41.7% (in DW75 medium), 39.0% (in DW100 medium), and 37.5% (in DW125 medium).
Fig. 1.

a Batch fermentations of L. lactis CECT 539 in the DW (■), DW25 (●), DW50 (□), DW75 (▽), DW100 (△) and DW125 (O) media. TS, Pr, TN, TP, X, Nis, and LA: concentrations of total sugars, proteins, total nitrogen, total phosphorus, biomass, nisin, and lactic acid. b The nutrients consumed (TSc, Prc, TNc, and TPc), rate of pH decrease (rpH), and products synthesized (Xp, Nisp, and LAp) as a function of the amount of nutrients (Nut) added
From a kinetics perspective, the concentrations of TS, TN, TP, and Pr changed in parallel with the culture pH, and the profiles described by the latter variable appeared to be the nonsuperimposable mirror image of those observed for biomass, nisin, and lactic acid synthesis in each culture (Fig. 1a).
Although the pH time course for each culture was different (upper left part of Fig. 1a), the final pH values in all the fermentations remained almost identical (4.76 ± 0.04) such that similar (P > 0.05) final rates of pH decrease (rpH) were obtained in these cultures (Figs. 1a, b). Considering the increasing levels of biomass and lactic acid produced by L. lactis CECT 539 with the increase in nutrient supplementation (Fig. 1b), it is logical to hypothesize that the supplements added to the DW medium prevented the rapid decrease in pH observed in the control culture in the unsupplemented DW medium [14]. This reasoning was confirmed by determining the buffering capacities of the different DW media (Fig. 2). The nutrient-supplemented DW media showed higher buffering capacities than did the control culture over the observed pH range (between 7.0 and 3.5) in the different fermentations. However, the growth stopped at pH values of 4.84, 5.02, 4.99, 4.86, 4.74, and 4.79 (in DW, DW25, DW50, DW75, DW100, and DW125 media, respectively), but the nutrients were not completely exhausted in any case.
Fig. 2.
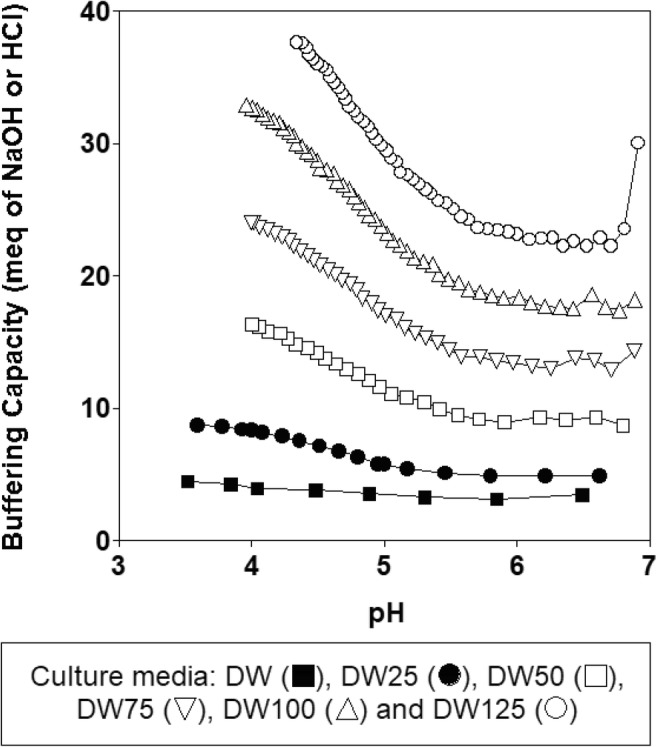
Buffering capacities of the different nutrient-supplemented DW media
To determine whether the cessation of growth was caused by an inappropriate pH value of the cultures, the mean rates of nutrient (TS, TP, TN, and Pr) consumption were plotted against culture pH at each sampling time (Fig. 3). The highest nutrient consumption rates in the different cultures were obtained at pH values between 5.8 and 6.5. This result suggested that a low pH could explain the observed cessation of growth observed in the different cultures.
Fig. 3.

Changes in the absolute mean consumption rates of total sugars (rTS), proteins (rPr), phosphorus (rTP), and nitrogen (rTN) with respect to the culture pH of the different batch fermentations. The gray rectangle indicates the optimum pH range (5.8–6.5) for nutrient consumption
Based on these results and considering that biomass production stopped at different pH values despite relatively high concentrations of nutrients remaining in the culture media (Fig. 1a), it is likely that other factors could have contributed to the cessation of growth in addition to the low culture pH. To investigate this possibility and select the most appropriate initial pH of fermentation medium for the realkalized fed-batch fermentations, a new series of batch cultures of L. lactis CECT 539 in DW100 medium adjusted to initial pH values of 4.5, 5.0, 5.5, 6.0, 6.5, and 7.5 were carried out (Fig. 4a, b). The experimental data obtained in the DW100 culture at an initial pH 7.0 (Fig. 1) were used for comparison.
Fig. 4.

a Batch fermentations of L. lactis CECT 539 in DW100 media adjusted to different initial pH values. b Nutrients consumed, rate of pH decrease, and products synthesized as a function of the initial culture pH values in the fermentations. The gray rectangle indicates the optimum pH range (5.8–6.5) for nutrient consumption (see Fig. 3). Other notations are as described in Fig. 1
The lowest levels of biomass, nisin, and lactic acid production, and nutrient consumption were obtained in the cultures adjusted to initial pH values of 4.5 and 5.0. In contrast, the highest amounts of nutrients consumed and biomass and lactic acid produced were obtained at an initial pH of 6.5, although the highest nisin level was obtained in the culture with an initial pH of 7.0, in which the highest final rpH was observed (Fig. 4a, b). Interestingly, the growth stopped after 15 h of incubation in the culture with an initial pH of 7.5 when the fermentation medium reached a pH value of 5.45, which is higher (P < 0.05) than that observed in the DW25 medium (pH 5.02, Fig. 1a). Similarly, the decrease in biomass production rates occurred after 15 h (at initial pH values of 6.0 and 6.5) or 18 h of fermentation (at an initial pH of 7.0) when the culture pH reached a value of 4.65, 4.77, or 4.74, respectively. However, a complete exhaustion of the nutrients (TS, TN, TP, and Pr) did not occur in these cultures, as observed for the previous batch fermentations (Fig. 1).
Realkalized fed-batch fermentations in DW25, DW50, DW75, and DW100 media
The time courses of culture pH values and the concentrations of biomass, viable cell counts, nisin, lactic acid, acetic acid, and butane-2,3-diol, total sugars, nitrogen, phosphorus, glucose, lactose, and proteins in the realkalized fed-batch cultures in the DW25, DW50, DW75, and DW100 media are shown in Figs. 5 and 6.
Fig. 5.

Changes in culture pH and rates of pH decrease in the four realkalized fed-batch fermentations
Fig. 6.

Kinetics of the cumulative concentrations of biomass, viable cell counts [log(cfu/mL)], nisin, lactic acid, acetic acid (AA), and butane-2,3-diol (B), and the remaining concentrations of proteins, total sugars, nitrogen and phosphorus, glucose (G), and lactose (L) in the four realkalized fed-batch fermentations. Other notations are as described in Fig. 1.
In the four fermentations, the final pH values for each realkalization and feeding cycle increased logistically, as previously observed for similar cultures of L. lactis CECT 539 in DW medium [3, 4, 7]. However, a comparison of the four cultures (Fig. 5) shows that the rates of pH decrease (rpH) at each incubation time decreased with the increase in the amounts of nutrients added to the DW medium (rpHDW25 > rpHDW50 > rpHDW75 > rpHDW125).
It can be noted that the supplementation of DW medium with increasing concentrations of nutrients favored nutrient utilization and the production of biomass, nisin, and lactic acid (Fig. 6). Thus, increased amounts (P < 0.05) of glucose (76.76, 97.11, 105.81, and 131.90 g/L), proteins (5.15, 8.14, 11.01, and 13.79 g/L), total nitrogen (1.15, 1.82, 2.50, and 3.12 g/L), and phosphorus (229.69, 286.89, 323.54, and 351.56 mg/L) were consumed in the DW25, DW50, DW75, and DW100 media, respectively. Similarly, increased concentrations of biomass (4.06, 4.31, 4.79, and 5.98 g/L), viable cell counts (1.9 × 10¹⁰, 2.0 × 10¹⁰, 2.2 × 10¹⁰, and 2.6 × 10¹⁰ cfu/mL), bacteriocin (148.21, 165.68, 199.60, and 258.47 BU/mL), and lactic acid (20.79, 25.78, 30.32, and 37.41 g/L) were obtained in the DW25, DW50, DW75, and DW100 media, respectively (Fig. 6). However, the levels of lactose (12.36, 10.75, 13.20, and 11.99 g/L) consumption in the four fed-batch cultures were very similar (P > 0.05).
The levels of biomass, viable cell counts, bacteriocin, and lactic acid obtained in the four nutrient-supplement DW media were considerably higher (P < 0.05) than those obtained in the control realkalized fed-batch cultures fed 400 g/L concentrated solutions of lactose (1.34 g/L, 7.62 × 10⁹ cfu/mL, 50.6 BU/mL, and 4.65 g/L) or glucose (1.51 g/L, 8.58 × 10⁹ cfu/mL, 60.3 BU/mL, and 5.31 g/L) [3].
In addition, the percentages of COD removal in the fed-batch cultures were 31.2% (in DW25 medium), 40.6% (in DW50 medium), 46.9% (in DW75 medium), and 54.2% (in DW100 medium). Thus, the reductions in COD obtained in the fed-batch fermentations in DW25 and DW50 media were lower (P < 0.05) or slightly lower (P < 0.05) than those obtained in the corresponding batch cultures, respectively. However, the fed-batch cultures in the DW75 and DW100 media provided the highest COD removal percentages (P < 0.05).
From a kinetics perspective, it can be observed that the consumption of proteins, total nitrogen, and phosphorus changed in parallel with biomass production, and the concentration of lactic acid increased from the beginning of the fermentation (Fig. 6). However, the production of acetic acid and butane-2,3-diol, which indicated the shift from homolactic to mixed acid fermentation, did not begin at the same incubation time in the different nutrient-supplemented DW media. For example, the synthesis of acetic acid was triggered at 120 h in the DW25 and DW50 media, 144 h in DW75 medium, and 180 h in the DW100 medium when the remaining nitrogen concentrations were 0.126, 0.133, 0.114, and 0.141 g/L, respectively (mean [TN] = 0.128 ± 0.011 g/L).
The synthesis of the product butane-2,3-diol was detected in the culture medium at 132 h in the DW25 and DW50 media, at 156 h in the DW75 medium, and at 192 h in the DW100 medium when the remaining nitrogen concentrations were 0.108, 0.110, 0.097, and 0.090 g/L, respectively (mean [TN] = 0.101 ± 0.009 g/L).
Estimated costs of probiotic biomass and nisin production in the batch and realkalized fed-batch cultures
In this study, the costs associated with the production of biomass and bacteriocin in the DW25, DW50, DW75, DW100, and DW125 media (Table 2) were calculated by considering the price of the amounts of nutrients added to the fermentation medium (Table 1); the amounts of glucose added to the fermentation medium with the feeding substrate (CG); and the levels of the two products synthesized by L. lactis CECT 539.
Table 2.
Maximum concentrations of biomass (X) and nisin (Nis) and estimated cost of biomass (X cost) and nisin (Nis cost) production in the batch and realkalized fed-batch fermentations of L. lactis CECT 539 in the DW media. Data corresponding to the realkalized fed-batch process in the DW medium were obtained from Costas et al. [4]
| Culture media | Batch cultures | Realkalized fed-batch cultures | ||||||
|---|---|---|---|---|---|---|---|---|
| X (g/L) | Nis (BU/mL) | X cost (€/g) | Nis cost (€/kBU) | X (g/L) | Nis (BU/mL) | X cost (€/g) | Nis cost (€/kBU) | |
| DW | 0.48 | 22.67 | 0 | 0 | 3.48 | 124.66 | 3.93 | 108.03 |
| DW25 | 0.58 | 28.07 | 1.35 | 26.56 | 4.06 | 148.21 | 2.56 | 70.08 |
| DW50 | 0.62 | 37.00 | 2.52 | 40.29 | 4.31 | 165.68 | 3.15 | 82.02 |
| DW75 | 0.76 | 45.45 | 3.07 | 49.20 | 4.79 | 199.60 | 3.29 | 78.95 |
| DW100 | 0.82 | 57.26 | 3.77 | 52.07 | 5.98 | 258.47 | 3.25 | 75.19 |
| DW125 | 0.83 | 59.23 | 4.63 | 62.92 | – | – | – | – |
The results showed that supplementation of the DW medium with increasing amounts of nutrients produced a slight increase (P < 0.05) in the cost of biomass (€/g) and nisin (€/kBU) production in the batch cultures (Table 2), but the highest costs of biomass and bacteriocin production in the fed-batch fermentations were incurred with the unsupplemented DW medium (P < 0.05).
Discussion
Batch cultures in the DW, DW25, DW50, DW75, DW100, and DW125 media
The different culture pH profiles observed in the batch cultures (upper left part of Fig. 1a) could be related to the different levels of lactic acid production attained (lower left part of Fig. 1a) and the different buffering capacities of the DW media (Fig. 2). Thus, the increasing amounts of nutrients added to the DW substrate stimulated lactic acid production but also led to an increase in the buffering capacity of the different nutrient-supplemented media, which mitigated the decrease in pH and stimulated the growth of L. lactis CECT 539.
The increase in nutrient supplementation also affected biomass and nisin synthesis and nutrient consumption. Thus, the addition of nutrients at fractions above 25% (fermentations in DW50, DW75, DW100, and DW125 media) inhibited biomass production (probably by substrate inhibition) during the first 12 h of incubation (Fig. 1), which coincided with the increase in the buffering capacity of the media (Fig. 2), causing a decrease in the rates of pH decrease. Consequently, nisin synthesis decreased because this bacteriocin is produced as a pH-dependent primary metabolite [14]. However, from 12 h of incubation to the end of the culturing period, the biomass and nisin levels increased as the amounts of nutrients added increased, likely because substrate inhibition decreased gradually as a consequence of nutrient consumption.
In contrast, the increase in nutrient addition (from 25 to 100%) stimulated the utilization of total sugars, proteins, nitrogen, and phosphorus by L. lactis CECT 539 (Fig. 1b). However, the rates of nutrient consumption (rTS, rPr, rNT, and rTP) in each batch culture were also pH-dependent (Fig. 3). In fact, the optimum pH range (from 5.8 to 6.5) for high nutrient utilization by strain CECT 539 was similar to that observed by Poolman and Konings [19] in Streptococcus lactis and S. cremoris strains (between 6.0 and 6.5). This result suggests that the limited nutrient transport caused by the relatively low pH values reached in the corresponding cultures could explain the decrease in biomass production rates observed at the end of the cultures in the DW25, DW50, DW75, DW100, and DW125 media (Fig. 1).
However, considering that these potentially limiting pH values decreased as the initial nutrient concentration in the culture media increased (from 25 to 125%), the observed cessation of growth could also be related to the exhaustion of an essential growth factor (vitamin, mineral, or amino acid) or the low availability of such a growth factor in the media [4, 20]. The results obtained for the series of batch fermentations in DW100 medium adjusted to different initial pH values support this hypothesis because in these experiments, biomass production also stopped at different culture pH values despite relatively high concentrations of TS, TP, TN, and Pr remaining in the media (Fig. 4).
At the initial pH value of 6.0, the culture remained longer within the optimum pH range (between 5.8 and 6.5) for high nutrient consumption than was observed in the previous cultures (see, Figs. 3 and 4a). This longer time spent within that range led to an increase in the levels of TS, TP, TN, and Pr consumed, which stimulated the production of biomass, nisin, and lactic acid. However, maximal nisin production occurred in the culture with an initial pH value of 7.0, in which the greatest final rate of pH decrease was generated (Fig. 4b).
Realkalized fed-batch fermentations in DW25, DW50, DW75, and DW100 media
In the batch cultures, the use of the DW125 medium did not significantly increase (P > 0.05) the biomass and bacteriocin synthesis compared to those obtained in the DW100 medium. For these reasons, the DW25, DW50, DW75, and DW100 media were selected as appropriate fermentation substrates for the realkalized fed-batch fermentations. To improve the utilization of the nutrients added to the DW medium and the nisin yield coefficient (the amount of nisin produced (BU) per mg of nutrients consumed) [7], a mixture of substrates composed of unsupplemented CW medium and a 400-g/L concentrated glucose (CG) was used as a feeding medium in all the realkalized fed-batch cultures.
The decrease in the rpH values observed with the increase in the amount of nutrients added to the DW medium (Fig. 5) could be related to the increase in the buffering capacity (BC) of the DW media (BCDW25 < BCDW50 < BCDW75 < BCDW100) (Fig. 2) because the production of lactic acid also increased with the initial nutrient concentration in the fermentation medium (Fig. 6). Surprisingly, this observed decrease in rpH did not inhibit nisin production because the highest bacteriocin concentration (258.47 BU/mL) was obtained in DW100 medium (Fig. 6). This observation supports the hypothesis that the effect of rpH on nisin synthesis depends on the culture media composition [12].
Thus, the increase in the amount of nutrients added to the DW substrate led to an increase in the initial amounts of bacteriological peptone and yeast and meat extracts (which have growth- and bacteriocin-promoting properties) in the medium. The increased availability of energy sources, vitamins, minerals, amino acids, and peptides in the nutrient-supplemented DW media [11, 21] stimulates the metabolic activity (in terms of nutrient (except lactose) consumption and product formation) of L. lactis CECT 539. For this reason, increased concentrations (P < 0.05) of biomass, nisin, lactic acid, acetic acid, and butane-2,3-diol were obtained in the DW25, DW50, DW75, and DW100 media (Fig. 6) compared with those obtained in the unsupplemented DW medium [3]. However, the nisin-producing strain consumed greater amounts of glucose than of lactose, likely because the presence of the monosaccharide in the fermentation medium represses the expression of the lactose operon in L. lactis [3].
Although nutrient supplementation led to an increase in the initial TS, Pr, TN, and TP concentrations in the four DW media (Table 1), the high nutrient consumption observed in the realkalized fed-batch cultures in the DW75 and DW100 media had a positive effect on COD removal. In addition, the high nutrient availability in the nutrient-supplemented DW media favored the viability of L. lactis CECT 539; consequently, the final viable cell counts obtained in the DW25, DW50, DW75, and DW100 media were higher than 1010 cfu/mL (Fig. 6). These counts were considerably higher than 106 cfu/mL, which is the recommended dose of viable probiotic for which beneficial effects in the host are observed [1, 7].
One reason that could explain the observed shift from homolactic to mixed acid fermentation is the nutrient limitation caused by a low availability of the carbon or nitrogen source in the culture medium, in both batch [22] and realkalized fed-batch fermentations [3, 4]. However, because the four fed-batch cultures were fed a mixture of unsupplemented CW and CG media every 12 h in each realkalization and feeding cycle to bring the cultures up to the initial TS level, relatively high concentrations of glucose and lactose remained in the media (Fig. 6). In contrast, the nitrogen concentration progressively decreased in the four realkalized fed-batch cultures (Fig. 6) due to nitrogen consumption and sample extraction, most likely reaching a limiting level for the growth of L. lactis CECT 539. Nitrogen limitation can stimulate pyruvate dehydrogenase activity and inhibit lactate dehydrogenase activity, reducing the requirements for final fermentation metabolites (e.g., lactate) and increasing the ATP yield [22]. Therefore, the switch from homolactic to mixed acid fermentation appears to be caused by nitrogen limitation rather than by carbon source (glucose and lactose) limitation.
From a kinetics perspective, it should be noted that the wavy profiles exhibited by biomass synthesis and nutrient (Pr, TN, and TP) consumption in previous cultures [3, 4, 7, 8, 14] were also observed in the four realkalized fed-batch cultures in the four nutrient-supplemented DW media (Fig. 6). Thus, the appearance of two growth phases in the previous fed-batch fermentations was related to a biphasic consumption of the nitrogenous compounds [3, 4, 7, 14]. The first phase was characterized by a fast utilization of the most easily assimilable form of the nitrogen source (e.g., free amino acids and oligopeptides) present in the DW medium, whereas the second phase was related to a slow consumption of the nitrogen fraction that is difficult to assimilate [3, 4, 7]. Interestingly, the second growth phase in the realkalized fed-batch cultures in the DW [4], DW25, DW50, DW75, and DW100 media began at 72, 96, 108, 120, and 144 h, respectively (Fig 6). Thus, supplementation of DW medium with increasing concentrations of high-quality nitrogen sources (meat and yeast extracts and bacteriological peptone) led to a higher availability of easily assimilable nitrogen-containing compounds [4, 11] that likely delayed the appearance of the second phase of nitrogen utilization in the supplemented DW media (Fig. 6).
Estimated costs of probiotic biomass and nisin production in the batch and realkalized fed-batch cultures
The estimated costs of probiotic biomass and nisin production in the whey-supplemented media should be taken into account for their large-scale production. The fed-batch culture in the DW100 medium provided the highest biomass and nisin concentrations, and the culture had biomass and bacteriocin production costs that were 0.17 and 0.30 times lower than those incurred by the unsupplemented DW medium (Table 2). These results suggest that the DW100 medium can be used for large-scale production of both products.
Conclusions
The results of this study indicate that the growth and bacteriocin production of L. lactis CECT 539 are regulated by the availability of nutrients in the culture medium. Thus, nutrient supplementation led to a considerable increase in the production of biomass, nisin, and fermentation metabolites (lactic acid, acetic acid, and butane-2,3-diol) with respect to that of control cultures. The high viability (> 1010 cfu/mL) of the probiotic culture obtained in the DW100 medium indicates that this culture can be successfully included in the formulation of an animal feed, thus contributing to the valorization of whey.
Electronic supplementary material
(PDF 117 kb)
Acknowledgments
This work was supported by the Cluster de Investigación y Transferencia Agroalimentaria del Campus del Auga (CITACA), University of Vigo, Spain.
Compliance with ethical standards
Conflict of interest
The authors declare that they have no conflicts of interest.
Footnotes
Highlights
• A concentrated probiotic culture was produced in nutrient-supplemented whey media.
• Probiotic biomass and nisin synthesis depended on nutrient availability.
• Fed-batch cultures reduced the chemical oxygen demand of the media by 31.0–54.2%.
• Fed-batch cultures provided an almost constant biomass and nisin cost in all media.
Publisher’s note
Springer Nature remains neutral with regard to jurisdictional claims in published maps and institutional affiliations.
References
- 1.Guerra NP, Fajardo P, Méndez J, Cachaldora P, Pastrana L. Production of four potentially probiotic lactic acid bacteria and their evaluation as feed additives for weaned piglets. Anim Feed Sci Technol. 2007;134:89–107. doi: 10.1016/j.anifeedsci.2006.05.010. [DOI] [Google Scholar]
- 2.Mollea C, Marmo L, Bosco F. Valorisation of cheese whey, a by-product from the dairy industry. In: Muzzalupo I, editor. Food industry. London: IntechOpen; 2013. pp. 549–588. [Google Scholar]
- 3.Costas M, Alonso E, Guerra NP. Nisin production in realkalized fed-batch cultures in whey with feeding with lactose- or glucose-containing substrates. Appl Microbiol Biotechnol. 2016;100:7899–7908. doi: 10.1007/s00253-016-7558-9. [DOI] [PubMed] [Google Scholar]
- 4.Costas M, Alonso E, Outeiriño D, Fajardo P, Guerra NP. Combination of food wastes for an efficient production of nisin in realkalized fed-batch cultures. Biochem Eng J. 2017;123:13–23. doi: 10.1016/j.bej.2017.03.012. [DOI] [Google Scholar]
- 5.Slavov AK. General characteristics and treatment possibilities of dairy wastewater. A review. Food Technol Biotechnol. 2017;55:14–28. doi: 10.17113/ftb.55.01.17.4520. [DOI] [PMC free article] [PubMed] [Google Scholar]
- 6.Carvalho F, Prazeres AR, Rivas J. Cheese whey wastewater: characterization and treatment. Sci Total Environ. 2013;445–446:385–396. doi: 10.1016/j.scitotenv.2012.12.038. [DOI] [PubMed] [Google Scholar]
- 7.Costas M, Alonso E, Outeiriño D, Guerra NP. Production of a highly concentrated probiotic culture of Lactococcus lactis CECT 539 containing high amounts of nisin. 3-Biotech. 2018;8:292. doi: 10.1007/s13205-018-1318-8. [DOI] [PMC free article] [PubMed] [Google Scholar]
- 8.Fajardo P, Rodríguez I, Pastrana L, Guerra NP. Production of a potentially probiotic culture of Lactobacillus casei subsp. casei CECT 4043 in whey. Int Dairy J. 2008;18:1057–1065. doi: 10.1016/j.idairyj.2008.05.004. [DOI] [Google Scholar]
- 9.Chang Q, Wang W, Regev-Yochay G, Lipsitch M, Hanage WP. Antibiotics in agriculture and the risk to human health: how worried should we be? Evol Appl. 2015;8:240–247. doi: 10.1111/eva.12185. [DOI] [PMC free article] [PubMed] [Google Scholar]
- 10.Asaduzzaman SM, Sonomoto K. Lantibiotics: diverse activities and unique modes of action. J Biosci Bioeng. 2009;107:475–487. doi: 10.1016/j.jbiosc.2009.01.003. [DOI] [PubMed] [Google Scholar]
- 11.Guerra NP, Pastrana L. Modelling the influence of pH on the kinetics of both nisin and pediocin production and characterization of their functional properties. Process Biochem. 2002;37:1005–1015. doi: 10.1016/S0032-9592(01)00312-0. [DOI] [Google Scholar]
- 12.Penna TC, Moraes DA. Optimization of nisin production by Lactococcus lactis. Appl Biochem Biotechnol. 2002;98-100:775–789. doi: 10.1385/ABAB:98-100:1-9:775. [DOI] [PubMed] [Google Scholar]
- 13.González SY, Domínguez J, García BE, Prado LA, Regalado C. Optimization of nisin production by Lactococcus lactis UQ2 using supplemented whey as alternative culture medium. J Food Sci. 2010;75:M347–M353. doi: 10.1111/j.1750-3841.2010.01670.x. [DOI] [PubMed] [Google Scholar]
- 14.Guerra NP, Torrado A, López C, Fajardo P, Pastrana L. Dynamic mathematical models to describe the growth and nisin production by Lactococcus lactis subsp. lactis CECT 539 in both batch and re-alkalized fed-batch cultures. J Food Eng. 2007;82:103–113. doi: 10.1016/j.jfoodeng.2006.11.031. [DOI] [Google Scholar]
- 15.Cabo ML, Murado MA, González MP, Pastoriza L. A method for bacteriocin quantification. J Appl Microbiol. 1999;87:907–914. doi: 10.1046/j.1365-2672.1999.00942.x. [DOI] [PubMed] [Google Scholar]
- 16.Murado MA, Gonzalez MP, Vazquez JA. Dose-response relationships: an overview, a generative model and its application to the verification of descriptive models. Enzym Microb Technol. 2002;31:439–455. doi: 10.1016/S0141-0229(02)00109-6. [DOI] [Google Scholar]
- 17.American Public Health Association (APHA). 2005. Standard methods for the examination of water and wastewater. 21st ed. Washington, DC
- 18.Thomas KC, Hynes SH, Ingledew WM. Influence of medium buffering capacity on inhibition of Saccharomyces cerevisiae growth by acetic and lactic acids. Appl Environ Microbiol. 2002;68:1616–1623. doi: 10.1128/AEM.68.4.1616-1623.2002. [DOI] [PMC free article] [PubMed] [Google Scholar]
- 19.Poolman B, Konings WN. Relation of growth of Streptococcus lactis and Streptococcus cremoris to amino acid transport. J Bacteriol. 1988;170:700–707. doi: 10.1128/JB.170.2.700-707.1988. [DOI] [PMC free article] [PubMed] [Google Scholar]
- 20.Neysens P, Messens W, Gevers D, Swings J, De Vuyst L. Biphasic kinetics of growth and bacteriocin production with Lactobacillus amylovorus DCE 471 occur under stress conditions. Microbiol. 2003;149:1073–1082. doi: 10.1099/mic.0.25880-0. [DOI] [PubMed] [Google Scholar]
- 21.Barrette J, Champagne CP, Goulet J. Growth-promoting properties of yeast extracts produced at different pH values, with different autolysis promoters and bacterial populations. J Chem Technol Biotechnol. 2001;76:203–209. doi: 10.1002/jctb.361. [DOI] [Google Scholar]
- 22.Garrigues C, Loubiere P, Lindley ND, Cocaign-Bousquet M. Control of the shift from homolactic acid to mixed-acid fermentation in Lactococcus lactis: predominant role of the NADH/NAD+ ratio. J Bacteriol. 1997;179:5282–5287. doi: 10.1128/JB.179.17.5282-5287.1997. [DOI] [PMC free article] [PubMed] [Google Scholar]
Associated Data
This section collects any data citations, data availability statements, or supplementary materials included in this article.
Supplementary Materials
(PDF 117 kb)