Abstract
Characterization of ultrasound fields is a routine procedure for both diagnostic and therapeutic ultrasound. Quantitative field mapping with a calibrated hydrophone and multi-axis positioning system can be difficult and time consuming. In this study, the use of acoustic cavitation field mapping as a qualitative surrogate to acoustic pressure field mapping, albeit without acoustic pressure values is demonstrated. This technique allows for fast qualitative mapping of ultrasound fields and thereby functionality of the corresponding transducers, in a matter of seconds. In addition, this technique could be used to rapidly image in vivo acoustic cavitation fields during therapeutic ultrasound applications.
1. Introduction
Accurate mapping of transmitted ultrasound fields is a crucial process in biomedical ultrasound. Diagnostic ultrasound imaging uses a wide range of transmit fields to improve image quality and speed. The emergence of ultrafast imaging1 with plane and diverging wave transmissions has led to novel imaging techniques, such as pulse wave imaging,2 electromechanical wave imaging,3 shear wave elastography,4 functional ultrasound imaging,5 and contrast-enhanced imaging.6 Similarly, the field of therapeutic ultrasound is expanding due to the clinical potential of non-invasive thermal and non-thermal ablation,7,8 acoustic cavitation-mediated drug delivery,9 and ultrasound-mediated neuromodulation.10 A priori knowledge of the transmitted ultrasound field is essential for both diagnostic and therapeutic ultrasound disciplines. It is critical that the transmitted ultrasound field provides adequate insonation of the body during diagnostic imaging and since tissue modification or destruction can occur during therapeutic ultrasound, knowledge of the transmitted ultrasound field is paramount.
Current methodologies use experimental measurements or theoretical simulations to predict the transmitted ultrasound field. The gold standard is using a calibrated hydrophone to sample the acoustic waveform at various points throughout the pressure field. This can then be converted to an acoustic pressure field using the manufacturer's provided calibration factor to convert the measured voltages to pressures. These hydrophones are designed for measuring both diagnostic and therapeutic ultrasound fields, with specific types for each application. Fiber optic hydrophones are designed to withstand the high acoustic pressures used in therapeutic ultrasound, while membrane hydrophones have a wide frequency bandwidth to measure broadband ultrasound pulses used in diagnostic ultrasound.11 Care must be taken to ensure that the hydrophone element is sufficiently small relative to the acoustic wavelength to minimize disturbance of the acoustic field and spatial averaging of the measured pressure.12 Similarly, theoretical simulations can also be performed to simulate the acoustic field with or without input data from the hydrophone.13 In both cases, the process can be difficult and time consuming due to instrumentation, processing time, and user error.
In this study, we demonstrate that acoustic cavitation-enhanced ultrasound imaging can be used as a qualitative surrogate to pressure field mapping. An incident ultrasound wave on a microbubble can cause expansion, contraction, and distortion of the microbubble, i.e., acoustic cavitation and active radiation of secondary acoustic emissions by the microbubble.12 In the case of small microbubble oscillations, the radiation strength of these acoustic waves is proportional to the applied acoustic pressure.14 Therefore, they act as acoustic probes to estimate the relative acoustic pressure throughout an ultrasound field. This technique will be demonstrated with a diagnostic imaging array and therapeutic ultrasound transducer, with both being compared to hydrophone pressure field measurements.
2. Methods
2.1. Transducers
Field mapping was performed with a 2.5-MHz diagnostic imaging array (P4-1, Philips Healthcare, Bothell, WA) and a 0.5-MHz spherically focused transducer (H-204, Sonic Concepts, Bothell, WA). In order to image the acoustic cavitation field of the H-204, a 18-MHz diagnostic imaging array [L22-14v Long Focus (LF), Verasonics Inc., Kirkland, WA] was placed in the central opening of the transducer to perform passive cavitation imaging.15 The geometric focal length of the H-204 was approximately 62 mm and the inner and outer diameters were 41 and 87 mm, respectively. The L22-14v LF was inserted approximately 40 mm into the opening to overlap its elevation focus with the focus of the H-204.
2.2. Acoustic cavitation field mapping
The transducers were partially submerged into a 2-liter tank of degassed, deionized water. Lipid-coated microbubbles (Definity, Lantheous Medical Imaging, North Billerica, MA) were added at a concentration of approximately 50 000 microbubbles/mL and continually mixed with a magnetic stir bar. Contrast-enhanced ultrasound imaging was performed using a research ultrasound system (Vantage 256, Verasonics Inc., Kirkland, WA).
Standard B-mode ultrasound imaging was performed with the P4-1 using plane and focused transmit beams at three different angles (−6°, 0°, 6°) and a diverging transmit beam at one angle (0°). The transmit pulse was 3 cycles and had a peak positive pressure of 600, 840, and 100 kPa for the plane, focused, and diverging transmits, respectively. Passive cavitation imaging of the H-204 focal area was performed using short pulses of focused ultrasound to preserve time of flight information and elicit transient, broadband acoustic emissions from microbubbles.15,16 The FUS transmit pulse was 3 cycles and had a peak positive and negative pressure of 360 kPa. In this imaging mode, the L22-14v LF was operated in receive-only and synchronized with the H-204 transmit. For each acquisition using the P4-1 and H-204, 100 frames of received data were accumulated into the ultrasound system's buffer at 100 frames per second. Upon transfer to the host PC, the received data were saved to the host PC before the start of the next 100 frame acquisition. A total of 100 acquisitions were acquired for a total frame count of 10 000. The received data for each acquisition were reconstructed off-line using a graphics card unit (GPU)-accelerated algorithm using pixel-based delay and sum beamforming within Matlab (The MathWorks, Inc., Natick, MA). The reconstruction time for each 100 frame acquisition was approximately 1 to 2 s. In general, the reconstruction time depends mainly on the number of frames, pixel size, image field of view, and GPU specifications. The pixel size was 0.05 and 0.025 mm in the lateral and axial directions for power cavitation imaging with the L22-14v LF and 0.3 mm in both lateral and axial directions for power cavitation imaging with P4-1. The image field of view was −8 to 8 mm in the lateral direction and 10 to 33 mm in the axial direction for power cavitation imaging with the L22-14v LF and was −30 to 30 mm in the lateral direction and 10 to 80 mm in the axial direction for power cavitation imaging with P4-1. The GPU used for this study was an Nvidia Tesla K40 (NVIDIA, Santa Clara, CA). The time delays used for the P4-1 were calculated geometrically based on plane wave imaging.17 The time delays for the H-204 were approximated as a plane wave within the focal area and the offset between the H-204 and L22-14v LF was taken into account. The frames were processed together to form a single power cavitation image, I(x, z),
| (1) |
where N is the total number of frames and sn(x, z) is the nth-beamformed B-mode or passive cavitation frame. The amplitude envelope of each beamformed frame was taken using a Hilbert transform.
2.3. Field mapping with a hydrophone
Pressure field mapping was performed on the H-204 and P4-1 with a capsule hydrophone (HGL-0200, 200-μm aperture, Onda Corporation, Sunnyvale, CA) connected to a three-axis motorized positioning system (Velmex Inc., Bloomfield, NY). A high-speed digitizer (Dynamic Signals LLC, Lockport, IL) was used to acquire the output of the hydrophone at each point. The output was then converted to pressure using the provided calibration factor by the manufacturer. Measurements were recorded throughout the pressure fields of the H-204 and P4-1 with a step size of 0.1 and 0.5 mm in the lateral and axial directions, respectively. The total scan times were approximately 30 min on average. The final pressure field image was resampled to the same pixel resolution as the passive cavitation images, which was 0.05 and 0.025 mm in the lateral and axial directions for power cavitation imaging with the L22-14v LF and 0.3 mm in both lateral and axial directions for power cavitation imaging with P4-1. Hydrophone measurements were only made on 0° planes and focused wave transmissions with the P4-1. For a comparison of pressure field and power cavitation images, the images were manually aligned for measurement of the full-width-half-max (FWHM) values of the acoustic field. It should be noted that the z-axes were different for each image, thus the need for image alignment prior to quantitative comparison.
3. Results and discussion
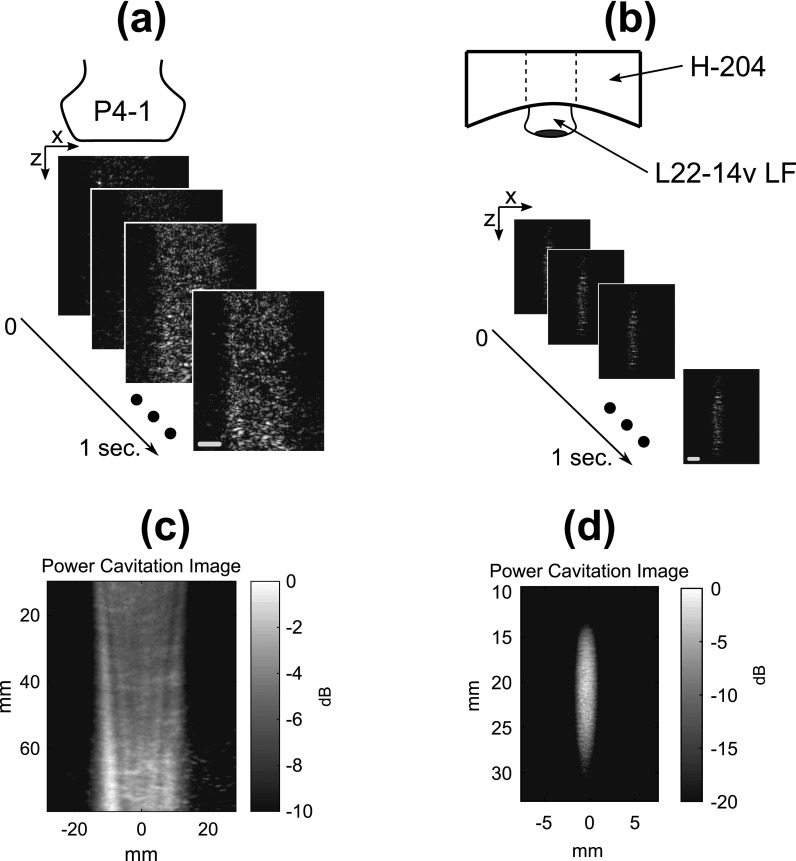
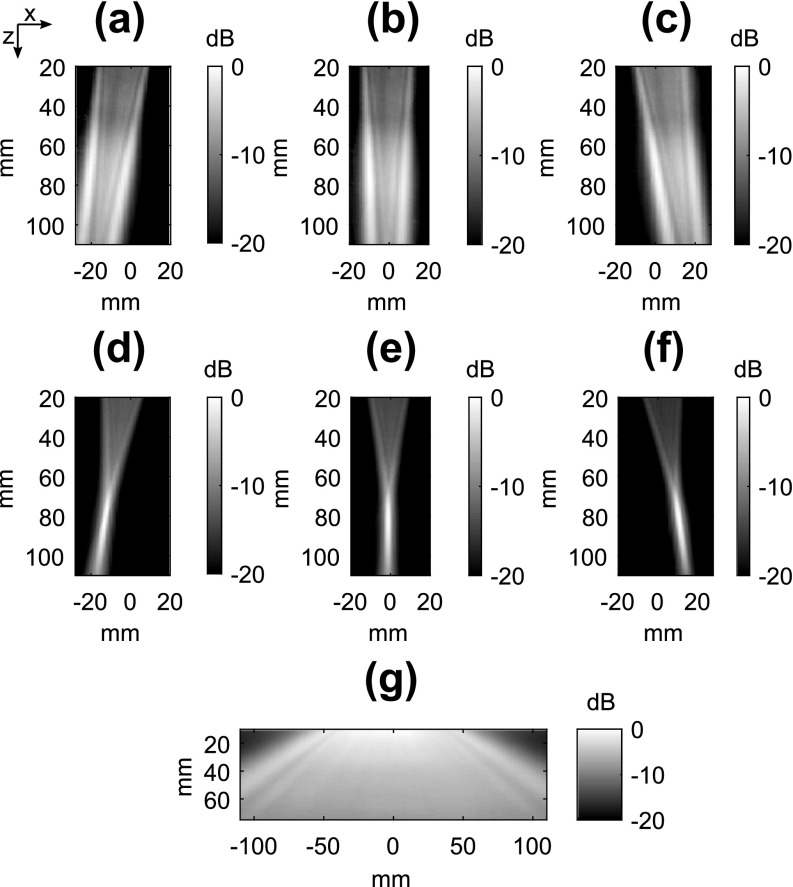
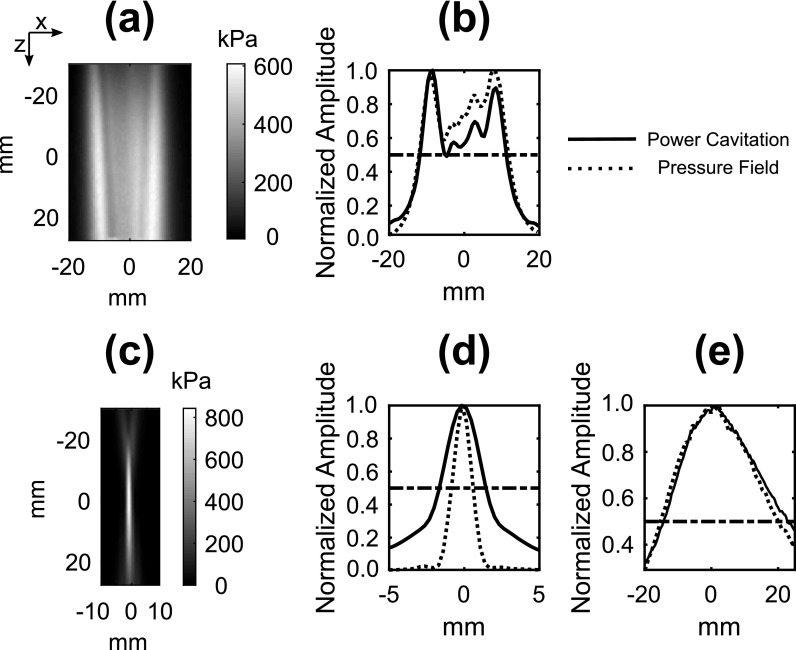
The concept of field mapping with contrast-enhanced ultrasound imaging in shown in Fig. 1. High-frame rate (100 Hz) imaging of acoustic cavitation was performed during continuous mixing of microbubbles in a water bath. As shown in Figs. 1(c) and 1(d), the power cavitation images compiled from a 1 s (100 frames) were able to resolve the beam pattern of the P4-1 and H-204. Extending the amount of acquisitions to 10 000 frames further improved the power cavitation image quality as shown in Fig. 2. The technique was performed using plane wave [Figs. 2(a)–2(c)] and focused wave [Figs. 2(d)–2(f)] transmits at steering angles of −6°, 0°, and 6°, and a diverging wave transmit [Fig. 2(g)]. A representative video showing the calculation of a single power cavitation image from 0° plane wave transmits is shown in Mm. 1. As the total number of frames increases within the power cavitation image calculation, the complex beam pattern of the transmit field is slowly resolved over time. Each acoustic cavitation source (i.e., microbubble) essentially samples the transmit field over subsequent frames. If we assume that the same number of microbubbles was sampled at each position within the ultrasound field, the intensity of the power cavitation images is related to the acoustic radiation strength of the microbubbles. In the case of small microbubble oscillations, it has been shown that the microbubble will radiate sound with amplitude proportional to the applied acoustic pressure.14 Hence, the power cavitation image intensity can be directly linked to the acoustic pressure. While the higher acoustic pressures used in this study, especially for the focused transmit, could initiate larger, non-linear microbubble oscillations, we feel that this would still contribute to an overall increase in the power cavitation image intensity and be proportional to the applied acoustic pressure. Figure 3 compares the hydrophone pressure field mapping of the P4-1 with power cavitation imaging for 0° plane and focused wave transmits at a depth of 8 cm. A good agreement can be seen between the two mapping techniques for both transmission types. For the 0° plane wave transmission, the lateral FWHM value with hydrophone pressure field mapping was 23.8 mm and with power cavitation imaging it was 23.0 mm. For the 0° focused wave transmission, the FWHM values with hydrophone pressure field mapping were 1.5 and 35.6 mm in the lateral and axial directions, respectively. The FWHM values with power cavitation imaging were 3.1 and 37.1 mm in the lateral and axial directions, respectively. The poor agreement between the lateral FWHM values for the two techniques may be attributed to the poor lateral resolution of the contrast-enhanced B-mode imaging at a depth of 8 cm and warrants future investigation.
Fig. 1.
Methodology for performing contrast-enhanced ultrasound imaging of the (a) P4-1 imaging array and (b) H-204 therapeutic ultrasound transducer pressure fields. Standard B-mode imaging transmits (i.e., plane, focused, and diverging) were used with the P4-1, while passive cavitation imaging with a 18-MHz imaging probe (L22-14v LF) was used to map the pressure field of the H-204. Individual frames were captured at a rate of 100 frames per second for a duration of 1 s. The resultant mean intensity images (i.e., power cavitation images) are shown for plane wave transmit with the P4-1 (c) and focused transmit with the H-204 (d). The scale bar on (a) represents 20 mm and the scale bar on (b) represents 5 mm.
Fig. 2.
Power cavitation images captured with the P4-1 using plane waves [(a)–(c)], focused waves [(d)–(f)], and a diverging wave (g). The transmit angle was varied from −6°, 0°, and 6° for the plane and focused wave transmits. Each power cavitation image is calculated from a total of 10 000 individual frames. The transmit pulse was 3 cycles and had a peak positive pressure of 600, 840, and 100 kPa for the plane, focused, and diverging transmits, respectively.
Fig. 3.
(a) Measured hydrophone pressure field of a 0° plane wave transmit using the P4-1. (b) A comparison of the power cavitation image and hydrophone pressure field image along the lateral direction for the plane wave transmit. (c) Measured pressure field of a 0° focused wave transmit using the P4-1. A comparison of the power cavitation image and pressure field image along the lateral (d) and axial (e) direction for the focused wave transmit. The horizontal dotted line represents the half max value. The transmit pulse was 3 cycles and had a peak positive pressure of 600 and 840 kPa for the plane and focused transmits, respectively. The comparison of the lateral and axial transmit profiles was carried out at a depth of 8 cm from the imaging array.
Mm. 1.
Accumulation of image frames for power cavitation image calculation. This is a file of type AVI (3.5 Mb).
A slightly different approach was taken to map the acoustic cavitation field of the single-element H-204 focused ultrasound transducer. A contrast-enhanced ultrasound imaging technique based on the detection of non-linear, broadband acoustic cavitation emissions was used to image the microbubble sources.16,18 This technique utilizes the ability of microbubbles to emit high frequency acoustic emissions while being insonified with a lower frequency ultrasound pulse. The short focused ultrasound pulse elicits a transient response from the microbubble, where the microbubble grows to some maximum radius, Rmax, and then collapses due to the in-rushing fluid surrounding the microbubble. Upon collapse to some minimum radius, a shock wave is emitted that acts as a broadband acoustic source that can be detected by the high frequency imaging array. The radiated sound by the microbubble, Ps(r, t), can be described by the following equation:
| (2) |
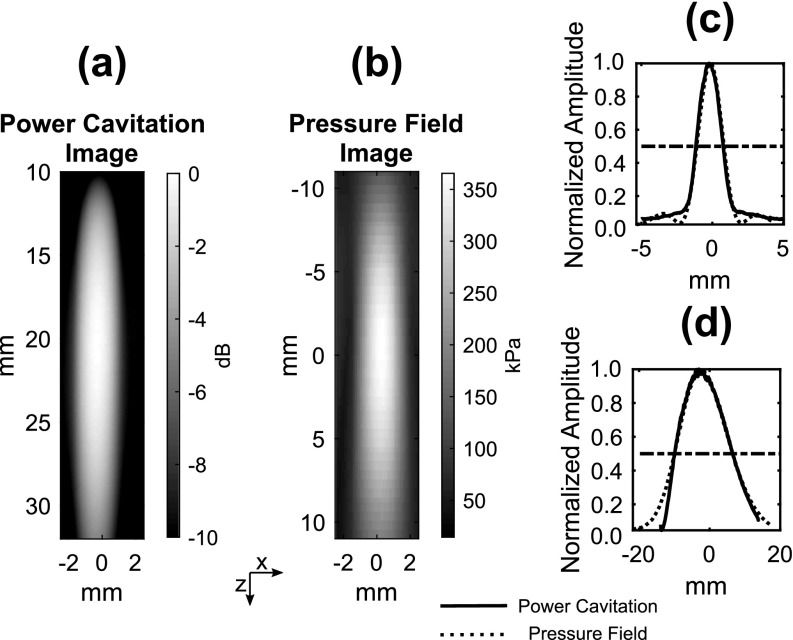
where ρl is the liquid density, r is the observation distance, and R(t), are the radial position, velocity, and acceleration of the microbubble wall.19 During the microbubble collapse, the emitted sound is generated by the deceleration of the microbubble wall as it reaches its minimum radius. The intensity of the energy release upon collapse is mainly linked to the Rmax of the microbubble before collapse, which relates to the amount of energy stored in the liquid.20 Since Rmax is dependent on the acoustic frequency and pressure, increasing the pressure at a fixed frequency leads to larger Rmax values and subsequently more intense collapses. As shown in Fig. 4, the power cavitation image and pressure field image of the H-204 display excellent agreement. The FWHM values of the focal area using power cavitation imaging were 2.4 and 16.4 mm in the lateral and axial directions, respectively. Similarly, the FWHM values measured with hydrophone pressure field mapping were 1.9 and 16.5 mm in the lateral and axial directions, respectively. This agreement links the power cavitation image intensity to the applied acoustic pressure. If we again assume that the same number of microbubbles were sampled at each position within the ultrasound field, the intensity of the power cavitation images is related to the acoustic radiation strength of the microbubbles (i.e., collapse strength).
Fig. 4.
A comparison of the power cavitation image (a) and the measured hydrophone pressure field (b) of the H-204. The lateral (c) and axial (d) profiles of the beam. The horizontal dotted line represents the half max value. The FUS transmit pulse was 3 cycles and had a peak positive and negative pressure of 360 kPa.
The ability to perform fast mapping of transmitted ultrasound fields could serve as a unique measurement tool for custom transmit beam patterns and verification of transducer output. While it is not meant to replace pressure mapping with a hydrophone, the reduced time and effort could allow rapid testing of different transmit schemes and confirm functionality in real time. Additionally, other unique techniques are under development to measure focused ultrasound fields using scattering from acoustic cavitation and tissue.21,22 The microbubble concentration is a critical factor that determines the overall speed of this technique. There needs to be a high enough concentration from adequate sampling of the acoustic field to occur in a rapid manner, but not too high as to cause acoustic shielding of the acoustic wave propagation into deeper regions. The main limitation of this technique stems from its inability to resolve the absolute acoustic pressure of the transmitted ultrasound field. This study was also limited to two-dimensional (2D) mapping, extension to three-dimensional mapping may be possible with the use of hemispherical arrays,23 2D matrix arrays,24 and mechanical translation of one-dimensional arrays.25 Apart from being a useful in vitro tool, measuring in vivo acoustic cavitation fields may be beneficial for predicting acoustic cavitation-related bioeffects during contrast-enhanced ultrasound imaging or for image-guided therapies that utilize acoustic cavitation. This is especially important for the contrast-enhanced ultrasound imaging technique used for this study, where microbubbles were excited with short pulses to elicit transient (i.e., inertial) cavitation. This mode of acoustic cavitation requires careful monitoring to limit unwanted bioeffects, which could be achieved through power cavitation-guided imaging.
4. Conclusion
Cavitation-enhanced field mapping is capable of resolving the diffraction patterns of ultrasound transducers qualitatively. The transmitted fields of a diagnostic imaging array and single-element therapeutic ultrasound transducer were measured in a matter of seconds. This technique could prove useful for measuring custom transmit sequences, troubleshooting ultrasound systems, and for predicting acoustic cavitation-related bioeffects.
Acknowledgments
This research was supported by the National Institutes of Health (NIH) Grant Nos. R01AG038961 and R01EB009041.
Contributor Information
Mark T. Burgess, Email: .
Elisa E. Konofagou, Email: .
References and links
- 1. Tanter M. and Fink M., “ Ultrafast imaging in biomedical ultrasound,” IEEE Trans. Ultrason. Ferroelectr. Freq. Control 61(1), 102–119 (2014). 10.1109/TUFFC.2014.2882 [DOI] [PubMed] [Google Scholar]
- 2. Vappou J., Luo J., and Konofagou E., “ Pulse wave imaging for noninvasive and quantitative measurement of arterial stiffness in vivo,” Am. J. Hypertens. 23(4), 393–398 (2010). 10.1038/ajh.2009.272 [DOI] [PMC free article] [PubMed] [Google Scholar]
- 3. Provost J., Nguyen V., Legrand D., Okrasinski S., Costet A., Gambhir A., Garan H., and Konofagou E., “ Electromechanical wave imaging for arrhythmias,” Phys. Med. Biol. 56, L1–L11 (2011). 10.1088/0031-9155/56/22/F01 [DOI] [PMC free article] [PubMed] [Google Scholar]
- 4. Tanter M., Bercoff J., Sandrin L., and Fink M., “ Ultrafast compound imaging for 2-D motion vector estimation: Application to transient elastography,” IEEE Trans. Ultrason. Ferroelectr. Freq. Control 49(10), 1363–1374 (2002). 10.1109/TUFFC.2002.1041078 [DOI] [PubMed] [Google Scholar]
- 5. Mace E., Montaldo G., Cohen I., Baulac M., Fink M., and Tanter M., “ Functional ultrasound imaging of the brain,” Nat. Methods 8(8), 662–664 (2011). 10.1038/nmeth.1641 [DOI] [PubMed] [Google Scholar]
- 6. Couture O., Bannouf S., Montaldo G., Aubry J., and Fink M., “ Ultrafast imaging of ultrasound contrast agents,” Ultrasound Med. Biol. 35(11), 1908–1916 (2009). 10.1016/j.ultrasmedbio.2009.05.020 [DOI] [PubMed] [Google Scholar]
- 7. Jolesz F., Hynynen K., McDannold N., and Tempany C., “ MR imaging-controlled focused ultrasound ablation: A noninvasive image-guided surgery,” Magn. Reson. Imaging Clin. N. Am. 13(3), 545–560 (2005). 10.1016/j.mric.2005.04.008 [DOI] [PubMed] [Google Scholar]
- 8. Arvanitis C., Vykhodteseva N., Jolesz F., Livingstone M., and McDannold N., “ Cavitation-enhanced nonthermal ablation in deep brain targets: Feasibility in a large animal model,” J. Neurosurg. 124, 1450–1459 (2016). 10.3171/2015.4.JNS142862 [DOI] [PMC free article] [PubMed] [Google Scholar]
- 9. Hynynen K., “ Ultrasound for drug and gene delivery to the brain,” Adv. Drug Deliv. Rev. 60(10), 1209–1217 (2008). 10.1016/j.addr.2008.03.010 [DOI] [PMC free article] [PubMed] [Google Scholar]
- 10. Munoz F., Aurop C., Konofagou E., and Ferrera V., “ Modulation of brain function and behavior by focused ultrasound,” Curr. Behav. Neurosci. Rep. 5(2), 153–164 (2018). 10.1007/s40473-018-0156-7 [DOI] [PMC free article] [PubMed] [Google Scholar]
- 11.Onda Corporation, Hydrophone Handbook (2015).
- 12. Leighton T., The Acoustic Bubble ( Academic Press, Cambridge, MA, 1994). [Google Scholar]
- 13. Clement G. and Hynynen K., “ Field characterization of therapeutic ultrasound phased arrays through forward and backward planar projection,” J. Acoust. Soc. Am. 108(1), 441–449 (2000). 10.1121/1.429477 [DOI] [PubMed] [Google Scholar]
- 14. Strasberg M., “ Gas bubbles as sources of sound in liquids,” J. Acoust. Soc. Am. 28(1), 20–26 (1956). 10.1121/1.1908212 [DOI] [Google Scholar]
- 15. Burgess M., Apostolakis I., and Konofagou E., “ Power cavitation-guided blood-brain barrier opening with focused ultrasound and microbubbles,” Phys. Med. Biol. 63(6), 065009 (2018). 10.1088/1361-6560/aab05c [DOI] [PMC free article] [PubMed] [Google Scholar]
- 16. Kruse D. and Ferrara K., “ A new imaging strategy using wideband transient response of ultrasound contrast agents,” IEEE Trans. Ultrason. Ferroelectr. Freq. Control 52(8), 1320–1329 (2005). 10.1109/TUFFC.2005.1509790 [DOI] [PMC free article] [PubMed] [Google Scholar]
- 17. Montaldo G., Tanter M., Bercoff J., Benech N., and Fink M., “ Coherent plane-wave compounding for very high frame rate ultrasonography and transient elastography,” IEEE Trans. Ultrason. Ferroelectr. Freq. Control 56(3), 489–506 (2009). 10.1109/TUFFC.2009.1067 [DOI] [PubMed] [Google Scholar]
- 18. Gateau J., Aubry J., Pernot M., Fink M., and Tanter M., “ Combined passive detection and ultrafast active imaging of cavitation events induced by short pulses of high-intensity ultrasound,” IEEE Trans. Ultrason. Ferroelectr. Freq. Control 58(3), 517–532 (2011). 10.1109/TUFFC.2011.1836 [DOI] [PMC free article] [PubMed] [Google Scholar]
- 19. Hilgenfeldt S., Lohse D., and Zomack M., “ Response of bubbles to diagnostic ultrasound: A unifying theoretical approach,” Eur. Phys. J. B. 4(2), 247–255 (1998). 10.1007/s100510050375 [DOI] [Google Scholar]
- 20. Apfel R., “ Acoustic cavitation prediction,” J. Acoust. Soc. Am. 69(6), 1624–1633 (1981). 10.1121/1.385939 [DOI] [Google Scholar]
- 21. Ding T., Zhang S., Fu Q., Xu Z., and Wan M., “ Ultrasound line-by-line scanning method of spatial-temporal active cavitation mapping for high-intensity focused ultrasound,” Ultrasonics 54, 147–155 (2014). 10.1016/j.ultras.2013.04.011 [DOI] [PubMed] [Google Scholar]
- 22. Trong N., Do M., and Oelze M., “ Visualization of the intensity field of a focused ultrasound source in situ,” IEEE Trans. Med. Imaging 38(1), 124–133 (2019). 10.1109/TMI.2018.2857481 [DOI] [PMC free article] [PubMed] [Google Scholar]
- 23. O'Reilly M., Jones R., and Hynynen K., “ Three-dimensional transcranial ultrasound imaging of microbubbles clouds using a sparse hemispherical array,” IEEE Trans. Biomed. Eng. 61(4), 1285–1294 (2014). 10.1109/TBME.2014.2300838 [DOI] [PMC free article] [PubMed] [Google Scholar]
- 24. Provost J., Papadacci C., Arango J., Imbault M., Fink M., Gennisson J., Tanter M., and Pernot M., “ 3D ultrafast ultrasound imaging in vivo,” Phys. Med. Biol. 59, L1–L13 (2014). 10.1088/0031-9155/59/19/L1 [DOI] [PMC free article] [PubMed] [Google Scholar]
- 25. Demene C., Tiran E., Sieu L., Bergel A., Gennisson J., Pernot M., Deffieux T., Cohen I., and Tanter M., “ 4D microvascular imaging based on ultrafast Doppler tomography,” Neuroimage 127, 472–483 (2016). 10.1016/j.neuroimage.2015.11.014 [DOI] [PubMed] [Google Scholar]


