

Abstract
In healthy individuals, plasma glucose levels are maintained within a normal range. During fasting, endogenous glucose is released either through glycogenolysis or gluconeogenesis. Gluconeogenesis involves the formation of glucose-6-phosphate from a variety of precursors followed by its subsequent hydrolysis to glucose. Gluconeogenesis occurs in the liver and the kidney. In order to compare gluconeogenesis in canine liver and kidney, the activity and expression of the rate limiting enzymes that catalyze the fructose-6-phosphate and fructose 1,6-bisphosphate steps, namely, phosphofructokinase-1 (PFK-1) (glycolysis) and fructose bisphosphatase-1 (FBP-1) (gluconeogenesis), were examined. Healthy male and female beagle dogs aged 1–2 years were euthanized humanely, and samples of their liver and kidney were obtained for analysis. The levels of PFK-1 and FBP-1 in canine liver and kidney were assessed by enzymatic assays, Western blotting, and RT-qPCR. Enzyme assays showed that, in dogs, the kidney had higher specific activity of PFK-1 and FBP-1 than the liver. Western blotting and RT-qPCR data demonstrated that of the three different subunits (PFK-M, PFK-L, and PFK-P) the PFK-1 in canine liver mainly comprised PFK-L, whereas the PFK-1 in the canine kidney comprised all three subunits. As a result of these differences in the subunit composition of PFK-1, glucose metabolism might be regulated differently in the liver and kidney.
Keywords: fructose bisphosphatase-1, gluconeogenesis, glycolysis, phosphofructokinase-1
The maintenance of normal plasma glucose levels is vital to supply a constant source of energy to all organs, especially the brain. Plasma glucose levels are kept within the normal range in healthy individuals via the regulation of dietary glucose absorption, renal glucose reabsorption, and endogenous glucose production. During times of fasting, glucose is produced endogenously to maintain plasma levels by two methods, namely, glycogenolysis and gluconeogenesis [4, 13, 14]. Glycogenolysis involves the breakdown of glycogen stores to release glucose-6-phosphate (G-6-P) which is then subsequently hydrolyzed to glucose by glucose-6-phosphatase. Gluconeogenesis involves the formation of G-6-P from a variety of precursors such as lactate, glycerol, and amino acids, with its subsequent hydrolysis by glucose-6-phosphatase to glucose. Only the liver and kidney have sufficient gluconeogenic enzyme activity to contribute to the synthesis of significant amounts of glucose [18].
The liver plays a pivotal role in the regulation of blood glucose homeostasis. Following a meal, ingested nutrients are absorbed from the gastrointestinal tract into the portal vein, and pass through the liver before entering the systemic circulation. The liver absorbs and stores a large fraction of ingested glucose, while simultaneously reducing its release back into the circulation. Conversely, when nutrients are not absorbed from the gastrointestinal tract, endogenous glucose production, including glycogenolysis and gluconeogenesis, in the liver is increased to prevent hypoglycemia [23]. However, some diseases such as hepatocellular carcinoma, which is common in dogs, can cause hypoglycemia as a paraneoplastic syndrome. In human medicine, paraneoplastic syndromes in hepatocellular carcinoma are not uncommon, with one of the most important ones being hypoglycemia, which is found in 4 to 27% of patients [24, 28].
The kidney plays a prominent role in the production of urine via filtration, reabsorption, secretion, and excretion, but also has a function in gluconeogenesis. The first study addressing gluconeogenesis in kidney was reported by Benoy and Elliot [3], who showed that endogenous glucose produced in the kidney flows directly into the bloodstream [26]. Renal glucose production is thought to be principally due to gluconeogenesis, and not to glycogenolysis [15]. The proximal tubule is the only part of the kidney that expresses the appropriate enzymes required for gluconeogenesis [18]. Compared with the liver, renal gluconeogenesis can adapt to various stimuli, including fasting, hypoglycemia, and diabetes, and differs in its affinity for certain substrates and its response to physiological and pathological stimuli [19]. It is also conceivable that an acceleration of renal gluconeogenesis may be one of the pathophysiological mechanisms underlying the uncontrolled hyperglycemia seen human diabetes [15].
There are three rate controlling steps in glycolysis and gluconeogenesis, namely, between glucose and G-6-P, fructose-6-phosphate (F-6-P) and fructose 1,6-bisphosphate (F-1,6-P2), and phosphoenolpyruvate and pyruvate. The counter-opposing reactions that lie between F-6-P and F-1,6-P2, as key regulatory steps in both glycolysis and gluconeogenesis, are catalyzed by phosphofructokinase-1 (PFK-1, EC:2.7.1.11) and fructose bisphosphatase-1 (FBP-1, EC:3.1.3.1), respectively. Specifically, in the glycolytic pathway, PFK-1 catalyzes the phosphorylation of F-6-P to F-1,6-P2 using adenosine triphosphate (ATP), whereas in the gluconeogenic pathway FBP-1 catalyzes the splitting of F-1,6-P2 into F-6-P and inorganic phosphate.
While the plasma glucose concentration is mainly regulated in the liver, the kidney also contributes to glucose homeostasis through gluconeogenesis, glucose reabsorption, and glucose uptake, ultimately accounting for a part of glucose production [19]. However, our knowledge of renal gluconeogenesis is limited, and there are few studies that have examined glucose metabolism in the kidney, especially in the canine kidney. In this study, we attempted to analyze PFK-1 and FBP-1 levels in the liver and kidney in order to gain a greater understanding of glucose metabolism in dogs. This study provides useful fundamental information for clinical veterinary medicine in dogs.
MATERIALS AND METHODS
Materials
The chemicals and reagents used in this study were obtained from Wako Pure Chemicals (Osaka, Japan) and Sigma-Aldrich (St. Louis, MO, U.S.A.). Adenosine monophosphate (AMP), aldolase (EC: 4.1.2.13), glycerol 3-phosphate dehydrogenase (GDH, EC: 1.1.1.8), and glucose-6-phosphate dehydrogenase (G6PD, EC: 1.1.1.49) were purchased from Wako Pure Chemicals. ATP, F-6-P, F-1,6-P2, nicotinamide adenine dinucleotide (NAD), nicotinamide adenine dinucleotide phosphate (NADP), triosephosphate isomerase (TPI, EC: 5.3.1.1), and phosphoglucose isomerase (PGI, EC: 5.3.1.9) were purchased from Sigma-Aldrich.
Animals
Beagles (2 males and 2 females, 1 or 2 years old) were housed in adequately sized cages under a 12 hr dark-light cycle (light from 06:00 to 18:00) in an air-conditioned environment. They were fed commercial dry food and had free access to water. All dogs were euthanized with administration of sodium pentobarbital (150 mg/kg body weight) as the endpoint of unrelated projects approved by the Nihon University Animal Care and Use Committee. This study protocol was approved by the Nihon University Animal Care and Use Committee (permission number: AP13B074-1). The biopsy samples of liver and kidney were obtained after humane euthanasia, and stored at −80°C until extraction.
Preparation of crude cytosolic extract from liver and kidney
All the purification steps were carried out at 4°C. Liver and kidney (300 mg each), resected using scissors, were dissolved in 50 mM Tris-phosphate buffer (pH 8) including 10 mM dithiothreitol (DTT) and homogenized with a pellet mixer. The homogenate obtained was centrifuged at 100,000 × g for 30 min. The supernatant was loaded onto a gel filtration column (PD-10, GE Healthcare, Chicago, IL, U.S.A.) and chromatography was performed to remove allosteric effectors of PFK-1. The solution obtained after gel filtration chromatography was used as the cytosolic fraction, and the protein concentration was determined using the Bradford method [6], with bovine serum albumin as the standard.
PFK-1 assay
The PFK-1 activity assay was conducted under optimal conditions in the absence of regulatory factors, as previously reported [12]. The enzyme reaction was initiated by adding the cytosolic fraction containing the enzyme at 25°C, and the rate of NADH oxidation was monitored at 340 nm using a spectrophotometer (U-2900, Hitachi High-Technologies Corp., Tokyo, Japan). PFK-1 activity was determined in a reaction mixture containing the following components in a final volume of 1 ml: 50 mM HEPES buffer (pH 8.2), 100 mM KCl, 6.5 mM MgCl2, 1 mM NH4Cl, 5 mM KH2PO4, 0.3 mM NADH, aldolase (0.5 units [U]), GDH (0.5 U), TPI (5 U), 1 mM F-6-P, 5 mM ATP, and 0.1 mM AMP. One unit of PFK-1 activity was defined as the amount of enzyme that phosphorylated 1 µmol of F-6-P per min at 25°C.
FBP-1 assay
FBP-1 activity was assayed spectrophotometrically by the addition of the cytosolic fraction at 25°C, and the rate of NADP reduction was monitored at 340 nm using a spectrophotometer U-2900 [25]. The incubation mixture contained 100 mM KCl, 5 mM EGTA, 1 mM MgSO4, 1 mM NH4Cl, 0.5 mM NADP, 50 mM HEPES buffer (pH 7.4), G6PD (5 U), PGI (10 U), and 0.2 mM F-1,6-P2 in a final volume of 1 ml. One unit of FBP-1 activity corresponds to the hydrolysis of 1 µmol of F-1,6-P2 per min.
Western blotting
Western blotting was performed using the cytosolic fraction. Samples were boiled at 95°C for 5 min in SDS sample buffer (Red Loading Buffer, New England Biolabs, Ipswich, MA, U.S.A.). Equal units (0.3 mU) of PFK-1 activity present in the unpurified cytosolic protein samples obtained from various organs were loaded in each lane of a 7.5% polyacrylamide gels (Mini-PROTEAN TGX gel, Bio-Rad Laboratories, Hercules, CA, U.S.A.) and separated by electrophoresis. The separated proteins were then transferred to polyvinylidene difluoride membranes, and treated with blocking reagent (Block Ace, DS Pharma Biomedical, Osaka, Japan) for 50 min. Thereafter, the membranes were incubated for 120 min with primary rabbit monoclonal antibodies (Abcam, Cambridge, U.K.) against PFK-M (ab154804, 1:1,000), PFK-L (ab181064, 1:500), PFK-P (ab204131, 1:1,000), and FBP-1 (ab109732, 1:1,000). After washing, the membranes were incubated with ECL Anti-Rabbit IgG, Horseradish Peroxidase Linked Whole Antibody from donkey (GE Healthcare, 1:10,000) for 90 min. Immunoreactivity was detected with chemiluminescence (ECL Western blotting Analysis System, GE Healthcare). The chemiluminescent signals of the membranes were measured, and densitometric analyses were performed using a chilled CCD camera (ImageQuant LAS 4000 mini, GE Healthcare).
Reverse transcription-quantitative real-time PCR (RT-qPCR)
Total RNA was extracted from the samples of liver and kidney using an RNA isolation kit (RNeasy Mini Kit, Qiagen, Hilden, Germany) according to the manufacturer’s instructions. The extracted total RNA was verified to have the appropriate quality for use in experiments (Experion™ Automated Electrophoresis System, and Experion™ RNA StdSens Analysis kit, Bio-Rad Laboratories). Following this, first-strand cDNA synthesis was performed using 500 ng of total RNA with a reverse transcription reagent kit (PrimeScript RT Master Mix, Takara Bio Inc., Kusatsu, Japan). Quantitative PCR (qPCR) assays were performed using 2 µl of the first-strand cDNA in a 25 µl total reaction volume (SYBR Premix Ex Taq™ II, Takara Bio Inc.). The primers used in this study (Table 1) were purchased from Takara Bio Inc., PCR reactions were conducted using a thermal cycler (Thermal Cycler Dice® Real Time System II TP900, Takara Bio Inc.), and involved denaturation at 95°C for 5 sec and annealing and extension at 60°C for 30 sec. Upon analysis of the amplicons, we confirmed that they showed a single peak and a single band in the dissociation curve and by agarose gel electrophoresis. The primers for RPS18 and PFK-1 subunits displayed PCR amplification efficiencies within the appropriate ranges for quantification in our previous study [16]. In the present study, we calculated the PCR amplification efficiency of FBP-1 from the slope of the standard curve generated using serially diluted cDNA and confirmed appropriate for quantification. qPCR results were analyzed using the second derivative method and the comparative cycle threshold method using the software (Thermal Cycler Dice® Real Time System Software Ver.5.11B, Takara Bio Inc.). Housekeeping genes were evaluated based on the standard deviation of the cycle threshold for GAPDH, ACTB, RPS18, and TBP using the BestKeeper software [21, 22], with the values for GAPDH, ACTB, RPS18, and TBP being 1.15, 1.43, 0.69, and 1.34, respectively. As a result, the relative mRNA expression levels of the target genes were calculated based on the expression of RPS18.
Table 1. Primer sequences used in the quantitative PCR assays.
| Symbol | GenBank accession no. | Primer sequences 5′ to 3′ | Length (bp) |
|---|---|---|---|
| RPS18 | NM_001048082.1 | F: ATAGCCTTTGCCATCACAGCAATTA | 86 |
| R: TTGGTGAGATCGATGTCTGCTTTC | |||
| PFK-M | NM_001003199.1 | F: GCTGACACAGCCCTCAACACTATC | 109 |
| R: CGCAGTAGCCACCCATAGTTTC | |||
| PFK-L | XM_544922.6 | F: AGACCTGAAAGCCAACGTGGAG | 173 |
| R: GGCCCAGAACGTTGGTCCTA | |||
| PFK-P | XM_005617183.3 | F: GTCCAACGTGGAGCACCTGA | 122 |
| R: CCTCGGAGTACAGCTGGTAGATGAA | |||
| FBP-1 | XM_843213.3 | F: CGCAATCATAGTAGAGCCCGAGA | 95 |
| R: CAATGGATGCAAGGCAGTCAA | |||
RESULTS
PFK-1 assay
The PFK-1 activities in the cytosolic fractions devoid of almost all the regulators of PFK-1 activity were normalized to protein concentration (Fig. 1). The PFK-1 activities of liver and kidney were 0.038 ± 0.0078 U/mg protein (mean ± SEM) and 0.117 ± 0.0230 U/mg protein, respectively.
Fig. 1.

Phosphofructokinase-1 (PFK-1) activity in the cytosolic fractions from the liver and kidney of dogs. Values were normalized to protein concentration and are shown as the mean ± SEM of four independent experiments.
FBP-1 assay
The FBP-1 activity in the cytosolic fractions were also normalized to protein concentration (Fig. 2). The FBP-1 activities of liver and kidney were 0.057 ± 0.0132 U/mg protein (mean ± SEM) and 0.121 ± 0.0129 U/mg protein, respectively.
Fig. 2.

Fructose bisphosphatase-1 (FBP-1) activity in the cytosolic fractions from the liver and kidney of dogs. Values were normalized to protein concentration, and are shown as the mean ± SEM of four independent experiments.
Western blotting
The results of Western blotting are shown in Fig. 3. Using the same units of PFK-1 activity, blotting with the anti-PFK-P antibody revealed a pale band in the liver and a darker band in the kidney. Blotting with the anti-PFK-M antibody showed no band in the liver and a single band in the kidney. Single bands were detected in both the liver and kidney using the anti-PFK-L antibody. Finally, blotting with the anti-FBP-1 antibody revealed a band in the liver and a slightly darker band in the kidney.
Fig. 3.
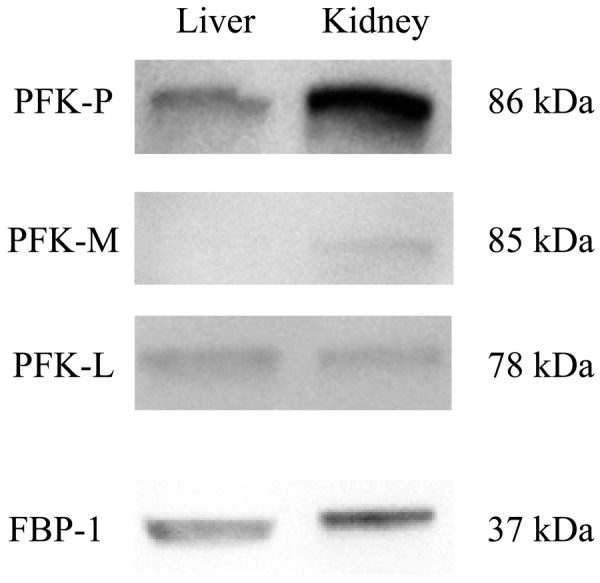
Western blotting of phosphofructokinase-1 (PFK-1) subunits and fructose bisphosphatase-1 (FBP-1) in canine liver and kidney. The respective PFK-1 subunits and FBP-1 were detected by Western blotting using primary antibodies against PFK-P, PFK-M, PFK-L, and FBP-1. Representative results from four independent experiments are shown.
RT-qPCR
Upon analysis of the amplicons, we confirmed that they showed a single band by agarose gel electrophoresis and had a single peak in the dissociation curve (Fig. 4). An analysis of the PCR amplification efficiency indicated that primers for RPS18 produced almost identical amounts of amplicon in the cDNAs from liver and kidney (Fig. 5a), with the cycle threshold values for RPS18 being almost identical. Similarly, the primers targeting mRNAs encoding FBP-1 produced amplicons with comparable amplification efficiency (Fig. 5b) as the primers for PFK-1 subunits [16]. The relative expression levels of the mRNAs for the different PFK-1 subunits (Fig. 6) and FBP-1 (Fig. 7) were calculated based on the cycle threshold value for RPS18. The total mRNA expression levels of the three PFK-1 subunits were higher in the kidney than in the liver. Liver expressed high levels of PFK-L, and relatively little PFK-M and PFK-P. The kidney expressed PFK-P at the highest level followed by PFK-L, and PFK-M. The expression levels of FBP-1 in the kidney were more than four times higher than in the liver.
Fig. 4.

Dissociation curves for the different reverse transcription-quantitative real-time PCR (RT-qPCR) amplicons. Dissociation curves are shown for the amplicons representing RPS18, PFK-M, PFK-L, PFK-P, and FBP-1. The single peak in the dissociation curve seen by analyzing the first derivative means that the PCR products are homogeneous and there was no nonspecific amplification or primer-dimers.
Fig. 5.
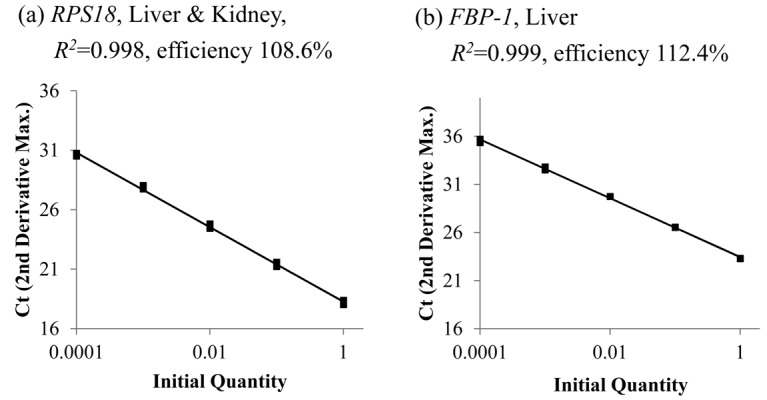
PCR standard curves for RPS18 and FBP-1. The X-axes represents serially diluted cDNA, and Y-axes represents the cycle threshold values (2nd Derivative Maximum) for RPS18 in liver and kidney (a), and for FBP-1 in liver (b). PCR efficiencies were calculated from the slope of the standard curves and the linear correlation coefficient (R2) of the standard curves.
Fig. 6.

mRNA expression levels of the different phosphofructokinase-1 (PFK-1) subunits in canine liver and kidney. The mRNA expression levels of each PFK-1 subunit (PFK-M, PFK-L, and PFK-P) in the liver and kidney of dogs were normalized to the mRNA expression levels of RPS18. Results are shown as the mean ± SEM of four independent experiments.
Fig. 7.
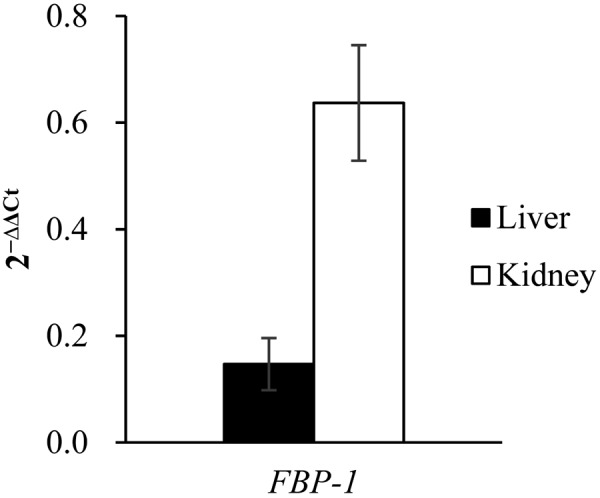
mRNA expression of FBP-1 in canine liver and kidney. The mRNA expression levels of FBP-1 in the liver and kidney of dogs were normalized to the mRNA expression levels of RPS18. Results are shown as the mean ± SEM of four independent experiments.
DISCUSSION
There are few studies that have focused on gluconeogenesis in the canine kidney. In mammals, the liver is a key organ for keeping plasma glucose levels in the normal range. The results in this study provide valuable data for veterinary medicine, although the glucose metabolism pathway in the canine kidney has not been elucidated. The results of the PFK-1 and FBP-1 assays in this study do not necessarily mean that FBP-1 activity levels are always much higher than PFK-1 activity levels under physiological conditions. It is thought that the liver needs only low levels of PFK-1 since high levels of trioses such as glyceraldehyde derived from glycerol and ketoacids enter into glycolysis downstream of the PFK-1 step. In contrast, the liver possesses much higher levels of FBP-1 in order to be able to produce plasma glucose from a variety of precursors.
Glucose metabolism in the kidney has been reported to differ in the medulla and cortex. The renal medulla is an active site of glycolysis, whereas the renal cortex is the predominant site of gluconeogenesis [27]. In this study, we found that the kidney displayed high levels of FBP-1, because the tissue samples of canine kidney were mostly extracted from the renal cortex. From the experiments examining the activity of phosphoenolpyruvate carboxykinase (EC: 4.1.1.32) in rats, it has been concluded that gluconeogenesis in the kidney is about 40–60% of that seen in the liver per whole organ [20], although the gluconeogenic activity per mg of protein in the kidney has been reported to be almost equal to that seen in the liver [5]. In this study, the ratio of FBP-1/PFK-1 activity was higher in the liver than in the kidney, although the specific activity of FBP-1 was higher in the kidney than in the liver. The canine kidney therefore has the potential to produce more endogenous glucose than expected, although the canine liver would usually be the predominant gluconeogenic organ in view of its much larger size.
Based on the Western blotting data, it appears that canine liver had both PFK-L and PFK-P subunits and that canine kidney had PFK-M, PFK-L, and PFK-P subunits. Based on the RT-qPCR results, canine liver mainly expressed PFK-L with little PFK-M and PFK-P, whereas the canine kidney expressed PFK-M, PFK-L, and PFK-P. There are therefore some discrepancies in the PFK-1 composition between the Western blotting and RT-qPCR results. At the very least, PFK-1 in canine liver mainly consists of PFK-L, whereas, in canine kidney, all three subunits are expressed. This suggests that the regulation of glucose catabolism is different in canine liver and kidney, since the ratios of the constituent PFK-1 subunits are different. It has been reported that PFK-1 in skeletal muscle is comprised of the PFK-M subunit, whereas most PFK-1 isozymes in other tissues are comprised of all three subunits in tissue-specific ratios [10]. Furthermore, it has been shown for various mammalian PFK-1s that these isozymes differ in their kinetic properties [1, 2, 7, 8, 17]. It is known that PFK-1 in the brain is composed of three types of subunits [9,10,11,12, 16], although the composition ratio of PFK-1 subunits in the brain is different from that in the kidney. One of the reasons that the brain consumes a considerable amount of glucose and produces ATP could be to maintain the membrane potential of neurons. Similarly, PFK-1 in the canine kidney could be composed of three subunits, because the kidney requires a continuous supply of ATP in order to produce urine. The PFK-1 isozymes comprised of different subunits are likely to be differentially regulated. Therefore, as a result of this differential regulation, we presume that canine liver and kidney have different glucose metabolism capacities.
Gluconeogenesis in the kidney has been reported to be under different hormonal control compared with the liver [15]. It has also been suggested that the net balance of glucose across the kidney is zero, since the kidney is both a consumer and producer of glucose [15]. Thus, gluconeogenesis in kidney might work to provide its own glucose as an energy source, but not to control plasma glucose levels under physiological conditions. Gluconeogenesis in the kidney has been suggested to be activated under conditions such as diabetes, in which the kidney has hyperactive glucose reabsorption.
In this study, we discovered that canine kidney has a high potential for both glucose catabolism and anabolism compared with glucose metabolism in the canine liver. It is not certain that the kidney functions instead of the liver to regulate glucose metabolism under conditions of liver dysfunction, however the kidney would not always play the role of blood glucose supplier instead of the liver under healthy conditions. In the case of common glucose metabolism disorders in dogs, such as hyperglycemia due to diabetes and hypoglycemia due to endocrine diseases such as insulinoma and hepatic disorders, it is necessary to understand renal gluconeogenic function. This should be useful in preventing the aggravation of symptoms and in determining the correct prognosis. In the future, we need to focus on the kidney as a gluconeogenic organ in order to gain a better understanding of its role in glucose metabolism.
REFERENCES
- 1.Akkerman J. W., Gorter G., Sixma J. J., Staal G. E.1974. Human platelet 6-phosphofructokinase. Purification, kinetic parameters and the influence of sulphate ions on enzyme activity. Biochim. Biophys. Acta 370: 102–112. doi: 10.1016/0005-2744(74)90036-9 [DOI] [PubMed] [Google Scholar]
- 2.Akkerman J. W., Gorter G., Over J., Sixma J. J., Staal G. E.1975. Human platelet 6-phosphofructokinase. Relation between inhibition by Mg-ATP2-and cooperativity towards fructose 6-phosphate and investigations on the formation of a ternary complex. Biochim. Biophys. Acta 397: 395–404. doi: 10.1016/0005-2744(75)90128-X [DOI] [PubMed] [Google Scholar]
- 3.Benoy M. P., Elliott K. A.1937. The metabolism of lactic and pyruvic acids in normal and tumour tissues: Synthesis of carbohydrate. Biochem. J. 31: 1268–1275. doi: 10.1042/bj0311268 [DOI] [PMC free article] [PubMed] [Google Scholar]
- 4.Boden G.2004. Gluconeogenesis and glycogenolysis in health and diabetes. J. Investig. Med. 52: 375–378. doi: 10.1136/jim-52-06-31 [DOI] [PubMed] [Google Scholar]
- 5.Bowman R. H.1970. Gluconeogenesis in the isolated perfused rat kidney. J. Biol. Chem. 245: 1604–1612. [PubMed] [Google Scholar]
- 6.Bradford M. M.1976. A rapid and sensitive method for the quantitation of microgram quantities of protein utilizing the principle of protein-dye binding. Anal. Biochem. 72: 248–254. doi: 10.1016/0003-2697(76)90527-3 [DOI] [PubMed] [Google Scholar]
- 7.Brüser A., Kirchberger J., Kloos M., Sträter N., Schöneberg T.2012. Functional linkage of adenine nucleotide binding sites in mammalian muscle 6-phosphofructokinase. J. Biol. Chem. 287: 17546–17553. doi: 10.1074/jbc.M112.347153 [DOI] [PMC free article] [PubMed] [Google Scholar]
- 8.Brüser A., Kirchberger J., Schöneberg T.2012. Altered allosteric regulation of muscle 6-phosphofructokinase causes Tarui disease. Biochem. Biophys. Res. Commun. 427: 133–137. doi: 10.1016/j.bbrc.2012.09.024 [DOI] [PubMed] [Google Scholar]
- 9.Dunaway G. A., Kasten T. P.1987. Nature of the subunits of the 6-phosphofructo-1-kinase isoenzymes from rat tissues. Biochem. J. 242: 667–671. doi: 10.1042/bj2420667 [DOI] [PMC free article] [PubMed] [Google Scholar]
- 10.Dunaway G. A., Kasten T. P., Sebo T., Trapp R.1988. Analysis of the phosphofructokinase subunits and isoenzymes in human tissues. Biochem. J. 251: 677–683. doi: 10.1042/bj2510677 [DOI] [PMC free article] [PubMed] [Google Scholar]
- 11.Foe L. G., Kemp R. G.1985. Isolation and characterization of phosphofructokinase C from rabbit brain. J. Biol. Chem. 260: 726–730. [PubMed] [Google Scholar]
- 12.Fukushima E., Sugiya H.1992. Purification and characterization of phosphofructokinase in bovine parotid gland. Int. J. Biochem. 24: 1307–1314. doi: 10.1016/0020-711X(92)90206-G [DOI] [PubMed] [Google Scholar]
- 13.Gerich J. E.1993. Control of glycaemia. Baillieres Clin. Endocrinol. Metab. 7: 551–586. doi: 10.1016/S0950-351X(05)80207-1 [DOI] [PubMed] [Google Scholar]
- 14.Gerich J. E.2000. Physiology of glucose homeostasis. Diabetes Obes. Metab. 2: 345–350. doi: 10.1046/j.1463-1326.2000.00085.x [DOI] [PubMed] [Google Scholar]
- 15.Gerich J. E., Meyer C., Woerle H. J., Stumvoll M.2001. Renal gluconeogenesis: its importance in human glucose homeostasis. Diabetes Care 24: 382–391. doi: 10.2337/diacare.24.2.382 [DOI] [PubMed] [Google Scholar]
- 16.Kanai S., Shimada T., Narita T., Okabayashi K.2019. Phosphofructokinase-1 subunit composition and activity in the skeletal muscle, liver, and brain of dogs. J. Vet. Med. Sci. 81: 712–716. doi: 10.1292/jvms.19-0049 [DOI] [PMC free article] [PubMed] [Google Scholar]
- 17.Martínez-Costa O. H., Sánchez-Martínez C., Sánchez V., Aragón J. J.2007. Chimeric phosphofructokinases involving exchange of the N- and C-terminal halves of mammalian isozymes: implications for ligand binding sites. FEBS Lett. 581: 3033–3038. doi: 10.1016/j.febslet.2007.05.059 [DOI] [PubMed] [Google Scholar]
- 18.Mather A., Pollock C.2011. Glucose handling by the kidney. Kidney Int. Suppl. 120: S1–S6. doi: 10.1038/ki.2010.509 [DOI] [PubMed] [Google Scholar]
- 19.Meyer C., Stumvoll M., Dostou J., Welle S., Haymond M., Gerich J.2002. Renal substrate exchange and gluconeogenesis in normal postabsorptive humans. Am. J. Physiol. Endocrinol. Metab. 282: E428–E434. doi: 10.1152/ajpendo.00116.2001 [DOI] [PubMed] [Google Scholar]
- 20.Nagai K., Suda M., Yamagishi O., Toyama Y., Nakagawa H.1975. Studies on the circadian rhythm of phosphoenolpyruvate carboxykinase. III. Circadian rhythm in the kidney. J. Biochem. 77: 1249–1254. [PubMed] [Google Scholar]
- 21.Okabayashi K., Narita T., Takashiro S., Nadaoka S., Kanai S., Ito D., Kitagawa M.2019. mRNA expression of tumor-associated genes in canine grade I meningiomas. J. Vet. Med. Sci. 81: 369–372. doi: 10.1292/jvms.18-0491 [DOI] [PMC free article] [PubMed] [Google Scholar]
- 22.Pfaffl M. W., Tichopad A., Prgomet C., Neuvians T. P.2004. Determination of stable housekeeping genes, differentially regulated target genes and sample integrity: BestKeeper-excel-based tool using pair-wise correlations. Biotechnol. Lett. 26: 509–515. doi: 10.1023/B:BILE.0000019559.84305.47 [DOI] [PubMed] [Google Scholar]
- 23.Rojas J. M., Schwartz M. W.2014. Control of hepatic glucose metabolism by islet and brain. Diabetes Obes. Metab. 16Suppl 1: 33–40. doi: 10.1111/dom.12332 [DOI] [PMC free article] [PubMed] [Google Scholar]
- 24.Saigal S., Nandeesh H. P., Malhotra V., Sarin S. K.1998. A case of hepatocellular carcinoma associated with troublesome hypoglycemia: management by cytoreduction using percutaneous ethanol injection. Am. J. Gastroenterol. 93: 1380–1381. doi: 10.1111/j.1572-0241.1998.427_h.x [DOI] [PubMed] [Google Scholar]
- 25.Sawada M., Mitsui Y., Sugiya H., Furuyama S.2000. Ribose 1,5-bisphosphate is a putative regulator of fructose 6-phosphate/fructose 1,6-bisphosphate cycle in liver. Int. J. Biochem. Cell Biol. 32: 447–454. doi: 10.1016/S1357-2725(99)00137-5 [DOI] [PubMed] [Google Scholar]
- 26.Smith O. K., Long C. N.1971. Renal gluconeogenesis in eviscerated diabetic rats. Proc. Natl. Acad. Sci. U.S.A. 68: 1618–1622. doi: 10.1073/pnas.68.7.1618 [DOI] [PMC free article] [PubMed] [Google Scholar]
- 27.Stumvoll M., Meyer C., Mitrakou A., Nadkarni V., Gerich J. E.1997. Renal glucose production and utilization: new aspects in humans. Diabetologia 40: 749–757. doi: 10.1007/s001250050745 [DOI] [PubMed] [Google Scholar]
- 28.Vagionas A., Tigas S., Oikonomou P., Pentheroudakis G., Malamou-Mitsi V., Pavlidis N.2014. Relapsing episodes of loss of consciousness in a patient with hepatocellular carcinoma. World J. Oncol. 5: 214–219. doi: 10.14740/wjon790w [DOI] [PMC free article] [PubMed] [Google Scholar]