

Abstract
Eukaryotic elongation factor 2 kinase (eEF‐2K) regulates protein synthesis by phosphorylating eukaryotic elongation factor 2 (eEF‐2), thereby reducing its affinity for the ribosome and suppressing global translational elongation rates. eEF‐2K is regulated by calmodulin (CaM) through a mechanism that is distinct from that of other CaM‐regulated kinases. We had previously identified a minimal construct of eEF‐2K (TR) that is activated similarly to the wild‐type enzyme by CaM in vitro and retains its ability to phosphorylate eEF‐2 efficiently in cells. Here, we employ solution nuclear magnetic resonance techniques relying on Ile δ1‐methyls of TR and Ile δ1‐ and Met ε‐methyls of CaM, as probes of their mutual interaction and the influence of Ca2+ thereon. We find that in the absence of Ca2+, CaM exclusively utilizes its C‐terminal lobe (CaMC) to engage the N‐terminal CaM‐binding domain (CBD) of TR in a high‐affinity interaction. Avidity resulting from additional weak interactions of TR with the Ca2+‐loaded N‐terminal lobe of CaM (CaMN) at increased Ca2+ levels serves to enhance the affinity further. These latter interactions under Ca2+ saturation result in minimal perturbations in the spectra of TR in the context of its complex with CaM, suggesting that the latter is capable of driving TR to its final, presumably active conformation, in the Ca2+‐free state. Our data are consistent with a scenario in which Ca2+ enhances the affinity of the TR/CaM interactions, resulting in the increased effective concentration of the CaM‐bound species without significantly modifying the conformation of TR within the final, active complex.
Keywords: calmodulin‐regulated kinase, eukaryotic elongation factor 2 kinase (eEF‐2K), methyl NMR spectroscopy, phosphorylation, translational regulation
1. INTRODUCTION
The activity of the GTPase, eukaryotic elongation factor 2 (eEF‐2), facilitates the translocation of the nascent chain from the ribosomal A‐site to the P‐site during protein synthesis.1 Specific phosphorylation of eEF‐2 (on Thr‐56) decreases its affinity for the ribosome and leads to a global reduction in translational elongation rates.2, 3 Eukaryotic elongation factor 2 kinase (eEF‐2K),4, 5 a member of the α‐kinase family,6 ubiquitously expressed in eukaryotes, enables this critical posttranslational modification. Given its role in a cellular process of fundamental importance, the activity of eEF‐2K is tightly controlled through its interactions with calmodulin (CaM) and Ca2+ and further regulated through multisite phosphorylation.7 The CaM‐mediated activation of eEF‐2K does not involve a “release‐of‐inhibition” mechanism that is the hallmark of the activation pathways of other CaM‐regulated kinases (e.g., CaMKII8), in which CaM binding disengages an inhibitory segment from the catalytic site allowing substrate access.9 Instead, eEF‐2K activates through a unique multistep process that initiates with the engagement of CaM resulting in a conformation with an enhanced ability to autophosphorylate at its primary activating site, Thr348 (3‐letter codes are used to denote eEF‐2K residues). The subsequent engagement of an allosteric site (the phosphate‐binding pocket, PBP) by phosphorylated Thr348 generates a conformation that can phosphorylate eEF‐2 with increased efficiency.10 The activity of eEF‐2K is further regulated by pH11 and additional phosphorylation events that modulate its association with CaM12 or the Ca2+‐sensitivity thereof.13 Thus, eEF‐2K efficiently integrates multiple disparate stimuli, including Ca2+, H+, and phosphorylation, to regulate translational elongation.14 eEF‐2K plays key roles in physiological activities as diverse as cytoprotection under energy/nutrient deprivation,15, 16 the regulation of cell cycle progression,17 and the formation of memory.18 Multiple cancers,19, 20 neurological disorders,21, 22 and cardiovascular diseases,23, 24 have been linked to aberrant eEF‐2K activity, establishing its importance as a potential drug target.25, 26
As an essential first step toward obtaining a comprehensive understanding of the activation, activity, and regulation of eEF‐2K, we focused on determining the mechanism by which interactions with CaM upregulate eEF‐2K. In order to obtain structural insight into eEF‐2K/CaM interactions, we had previously determined the high‐resolution structure of a peptide encoding the N‐terminal atypical calmodulin‐binding domain (CBD) of eEF‐2K (eEF‐2KCBD; 74–100) in complex with Ca2+‐CaM.27 This structure illustrates what has been suggested to embody the primary interaction mode between eEF‐2K and CaM in its Ca2+‐loaded state. Furthermore, we had developed a minimal eEF‐2K construct, we termed TR (for truncated), that is activated by CaM to a similar extent in vitro as wild‐type enzyme and retains the ability to phosphorylate eEF‐2 in cells with high efficiency.28 TR (shown schematically in Figure 1) contains the intact CBD at its N‐terminus, the intact α‐kinase domain, and the entire C‐terminal domain (CTD), which encodes multiple helical repeats29 of wild‐type eEF‐2K. TR lacks the extreme N‐terminus (1–70), a significant portion of the central regulatory loop (R‐loop; 359–489) and several sites of up‐ and down‐regulating phosphorylation contained therein, but includes both the primary (Thr348) and secondary (Ser500) sites of autophosphorylation.30 Our recent studies using hydrogen exchange mass spectrometry (HXMS), chemical cross‐linking mass spectrometry (XLMS), small‐angle X‐ray scattering (SAXS), and computational modeling have helped ascertain the relative organization of CaM and the structural domains of TR within the Ca2+‐CaM•TR complex.28 However, additional information is required to elucidate the conformational changes that drive TR to its active state by CaM, the corresponding conformational changes in CaM itself, and the role of Ca2+ therein.
Figure 1.

Schematic illustration of the TR (top) and TRΔN (bottom) constructs of eEF‐2K showing the functional “domains.” The latter construct lacks the N‐terminal CaM‐binding domain (CBD, orange) but contains the intact α‐kinase domain (KD, dark blue) and the C‐terminal domain (CTD, purple) that encodes several helical repeats. The N‐terminal fragment (71–358 for TR and 101–358 for TRΔN) is connected to the C‐terminal fragment (490–725 in both cases) by a 6‐glycine linker. The remnant of the regulatory (R‐loop) contains the two sites of regulatory autophosphorylation, Thr348, and Ser500. The inset is a schematic illustration of the interaction of the isolated CBD in complex with Ca2+‐CaM. The Ca2+‐free CaM C‐lobe (CaMC) takes part in an interaction involving Trp85 (1), Ile89 (5), and Ala92 (8) of eEF‐2K. The Ca2+‐loaded (yellow spheres represent Ca2+ ions) CaM N‐lobe (CaMN) weakly interacts with Pro98 (14). The dotted lines indicate the segments that are present in wild‐type eEF‐2K but absent in each truncated construct
The interaction mode established by our previous work and embodied by the structure of the Ca2+‐CaM•eEF‐2KCBD complex relied on a short peptide encompassing the eEF‐2K CBD.27 Most importantly, this structure did not include any intact functional domains of eEF‐2K that could potentially modify the interaction mode in a manner that has been noted in other CaM‐regulated kinases.31 It is therefore imperative to validate the overall CaM‐binding mode determined utilizing the eEF‐2KCBD peptide in the context of TR as a functional proxy for full‐length eEF‐2K. Furthermore, the structure of the Ca2+‐CaM•eEF‐2KCBD complex provides no significant insight into CaM‐driven conformational changes in eEF‐2K. Therefore, in pursuance of our long‐term goal to decipher the mechanisms of the CaM‐mediated activation of eEF‐2K, here we utilize methyl nuclear magnetic resonance (NMR) spectroscopy to investigate the conformational changes induced on CaM and TR, upon their mutual interaction and the influence of Ca2+ in modulating this interaction.
2. RESULTS AND DISCUSSION
2.1. Selected methyl groups as probes of interactions between CaM and TR
Using native mass spectrometry, we had previously demonstrated that CaM and TR form a high‐affinity heterodimeric complex of molecular weight of ~77.3 kDa28 in the presence of Ca2+. Given the size of the CaM•TR complex and its low stability even at modest concentrations (~50 μM) over extended periods of time, we took advantage of the excellent sensitivity provided by methyl groups for NMR in large, proton‐sparse systems.32, 33 We chose to utilize the δ1 positions of the 8 Ile residues, and the ε positions of the 9 Met residues on CaM (Figure S1A), together with the δ1 positions of the 20 Ile residues on TR (Figure S2A,S2B) as reporters of interaction.
Key structural regions of both the N‐terminal lobe (CaMN) and the C‐terminal lobe (CaMC) of CaM contain Ile residues. These include the Ca2+‐binding loops on CaMN (I27 and I63; we use single letter codes for CaM residues) and on CaMC (I100 and I130). The CaM Met residues are key constituents of the so‐called FLMM tetrads (M51 and M71 on CaMN; M124 and M144 on CaMC) that form docking platforms for the critical hydrophobic anchors on interaction partners.34 All of these resonances with and without Ca2+ (Figure S1B,S1C), and in the presence or absence of TR, could be unambiguously assigned as described in detail in Data S1.
The 20 Ile residues on TR (Figure S2A,S2B) are distributed over all its functional domains including the N‐terminal CBD (Ile89, that constitutes the fifth position of 1–5–8–14 binding mode seen in the structure of the Ca2+‐CaM•eEF‐2KCBD complex27), on the N‐lobe of the kinase domain (Figure S2A; KDN; Ile107, Ile131, Ile173, Ile214, Ile215, and Ile232), the C‐lobe of the kinase domain (Figure S2A; KDC; Ile209, Ile237, Ile251, Ile271, Ile275, Ile287, and Ile317), on the loop connecting the N‐ and C‐terminal regions of TR (a remnant of the R‐loop; Ile349 that lies next to Thr348, the site of primary activating autophosphorylation) and on the CTD (Figure S2B; Ile518, Ile522, Ile567, Ile581, and Ile614). Of these 20 resonances, 15 were unambiguously assigned using a mutation‐based approach as described previously28 (see Figure S3 for examples that illustrate this approach).
Removal of the N‐terminal CBD to generate the TRΔN construct (Figure 1) did not result in substantial changes in the Ile δ1 resonances (Figure S2C) with a few exceptions. One of the resonances of the Ile131/Ile215 pair that could not be unambiguously assigned28 (Figure S3) shows a significant change in position, while the other splits into two indicating the presence of multiple conformations in slow exchange. It is possible that the CBD, which is spatially proximal to the partially exposed Ile131 (in the homology model of the eEF‐2K KD in complex with ATP;35 the structure of the eEF‐2K KD has been solved, but the corresponding coordinates are not publicly available), interacts with it in the context of TR, and this effect transmits to Ile215. The fact that Ile214 also exhibits a small difference in chemical shifts comparing the TR and TRΔN constructs provides some credence to this scenario. It is somewhat surprising, however, Ile107 that contacts Ile131 does not show any significant perturbations (Figure S2C). Ile232 that contacts the adenine moiety of ATP in the homology model also splits into two resonances, as does one resonance of the Ile237/Ile349 pair. These perturbations suggest the presence of a connected network that extends from the N‐terminal region (KDN) to the active site of TR (Figure S2D).
2.2. TR is engaged exclusively through CaMC in the absence of Ca2+
TR induces significant perturbations in the 13C,1H HMQC spectrum of IM‐labeled CaM in the absence of Ca2+ (apo‐CaM). Interestingly, only CaMC resonances show substantial perturbations in the presence of TR, with minimal changes in CaMN resonance positions (Figure 2a). The affected CaMC resonances display slow exchange on the chemical shift timescale (Figure S4) suggestive of strong interactions with TR. The largest chemical shift changes (Figure 2a and Figure S5A) are seen for I100 (Δδ = 0.73 ppm) and I125 (1.1 ppm), which along with M124 and M144 form part of the deep hydrophobic cavity that accommodates Trp85 (position 1 of the 1–5–8–14 binding mode; shown schematically in Figure 1) in the structure of the Ca2+‐CaM•eEF‐2KCBD complex. Trp85 is the key hydrophobic anchor that plays a critical role in CaM/eEF‐2K interactions; mutation of this residue severely compromises the ability of eEF‐2K to phosphorylate eEF‐2 in cells.27 Extensive broadening of the resonances corresponding to M124 and M144 occurs in the TR‐bound state, and their positions could be not tracked in our analyses. Also perturbed is the resonance corresponding to M145 (0.44 ppm), which was shown to contact Ile89 (position 5 in the 1–5–8–14 binding mode) in the Ca2+‐CaM•eEF‐2KCBD complex. The TR‐bound CaMC resonances either overlap with or are proximal to the corresponding resonances of the eEF‐2KCBD‐bound state of apo‐CaM (see Table 1, Figure 2a,c). This similarity between resonance positions suggests a close similarity between the modes utilized by the isolated eEF‐2KCBD peptide and by TR to engage apo‐CaM. As in the case of eEF‐2KCBD, CaM exclusively uses CaMC to engage TR in the absence of Ca2+; CaMN makes no significant contributions to the interaction in either case.
Figure 2.
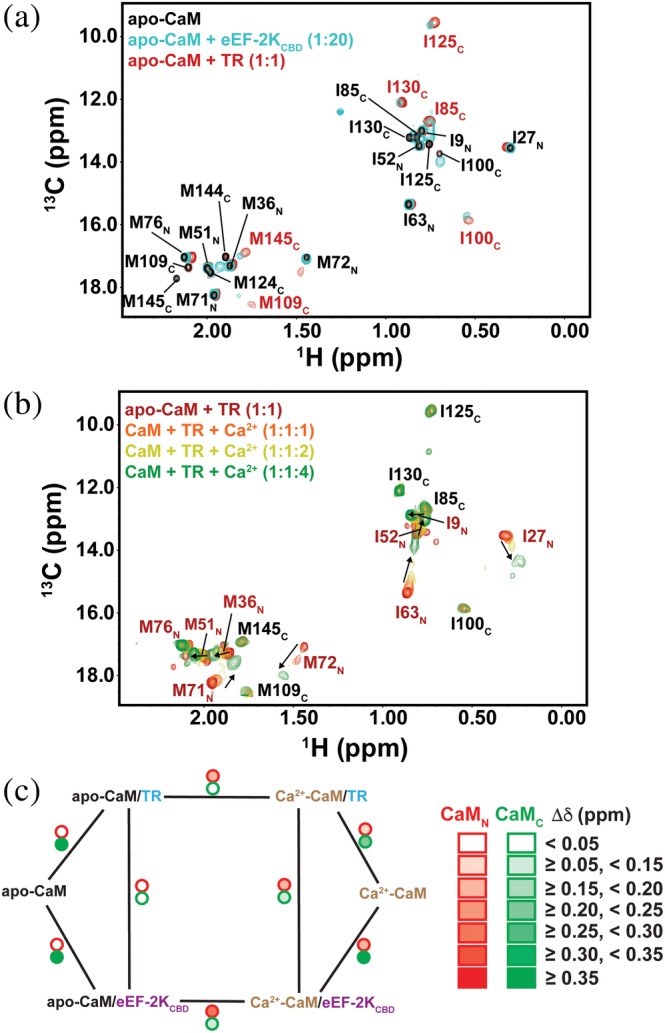
(a) Overlay of 13C, 1H HMQC spectra (800 MHz) of IM‐labeled CaM (black) in the presence of 20 molar equivalents of 2H‐labeled eEF‐2KCBD (cyan) or an equimolar amount of TR (red) in the absence of Ca2+. The peaks corresponding to apo‐CaM are labeled in black, and unique peaks of the TR‐bound state are labeled in red. The TR‐bound peaks largely overlap with those of the eEF‐2KCBD bound state, and only the CaMC peaks in such cases differ from those of apo‐CaM. (b) Ca2+‐induced perturbations on resonances corresponding to the apo‐CaM•TR complex are largely limited to CaMN (labeled in red); these show gradual chemical shift changes with increasing Ca2+ concentration (spectra in the presence of 1, 2 and 4 molar equivalents of Ca2+ are shown; the trajectories of the resonances are shown by the black arrows) indicative of fast exchange kinetics. Key CaMC resonances (labeled in black) are not affected. (c) Schematic representation of the average chemical shift differences (Δδ) for CaMN (red outlined circle) and CaMC (green outlined circle) between various states of IM‐labeled CaM. The lines link pairs of compared states. See Table 1 for numerical values of these differences
Table 1.
Comparison of chemical shift differences between various states of IM‐labeled CaM
| CaMN a | CaMC b | ||||
|---|---|---|---|---|---|
| Complex 1 | Complex 2 | Count | Δδ (ppm) | Count | Δδ (ppm) |
| eEF‐2KCBD | |||||
| Apo‐CaM | Apo‐CaM/eEF‐2KCBD | 9 | < 0.02 c | 6 | 0.49 ± 0.32 c |
| Ca2+‐CaM | Ca2+‐CaM/eEF‐2KCBD | 9 | 0.18 ± 0.16 | 8 | 0.44 ± 0.50 |
| Apo‐CaM/eEF‐2KCBD | Ca2+‐CaM/eEF‐2KCBD | 9 | 0.28 ± 0.24 | 7 | 0.07 ± 0.04 |
| TR | |||||
| Apo‐CaM | Apo‐CaM/TR | 9 | < 0.02 | 6 | 0.53 ± 0.32 |
| Ca2+‐CaM | Ca2+‐CaM/TRd | 9 | 0.08 ± 0.06 | 6 | 0.21 ± 0.18 |
| Apo‐CaM/TR | Ca2+‐CaM/TRd | 9 | 0.16 ± 0.12 | 6 | < 0.02 |
| eEF‐2KCBD/TR | |||||
| Apo‐CaM/eEF‐2KCBD | Apo‐CaM/TR | 9 | < 0.02 | 6 | 0.04 ± 0.03 |
| Ca2+‐CaM/eEF‐2KCBD | Ca2+‐CaM/TRd | 9 | 0.19 ± 0.15 | 6 | 0.10 ± 0.07 |
CaMN residues: I9, I27, M36, M51, I52, I63, M71, M72, and M76 (9 total; 4 Ile, 5 Met).
CaMC residues: I85, I100, M109, M124, I125, I130, M144, and M145 (8 total; 4 Ile, 4 Met).
Δδ values of ≥0.40 ppm imply considerable perturbations and are shown in boldface, Δδ that are below the detection limit are denoted as <0.02 and italicized.
Note that the shifts for the Ca2+‐CaM/TR complex were calculated for the spectra with CaM:TR: Ca2+ in a 1:1:4 molar ratio.
2.3. CaMC interactions are unmodified, and CaMN weakly engages TR under Ca2+‐saturating conditions
As in the case of the isolated eEF‐2KCBD, increasing Ca2+ concentration perturbs CaMC resonances minimally when bound to TR (Figure 2b and Figure S5B).27 Notably, I100 and I130 from the Ca2+‐binding loops of CaMC remain at positions corresponding to their Ca2+‐free, TR‐bound states. This observation is in line with our previous mass spectrometry studies that revealed the presence of only two of the expected four Ca2+ ions in the Ca2+‐CaM•TR complex.28 Furthermore, the structure of Ca2+‐CaM•eEF‐2KCBD illustrates the fact that the conformation of CaMC is incompatible with Ca2+‐binding when engaged with the eEF‐2KCBD peptide,27 a situation that appears to be maintained in the context of TR. In contrast, the CaMN resonances show significant changes (Figure 2b and Figure S5B) including those for residues of the corresponding Ca2+‐binding loops (I27, 0.23 ppm, and I63, 0.40 ppm; with 4 molar equivalents of Ca2+). M71 (that belongs to the CaMN FLMM tetrad known to contact CaM targets) that is part of the pocket that accommodates Pro98 (position 14 in the 1–5–8–14 binding mode) in the structure of the Ca2+‐CaM•eEF‐2KCBD complex27 is also perturbed (0.21 ppm), as is the flanking M72 (0.26 ppm).
A comparison of the spectrum of Ca2+‐CaM with that of the Ca2+‐CaM•TR complex shows relatively modest differences in the positions CaMN resonances (Figure S6A) overall, though significant deviations are noted (Figure S6B) for I27 (0.17 ppm) and M72 (0.19 ppm); a more modest difference is also seen for I63 (0.07 ppm). The relative proximity in resonance positions for CaMN residues between the Ca2+‐CaM and Ca2+‐CaM•TR states implies that the most significant spectral perturbations in CaMN in the context of the Ca2+‐CaM•TR complex relative to the apo‐CaM•TR complex result from the occupancy of the Ca2+ sites on this lobe. However, the presence of significant perturbations (e.g., I27 and M72) independent of those induced by Ca2+ on the apo‐CaM•TR complex suggest additional interactions with TR enabled by the Ca2+ occupancy of CaMN as previously noted in the case of eEF‐2KCBD.27 These latter interactions, though weak (hence the limited spectral perturbations and the fast exchange regime, see Figure 2b), provide additional binding free energy to enhance the overall affinity of the interaction.
The average differences in the positions of both CaMN and CaMC resonances of Ca2+‐CaM alone compared to those of the Ca2+‐saturated eEF‐2KCBD‐bound state are significantly larger than those for the corresponding Ca2+‐saturated TR‐bound state (Table 1). It is possible that this is the result of the more substantial steric barriers imposed on the CaM lobes by TR that are absent for the isolated eEF‐2KCBD peptide, allowing a larger conformational space to be sampled by CaM in the latter case. However, in both cases, these deviations are more modest for the CaMN resonances compared to the corresponding CaMC resonances. This suggests that the conformations (and chemical environments) of the CaMN Ile and Met sidechains are closer to those of Ca2+‐CaM overall, whereas the presence of the eEF‐2KCBD peptide or TR dramatically influences the conformations of the CaMC Ile and Met sidechains.
Along similar lines, a comparison of the spectra of IM‐labeled CaM in the Ca2+‐CaM•TR and Ca2+‐CaM•eEF‐2KCBD complexes (Figure S7A) shows differences for both CaMN and CaMC resonances with the magnitude of these differences being approximately twofold larger, on average, for CaMN (Table 1 and Figure S7B). These differences suggest that the conformation of CaMN, or the mode of engagement, or both, is somewhat different between the Ca2+‐CaM•TR and Ca2+‐CaM•eEF‐2KCBD complexes. We speculate that the small differences seen for CaMC (Δδ = 0.10 ± 0.07 ppm; Table 1) do not reflect significant changes in the binding mode but rather indicate modest changes in interlobe orientation between the two cases, as suggested above, and as indicated by our previous chemical cross‐linking studies.28 The overall differences in CaM resonance positions between the various complexes discussed are shown in Table 1 and illustrated schematically in Figure 2c.
2.4. CaM can drive TR toward its active state in the absence of Ca2+
The spectrum of I‐labeled TR in the presence of an equimolar amount of CaM in the absence of Ca2+ shows significant perturbations (Figure 3a). While most of the resonances corresponding to the CTD show little or no changes, substantial effects are seen for the KD Ile δ1 resonances. The most significant alteration in the resonance position is seen for Ile89 (Δδ = 0.73 ppm) that, as stated before, corresponds to the fifth position in the 1–5–8–14 engagement of the CBD. Large perturbations are also noted for one of the peaks of ambiguously assigned Ile131/Ile215 cluster (the other showing a smaller, but visible change), Ile232 (0.20 ppm) and Ile287 (0.15 ppm); smaller perturbations are seen for Ile173 (0.04 ppm), Ile214 (0.10 ppm), and Ile251 (0.04 ppm) resonances. The free TR resonances corresponding to Ile209, Ile271, and Ile275 disappear, likely reappearing elsewhere on the spectrum (several new peaks, yet unassigned, appear in the spectrum of the complex); the corresponding resonances for the CaM‐bound state of TR have not been assigned yet. As in the case of the spectra of CaM in the presence of TR (discussed above and illustrated in Figure S4), spectral changes in TR brought about by increasing amounts of apo‐CaM (not shown) are reflective of a slow exchange regime suggesting a strong interaction between the two species.
Figure 3.

(a) Overlay of the 13C, 1H HMQC spectra (800 MHz) of I‐labeled TR without (green) or with an equimolar amount of 2H‐labeled CaM (pink) in the absence of Ca2+. Resonances of TR perturbed by the presence of CaM are labeled, and the red arrows show their trajectories. Resonances of TR that are visible in the absence of CaM but disappear in its presence but for which the corresponding resonances in the spectrum of the CaM‐bound state have not yet been assigned are indicated by the “**.” (b) Only a small number of Ile resonances (labeled in black) show minor chemical shift changes in the presence of increasing amounts of Ca2+ compared to the apo‐CaM bound state
The spectrum of I‐labeled TR alone does not show any significant perturbations in the presence of an excess of Ca2+ (Figure S8), suggesting its inability to engage Ca2+. The addition of Ca2+ leads to minimal changes in the spectrum of TR in the context of the apo‐CaM•TR complex (Figure 3b). This is somewhat expected given that additional interactions with CaM (see above) under Ca2+ saturating conditions are weak. Only small chemical shift perturbations are seen for Ile89, the Ile131/Ile215 cluster, Ile214, and Ile232. The lack of substantial Ca2+‐induced spectral perturbations indicates the absence of major conformational rearrangements in TR in the context of the Ca2+‐CaM•TR complex compared with the apo‐CaM•TR complex. They reflect weak/transient interactions (in the fast exchange regime given the gradual change in resonance positions in the TR spectrum) with Ca2+‐loaded CaMN. The location of the additional perturbations on TR suggests that direct interactions are likely to involve KDN, given the localization of the CBD‐bound CaM in its vicinity. This is in line with increased protection seen for this region of the KDN in the presence of Ca2+‐CaM in our recent hydrogen exchange mass spectrometry (HXMS) studies.28 Given that TR attains its CaM‐bound conformation in the absence of Ca2+ with minimal further changes (at least at our current level of resolution) under Ca2+‐saturating conditions suggests that apo‐CaM itself is capable of driving the final, presumably active, conformation of TR. This observation is consistent with our previous results demonstrating that wild‐type eEF‐2K is strongly activated by apo‐CaM (k cat ~11 s−1); the presence of Ca2+ leads to only a modest approximately twofold increase in k cat (~25 s−1) but more than an 800‐fold decrease in the apparent K M,13 suggesting that the presence of Ca2+ primarily enhances the affinity of the interaction with minimal effects on the active‐state conformation.
We had previously presented an analysis of the Ca2+‐CaM‐induced perturbations on TR.28 In that study carried out under Ca2+‐saturating conditions, we had noted the large perturbations induced on TR spectra by Ca2+‐CaM. However, we had not realized at that time that it is CaM itself rather than Ca2+‐CaM that is the driver of these conformational changes as is suggested by the data presented here. As we had noted previously,28 the most significant perturbations (Figure S9) extend from the top of KDN (Ile214, Ile131/Ile215, and Ile232) into KDC (Ile209, Ile271, Ile275, and Ile287). The CaM‐induced perturbations at KDN and KDC are consistent with the large‐scale protection from solvent exchange seen for TR in the presence of Ca2+‐CaM in our previous HXMS studies28 and suggest a sizeable connected network within the KD of TR that responds to the engagement of CaM. Interestingly, our previous HXMS had also suggested increased protection from solvent for certain parts of the CTD in the presence of Ca2+‐CaM.28 The region in question includes a single probe, Ile1614, in our current studies. The δ1 resonance corresponding to this residue shows no observable change in the CaM‐bound state both in the absence and in the presence of Ca2+. It is quite possible that there is indeed a CaM‐induced conformational change in this region, but the inadequate coverage by NMR probes in the CTD (as opposed to the KD) prevents its detection in our current analysis.
2.5. The N‐terminal CaM‐binding domain is the primary site of interaction of CaM with TR
In order to confirm whether the CBD represents the primary site of the CaM/TR interaction, we prepared a construct of TR that is missing 100 N‐terminal residues of eEF‐2K including the CBD (Figure 1). This construct, TRΔN, does not engage CaM in the absence of Ca2+ (Figure S10). In the presence of Ca2+, several resonances corresponding to the Ca2+‐loaded CaMC (I100, M109, M124, I125, and M144) are completely broadened out in the presence of an equimolar amount of TRΔN, which is indicative of chemical exchange in the intermediate timescale (Figure 4a); additional residues are broadened (but are still observable) with increasing amounts of TRΔN. However, the overall spectral changes for IM‐labeled Ca2+‐CaM in the presence of TRΔN are quite modest compared with the significant differences noted when compared to the spectra in the presence of TR (Figure S11A). Similarly, an inspection of the spectrum of I‐labeled TRΔN in the presence of an excess of Ca2+‐CaM shows minimal perturbations that are restricted to the disappearance of one of the two peaks corresponding to Ile232 and a shift in one of the peaks of the Ile131/Ile215 cluster (Figure 4b). This suggests weak interactions in contrast to the large‐scale perturbations seen in TR in the presence of Ca2+‐CaM (or apo‐CaM, for that matter) (Figure S11B). It is interesting, however, that these resonances are also perturbed in the spectrum of TR in the context of the apo‐CaM•TR complex by the addition of Ca2+. This indicates that TR lacking the CBD (as is the case in TRΔN) possesses weak intrinsic affinity for Ca2+‐CaM. However, it is evident that the CBD is necessary for the optimal interaction of TR with CaM and this association occurs primarily through the Ca2+‐free CaMC. The presence of the CBD thus serves to orient the two lobes of CaM with respect to TR and drive the latter toward its final, presumably active, conformation. This finding is in line with the observation that deletion of the CBD prevents the CaM‐mediated activation of eEF‐2K.36
Figure 4.

(a) Comparison of 13C, 1H HMQC spectra (700 MHz) of Ca2+‐CaM without (black) and with 1 (red) and 4.4 molar equivalents (green) of 2H‐labeled TRΔN. Only minor perturbations are seen with a few resonances corresponding to CaMC broadened out (labeled and marked with “*”) in the presence of an equimolar ratio of TRΔN with additional line‐broadening and seen at higher concentrations. (b) Comparison of 13C, 1H HMQC spectra (800 MHz) of I‐labeled TRΔN without (green) and with varying molar ratios of 2H‐labeled Ca2+‐CaM (1:0.5 – yellow, 1:1, dark blue and 1:2 – orange). Only minor perturbations are seen with the vanishing of one of two peaks (also see Figure S2C) corresponding to Ile232 and modest chemical shift changes of the peaks of the Ile131/Ile215 cluster
2.6. TR engages CaM tightly both in the absence and in the presence of Ca2+
In order to estimate the affinity of the CaM/TR interaction (with and without Ca2+), we relied on our previously developed kinetics‐based assay that utilizes the measurement of the activity eEF‐2K (or a variant thereof) toward a peptide substrate, Soxtide.37 Soxtide bears a Cys residue, located two residues N‐terminal to the phospho‐acceptor, and modified by Sox (sulfonamide‐oxine). Increased fluorescence resulting from the chelation of Mg2+ ions through the Sox and phosphate moieties following phosphorylation provides a direct measure of activity that can be determined under varying concentrations of CaM. Using this assay, the K D,app of TR toward CaM was found to be 77 ± 6 nM in the absence of Ca2+, reducing to 0.07 ± 0.01 nM, in its presence (Figure 5). The latter K D,app should be considered approximate, given the extremely tight interaction and the resulting difficulty in reaching sufficiently low concentrations of CaM required to better define the binding curve (the blue curve in Figure 5). While this assay provides only an indirect measure of the CaM affinity of TR, it is nevertheless clear that that there is a strong interaction between the two species in the absence of Ca2+ and a significant increase in their mutual affinity in its presence. The measured change in interaction strength by approximately three orders of magnitude may be interpreted as avidity resulting from an additional interaction of mM affinity. As suggested by the NMR studies described above, these additional interactions involve Ca2+‐loaded CaMN. The fast exchange regime on the NMR timescale apparent in the spectra of the TR•CaM complex (either for IM‐labeled CaM or for I‐labeled TR; Figures 2b and 3b) in the presence of Ca2+ confirms that the additional interactions involving the Ca2+‐loaded CaMN are indeed weak.
Figure 5.

CaM affinity measured through continuous fluorescence monitoring of Soxtide phosphorylation by TR in the presence (blue) or the absence (red) of Ca2+
It is, however, somewhat surprising that the affinity of Ca2+‐free CaM toward TR (~77 nM) determined here is substantially higher, by ~500‐fold, than that for the isolated eEF‐2KCBD (~35 μM) peptide27 (though the measured affinities in the two cases result from two different assays) in spite of the fact that the NMR data suggest that the binding mode appears to be quite similar in the two cases. We speculate that this is due to a more modest loss in entropy for the CBD in the context of TR than that for the isolated eEF‐2KCBD peptide upon binding CaM in the absence of Ca2+. Notably, the observable differences in the positions of the Ile δ1 resonances of TR and TRΔN (Figure S2C, discussed above) seem to suggest that the CBD likely interacts with the KD and is therefore further spatially restricted than the eEF‐2KCBD peptide that is free‐diffusing when unbound. However, this scenario requires robust experimental validation, possibly through NMR relaxation analysis,38 given that isothermal calorimetry (ITC) measurements are somewhat hampered due to low heat release (data not shown).
3. CONCLUSIONS
Our primary motivations in performing this study were (a) to detect conformational changes in CaM and a minimal construct of eEF‐2K (TR) upon their mutual interaction and (b) to ascertain the role of Ca2+ in driving these interactions. TR is similarly activated by Ca2+‐CaM in vitro as wild‐type eEF‐2K and can efficiently phosphorylate the substrate, eEF‐2, in cells.28 Therefore, information obtained using TR as a proxy for full‐length eEF‐2K is relevant in the context of the CaM‐mediated activation of the wild‐type enzyme. We had previously determined the high‐resolution structure of the isolated CBD of eEF‐2K (eEF‐2KCBD) in complex with Ca2+‐CaM. In that study, we found that the CBD engaged CaM primarily through CaMC and was capable of doing so in the absence of Ca2+.27 Our current data establish that the recognition of the CBD, now a part of the N‐terminus of TR, by Ca2+‐free CaMC remains the primary mode of interaction between CaM and TR. This mode of recognition is quite similar to that of the isolated eEF‐2KCBD peptide at our current level of resolution. A construct, TRΔN, missing the CBD, is unable to interact with CaM in the absence of Ca2+ and does so only weakly in its presence. As in the case of eEF‐2KCBD, Ca2+‐loading of CaMN enables additional weak interactions with TR. These secondary interactions reinforce the existing ones involving the CBD with Ca2+‐free CaMC to enhance the affinity of the CaM/TR association. Furthermore, Ca2+ does not significantly alter what is presumably the active conformation of TR within the TR•CaM complex as also suggested by our earlier biochemical studies.13 Given that free CaM is likely to be the limiting factor in the regulation of its numerous targets in a cellular context,39 enhanced affinity for eEF‐2K under elevated Ca2+ levels is perhaps a mechanism to generate higher concentrations of the active complex in the presence of multiple competing CaM targets. However, additional experiments are necessary to confirm this scenario.
Although quite insightful, the analyses presented above utilize only a limited number of NMR probes of the interactions between TR and CaM. These studies should therefore be considered to represent a first step toward obtaining an understanding of the CaM‐mediated activation of eEF‐2K. Data at a higher resolution is essential to ascertain the precise mechanisms of the interactions and the nuances of the resulting activation process. We are currently working toward this goal by increasing the number of NMR probes by extending our studies to include additional methyl‐bearing residues, for example, Leu, Val, Ala, or Thr in the analyses, and determining conditions that would enable us to obtain a high‐resolution structure of the CaM•TR complex.
4. MATERIALS AND METHODS
4.1. NMR‐based titrations
Individual samples for use in the solution NMR studies were prepared as described in Data S1. I‐labeled TRΔN (30 μM) in Ca‐buffer (see Data S1) prepared in D2O was used in the titration experiments with 0, 0.25, 0.5, 1, 2, and 4 molar equivalents of 2H‐labeled CaM. 13C, 1H HMQC spectra (700 MHz) were acquired in each case using 64 and 512 complex points in the 13C and 1H dimensions, respectively, with corresponding sweep widths of 7 and 12.5 ppm. For the Ca2+ titration experiments, complexes containing 30 μM of either I‐labeled TR with 2H‐labeled CaM or unlabeled TR with IM‐labeled CaM at equimolar ratios in D2O‐based apo‐buffer, were used. Data were obtained in the presence of 0, 0.5, 1, 2, 3, 4, and 8 molar equivalents of Ca2+ in each case using 13C, 1H HMQC spectra (800 MHz). Spectra were acquired using 50 and 512 complex points in the 13C and 1H dimensions, respectively, in each case. The corresponding sweep widths were 9.5 and 12.5 ppm for experiments involving I‐labeled TR, and 10 and 12.5 ppm for IM‐labeled CaM. Utilizing resonance assignments obtained using the procedures described in Data S1, chemical shift perturbations (Δδ) values (in ppm) were calculated using the following equation:
| (1) |
δ H and δ C are the chemical shifts for methyl 1H and 13C for a given state, respectively, and δ ref, H and δ ref, C are the corresponding values for the reference state.
4.2. Kinetic assays
Fluorescence assays were performed in a reaction mixture (50 μl total volume) using the Soxtide substrate—RKKYKFNC*DTERRRFL37 that bears a sulfonamide‐oxine (Sox) label at the −2 Cys (indicated by a “*”) relative to the phosphorylatable Thr (shown in the bold font and underlined). The reaction buffer contained 50 mM KCl, 10 mM MgCl2, 2 mM DTT, 40 μg/ml BSA, 1 mM EGTA, and 25 mM HEPES. All measurements were carried out at pH 6.8 and 30°C. The CaM concentration in the buffer ranged from 0 to 1,000 nM. Assays were initiated with the addition of a mixture containing ATP (100 μM), Soxtide (10 μM), and TR (2 nM). The extent of the reaction was monitored by measuring fluorescence emission at 482 nm (with excitation at 360 nm) every 60 s for a total of 2 hr. The effect of Ca2+ on the activity at varying CaM concentrations was examined by monitoring the fluorescence change in the presence of 1.15 mM CaCl2 (~150 μM free Ca2+) or in its absence. The resulting plots yielded the apparent reaction rate, k app (s−1) as the slope of the change in fluorescence with time through a linear least‐squares fit. Each slope was then plotted against CaM concentration, and the apparent affinity (K D, app) was determined by fitting to the quadratic velocity equation.40
Supporting information
Data S1: Supporting Information
ACKNOWLEDGMENTS
The authors thank Drs. Andrea Piserchio and Sebastien Alphonse (CCNY) for their careful and insightful critiques of the manuscript.
Lee K, Kumar EA, Dalby KN, Ghose R. The role of calcium in the interaction between calmodulin and a minimal functional construct of eukaryotic elongation factor 2 kinase. Protein Science. 2019;28:2089–2098. 10.1002/pro.3753
Present address
Kwangwoon Lee, Division of Genetics, Department of Medicine, Brigham and Women's Hospital; Department of Biological Chemistry and Molecular Pharmacology, Harvard Medical School, Boston, Massachusetts 02115.
Funding information American Heart Association, Grant/Award Number: 15PRE25760018; National Institute of General Medical Sciences, Grant/Award Number: R01 GM123252; NIH Office of the Director, Grant/Award Numbers: S10 OD016432, S10 OD018509; Welch Foundation, Grant/Award Number: F‐1390
Contributor Information
Kevin N. Dalby, Email: dalby@austin.utexas.edu.
Ranajeet Ghose, Email: rghose@ccny.cuny.edu.
REFERENCES
- 1. Schuller AP, Green R. Roadblocks and resolutions in eukaryotic translation. Nature Rev Mol Cell Biol. 2018;19:526–541. [DOI] [PMC free article] [PubMed] [Google Scholar]
- 2. Ryazanov AG, Davydova EK. Mechanism of elongation factor 2 (EF‐2) inactivation upon phosphorylation. Phosphorylated EF‐2 is unable to catalyze translocation. FEBS Lett. 1989;251:187–190. [DOI] [PubMed] [Google Scholar]
- 3. Ryazanov AG, Shestakova EA, Natapov PG. Phosphorylation of elongation factor 2 by EF‐2 kinase affects rate of translation. Nature. 1988;334:170–173. [DOI] [PubMed] [Google Scholar]
- 4. Nairn AC, Bhagat B, Palfrey HC. Identification of calmodulin‐dependent protein kinase III and its major Mr 100,000 substrate in mammalian tissues. Proc Natl Acad Sci U S A. 1985;82:7939–7943. [DOI] [PMC free article] [PubMed] [Google Scholar]
- 5. Ryazanov AG, Ward MD, Mendola CE, et al. Identification of a new class of protein kinases represented by eukaryotic elongation factor‐2 kinase. Proc Natl Acad Sci U S A. 1997;94:4884–4889. [DOI] [PMC free article] [PubMed] [Google Scholar]
- 6. Drennan D, Ryazanov AG. Alpha‐kinases: Analysis of the family and comparison with conventional protein kinases. Prog Biophys Mol Biol. 2004;85:1–32. [DOI] [PubMed] [Google Scholar]
- 7. Redpath NT, Price NT, Severinov KV, Proud CG. Regulation of elongation factor‐2 by multisite phosphorylation. Eur J Biochem. 1993;213:689–699. [DOI] [PubMed] [Google Scholar]
- 8. Stratton MM, Chao LH, Schulman H, Kuriyan J. Structural studies on the regulation of Ca2+/calmodulin dependent protein kinase II. Curr Opin Struct Biol. 2013;23:292–301. [DOI] [PMC free article] [PubMed] [Google Scholar]
- 9. Crivici A, Ikura M. Molecular and structural basis of target recognition by calmodulin. Annu Rev Biophys Biomol Struct. 1995;24:85–116. [DOI] [PubMed] [Google Scholar]
- 10. Tavares CDJ, Ferguson SB, Giles DH, et al. The molecular mechanism of eukaryotic elongation factor 2 kinase activation. J Biol Chem. 2014;289:23901–23916. [DOI] [PMC free article] [PubMed] [Google Scholar]
- 11. Dorovkov MV, Pavur KS, Petrov AN, Ryazanov AG. Regulation of elongation factor‐2 kinase by pH. Biochemistry. 2002;41:13444–13450. [DOI] [PubMed] [Google Scholar]
- 12. Wang X, Regufe da Mota S, Liu R, et al. Eukaryotic elongation factor 2 kinase activity is controlled by multiple inputs from oncogenic signaling. Mol Cell Biol. 2014;34:4088–4103. [DOI] [PMC free article] [PubMed] [Google Scholar]
- 13. Tavares CD, Giles DH, Stancu G, et al. Signal integration at elongation factor 2 kinase; the roles of calcium, calmodulin and Ser‐500 phosphorylation. J Biol Chem. 2017;292:2032–2045. [DOI] [PMC free article] [PubMed] [Google Scholar]
- 14. Kenney JW, Moore CE, Wang X, Proud CG. Eukaryotic elongation factor 2 kinase, an unusual enzyme with multiple roles. Adv Biol Regul. 2014;55C:15–27. [DOI] [PubMed] [Google Scholar]
- 15. Connolly E, Braunstein S, Formenti S, Schneider RJ. Hypoxia inhibits protein synthesis through a 4E‐BP1 and elongation factor 2 kinase pathway controlled by mTOR and uncoupled in breast cancer cells. Mol Cell Biol. 2006;26:3955–3965. [DOI] [PMC free article] [PubMed] [Google Scholar]
- 16. Leprivier G, Remke M, Rotblat B, et al. The eEF2 kinase confers resistance to nutrient deprivation by blocking translation elongation. Cell. 2013;153:1064–1079. [DOI] [PMC free article] [PubMed] [Google Scholar]
- 17. Smith EM, Proud CG. Cdc2‐cyclin B regulates eEF2 kinase activity in a cell cycle‐ and amino acid‐dependent manner. EMBO J. 2008;27:1005–1016. [DOI] [PMC free article] [PubMed] [Google Scholar]
- 18. Gildish I, Manor D, David O, et al. Impaired associative taste learning and abnormal brain activation in kinase‐defective eEF2K mice. Learning Mem. 2012;19:116–125. [DOI] [PMC free article] [PubMed] [Google Scholar]
- 19. Kavalali ET, Monteggia LM. Synaptic mechanisms underlying rapid antidepressant action of ketamine. Am J Psy. 2012;169:1150–1156. [DOI] [PubMed] [Google Scholar]
- 20. Li X, Alafuzoff I, Soininen H, Winblad B, Pei JJ. Levels of mTOR and its downstream targets 4E‐BP1, eEF2, and eEF2 kinase in relationships with tau in Alzheimer's disease brain. FEBS J. 2005;272:4211–4220. [DOI] [PubMed] [Google Scholar]
- 21. Chan AY, Soltys CL, Young ME, Proud CG, Dyck JR. Activation of AMP‐activated protein kinase inhibits protein synthesis associated with hypertrophy in the cardiac myocyte. J Biol Chem. 2004;279:32771–32779. [DOI] [PubMed] [Google Scholar]
- 22. Usui T, Okada M, Hara Y, Yamawaki H. Eukaryotic elongation factor 2 kinase regulates the development of hypertension through oxidative stress‐dependent vascular inflammation. Am J Physiol Heart Circ Physiol. 2013;305:H756–H768. [DOI] [PMC free article] [PubMed] [Google Scholar]
- 23. De Gassart A, Martinon F. Translating the anticancer properties of eEF2K. Cell Cycle. 2017;16:299–300. [DOI] [PMC free article] [PubMed] [Google Scholar]
- 24. Pott LL, Hagemann S, Reis H, et al. Eukaryotic elongation factor 2 is a prognostic marker and its kinase a potential therapeutic target in HCC. Oncotarget. 2017;8:11950–11962. [DOI] [PMC free article] [PubMed] [Google Scholar]
- 25. Flight MH. Mood disorders: Targeting protein synthesis for fast antidepressant action. Nature Rev Drug Discov. 2011;10:577. [DOI] [PubMed] [Google Scholar]
- 26. Russnes HG, Caldas C. eEF2K—a new target in breast cancers with combined inactivation of p53 and PTEN. EMBO Mol Med. 2014;6:1512–1514. [DOI] [PMC free article] [PubMed] [Google Scholar]
- 27. Lee K, Alphonse S, Piserchio A, et al. Structural basis for the recognition of eukaryotic elongation factor 2 kinase by calmodulin. Structure. 2016;24:1441–1451. [DOI] [PMC free article] [PubMed] [Google Scholar]
- 28. Will N, Lee K, Hajredini F, et al. Structural dynamics of the activation of elongation factor 2 kinase by Ca2+‐calmodulin. J Mol Biol. 2018;430:2802–2821. [DOI] [PMC free article] [PubMed] [Google Scholar]
- 29. Piserchio A, Will N, Giles DH, Hajredini F, Dalby KN, Ghose R. Solution structure of the carboxy‐terminal tandem repeat domain of eukaryotic elongation factor 2 kinase and its role in substrate recognition. J Mol Biol. 2019;431:2700–2717. [DOI] [PMC free article] [PubMed] [Google Scholar]
- 30. Tavares CDJCD, O'Brien JPJP, Abramczyk OO, et al. Calcium/calmodulin stimulates the autophosphorylation of elongation factor 2 kinase on Thr‐348 and Ser‐500 to regulate its activity and calcium dependence. Biochemistry. 2012;51:2232–2245. [DOI] [PMC free article] [PubMed] [Google Scholar]
- 31. de Diego I, Kuper J, Bakalova N, Kursula P, Wilmanns M. Molecular basis of the death‐associated protein kinase‐calcium/calmodulin regulator complex. Sci Signal. 2010;3(106):ra6. [DOI] [PubMed] [Google Scholar]
- 32. Alphonse S, Ghose R. Methyl NMR spectroscopy: Measurement of dynamics in viral RNA‐directed RNA polymerases. Methods. 2018;148:100–114. [DOI] [PubMed] [Google Scholar]
- 33. Ollerenshaw JE, Tugarinov V, Kay LE. Methyl TROSY: Explanation and experimental verification. Magn Reson Chem. 2003;41:843–852. [Google Scholar]
- 34. Ataman ZA, Gakhar L, Sorensen BR, Hell JW, Shea MA. The NMDA receptor NR1 C1 region bound to calmodulin: Structural insights into functional differences between homologous domains. Structure. 2007;15:1603–1617. [DOI] [PMC free article] [PubMed] [Google Scholar]
- 35. Devkota AK, Edupuganti R, Yan C, et al. Reversible covalent inhibition of eEF‐2K by carbonitriles. Chembiochem. 2014;15:2435–2442. [DOI] [PMC free article] [PubMed] [Google Scholar]
- 36. Diggle TA, Seehra CK, Hase S, Redpath NT. Analysis of the domain structure of elongation factor‐2 kinase by mutagenesis. FEBS Lett. 1999;457:189–192. [DOI] [PubMed] [Google Scholar]
- 37. Devkota AK, Warthaka M, Edupuganti R, et al. High‐throughput screens for eEF‐2 kinase. J Biomol Screen. 2014;19:445–452. [DOI] [PubMed] [Google Scholar]
- 38. Marlow MS, Dogan J, Frederick KK, Valentine KG, Wand AJ. The role of conformational entropy in molecular recognition by calmodulin. Nature Chem Biol. 2010;6:352–358. [DOI] [PMC free article] [PubMed] [Google Scholar]
- 39. Persechini A, Stemmer PM. Calmodulin is a limiting factor in the cell. Trends Cardiovasc Med. 2002;12:32–37. [DOI] [PubMed] [Google Scholar]
- 40. Morrison JF. Kinetics of the reversible inhibition of enzyme‐catalysed reactions by tight‐binding inhibitors. Biochim Biophys Acta. 1969;185:269–286. [DOI] [PubMed] [Google Scholar]
Associated Data
This section collects any data citations, data availability statements, or supplementary materials included in this article.
Supplementary Materials
Data S1: Supporting Information