

Abstract
This study was done to determine the degree of metals and heavy metals in some bee pollen sample as biological indicator for environmental pollution. Sample were collected from industrial, urban and agricultural areas of Jordan in year 2017. Eight metals (As, Cd, Cu, Mg, Pb, Ni, Se, and Zn) continents analyzed by using Inductively Coupled Plasma Optical Emission Spectrum, (ICP-OES).
Results were statistically interpreted by using ANOVA analysis. Metals content in bee pollen from Jordan and China were determined within the following ranges (minimum–maximum mg/kg); Cu (copper): 11.338–0.032, Zn (Zinc): 77.022–25.24, Ni (Nickel): 2.839 to <0.01, Se (Selenium): 3.03 to <0.04, Mg (Magnesium): 1575.19–641.388, Pb (Lead): 2.567 to <0.03, Cd (Cadmium): <0.005, As (Arsenic): <0.02. The results showed that there were no statistically significant differences among metals in the bee pollen. It has also found that bee pollen produced in Jordan may be a good source of some trace elements like Se and Mg and can be used as an environmental indicator and for quality control.
Keywords: Bee pollen, Heavy metals, Environmental indicator, ICP-OES, Quality control
1. Introduction
Metal always are emitted from great number of sources which contribute to metal loads in terrestrial and aquatic food chains. The spread of heavy metals on vegetables and fruits may directly end up into our food chain Honey bees gather pollen from the stamens of flower's pollen and sticks to the hairs of the bees that cover their bodies as the bees are sucking the nectar using a comb on their forelegs (Mutsaers et al., 2005). Pollution and toxic heavy metals had increased in the environment due to industrial development, and bees visits to the flowers and water resources, which are directly related to the environmental contaminations. Therefore, many scientists tended to use the honey bees and its products as a bio-indicator to evaluate the environmental systems status and the pollution in the surrounding area. The main factor in polluting the honey and its products by heavy toxic metals (Gergen et al., 2006). Bee pollen contains macronutrients such as (calcium, phosphorus, magnesium, sodium, and potassium) and micronutrients such as (iron, copper, zinc, manganese, silicon, and selenium) (Campos et al, 2008). Other mini-components are trace elements, vitamins, carotenoids, phenolic compounds, flavonoids, sterols and Terpenes (Mohdaly et al., 2015).
In Turkey, determination of some heavy metals (cadmium, lead and arsenic) level in bee pollen was determined using (ICP-OES) (Altunatmaz et al., 2017). Alnaggar et al. (2013) studied the possibility of using honey bees and to a lesser extent some of its products (pollen and honey) as biological indicators of the pollution of the environment with heavy elements. In southern Poland, it is has been found that honey products could be useful for controlling environmental pollution with minerals (Formicki et al., 2013). In another study in Brazil conducted by (Morgano et al., 2012), it was found that pollen could be contaminated with inorganic elements and could be used as a vital indicator. The results of the study showed that pollutants content was higher in pollen collected from urban areas compared to rural areas.
Propescu et al. (2010) found that the concentration of (Iron, Manganese, and Zinc) in pollen collected from urban and industrial sites was higher than the samples collected from non-industrial rural areas and that pollen could be used to monitor the levels of heavy metals in the environment. Determination of metal content in honey by atomic absorption and emission spectrometries has been also reported (Pohl, 2009). A published paper evaluated pollutants of different species under various environmental exposure conditions, the result showed that there is a significant difference between fresh pollen and urban pollen in terms of metal content in pollen. Concentrations of Pb, Zn and Cd reached 200% in urban pollen compared to fresh pollen (Kalbande et al., 2008). Lebedev and Murashova (2004) in their study in Switzerland confirmed that bees and its products are biological indicators of contamination of heavy elements, which are often contaminated by Lead in areas visited by bees. In Jordan a very little information is available on heavy metals determination in bee products. Atrouse et al. (2004), analysed the Jordanian honey of known origin for their physicochemical properties and heavy metals (Lead and Cadmium) including pollen identification
To our knowledge, there are no previous report for the determination of metals in Jordanian bee pollen and using it as a bio-indicator. The aim of this study was to determine some metals in selected types of bee pollen, collected from different regions of jordan in addition to assessing the use of bee pollen and bee bread as an environmental indicator.
2. Material and method
2.1. Sample collection
Twenty-two bee pollen samples were collected from March to October (the main honey flow season in Jordan), 2017 from different apiaries located in different geographical (Agricultural, desert and industrial) area of Jordan (Fig. 1) (Table 1). An average of 100 g of bee pollen samples was taken from each area. The samples were collected using pollen traps and after collection were transferred to a sterile plastic container and properly labeled by a unique. The collected pollen samples were kept in plastic containers and stored frozen at (−4 °C).
Fig. 1.
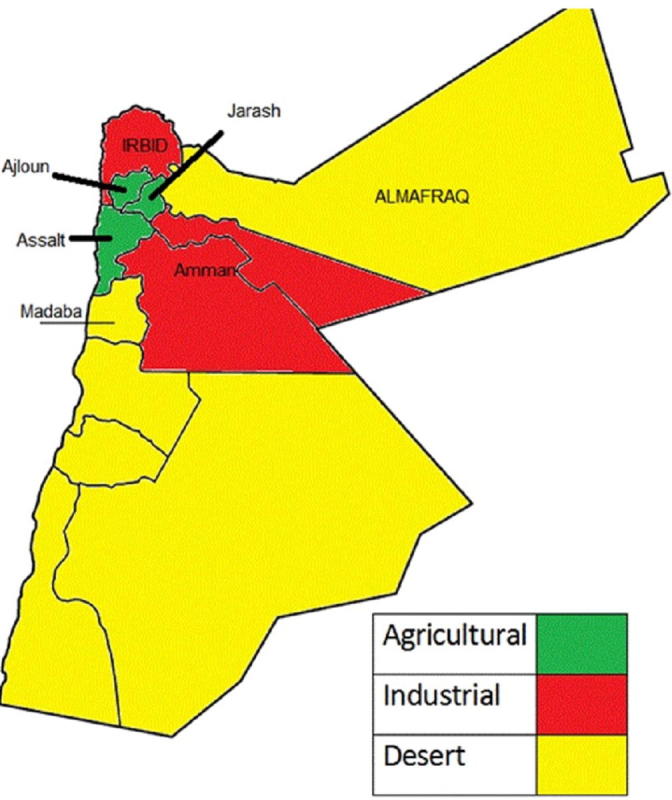
Map showing the bee pollen sample collection are from different geographical location in Jordan.
Table 1.
Location of sample collection.
| Sample No | Collection site of bee pollen | Area type | Category of sample based on origin area |
|---|---|---|---|
| 1 | Salt City | Agricultural | A |
| 2 | Southern Jordan Valley | Agricultural | A |
| 3 | Northern Jordan Valley | Agricultural | A |
| 4 | Abu Alanda | Industrial | I |
| 5 | Amman city, Airport road-Giza- | Desert | D |
| 6 | Ajloun | Agricultural | A |
| 7 | Jerash | Agricultural | A |
| 8 | Irbid-in the North- | Industrial | I |
| 9 | Marka –Amman- | Industrial | I |
| 10 | China-imported- | Industrial | I |
| 11 | Ajloun | Agricultural | A |
| 12 | Ajloun | Agricultural | A |
| 13 | Madaba | Desert | D |
| 14 | Southern Jordan valley | Agricultural | A |
| 15 | China-imported- | Industrial | I |
| 16 | Amman | Industrial | I |
| 17 | Ajloun | Agricultural | A |
| 18 | Area between Ajloun and Jerash | Agricultural | A |
| 19 | Amman | Industrial | I |
| 20 | North Irbid | Industrial | I |
| 21 | Irbid | Industrial | I |
| 22 | Irbid | Industrial | I |
2.2. Instrumentation
The samples analysis has been implemented by using the analytical method of Inductively Coupled Plasma Optical Emission Spectrometer, (ICP-OES) (Model: VISTA-PROCCD Simultaneous ICP-OES, Varian, Australia). Relative humidity was kept 21.0–21.0% and distilled water has been used as blank.
2.3. Sample preparation and digestion
0.5 g of each sample was weighed using a sensitive scale analytical balance and kept in a clean 25 ml Erlenmeyer flask. After adding a volume of 5.0 ml Nitric acid (HNO3), the flask was cover and kept on heater for 15–20 min till the mixture started boiling until became rosy color. The mixture was allowed to cool at room temperature and then 3.0 ml of Perchloric acid (HClO4) were added gradually in three steps (1.0 ml in each step), and heated until the color dis appeared. Finally, the volume was completed up to 20.0 ml with distilled water. A blank sample was prepared under the same conditions applied for the digested samples with slight modification (Altunatmaz et al., 2017).
2.4. Statistical analysis
Means and Standard deviation, one-way ANOVA test was used, which is supported with figures in the data analysis. Data were analyzed using SPSS. All samples were transferred from mg/L to mg/kg using the following equation:
3. Result and discussion
3.1. Minor elements
Copper(Cu) is one of the several trace heavy elements essential for life. The acceptable limit of Cu in pollen is 0.00–20.0 mg/Kg (Harmanescu et al., 2007). The results showed that the highest concentration of Cu (11.388 mg/Kg) was found in the area of Ajloun and Jerash, while thelowest was in Salt City, (0.032 mg/Kg), both of the areas are agricultural areas. Concentrations range of Cu in this study (0.032–11.388 mg/Kg) do not differ significantly from those studied in Turkey (Alttunatmaz et al., 2017), in which the concentration ranged between (3.728 ppm and 14.994 ppm). In a similar study in Romania (Harmanescu et al, 2007), the concentration ranged between 11.1 ppm and 13.8 ppm, it indicated that the values of Cu content in bee pollen were within the acceptable limits (Table 2). The result showed that there was a variance in the Cu in the bee pollen according to the area type, Mean of Cu in Agricultural area was (4.47), in the Industrial area (4.58) and in the desert area (5.34). It shows the significant differences in Cu content in different geographical area.
Table 2.
The amount of some minor elements, Cu, Zn, Ni, Se and Mg (mg/Kg) in the Pollen sample collected from different areas.
| No. | Sample | Area | Type of Area | Cu | Zn | Ni | Se | Mg |
|---|---|---|---|---|---|---|---|---|
| 1 | Pollen 1 | Salt City | Agricultural | 0.032 | 28.233 | <0.01 | <0.04 | 991.308 |
| 2 | Pollen 2 | Southern Jordan Valley | Agricultural | 0.057 | 77.022 | 0.57 | <0.04 | 825.976 |
| 3 | Pollen 3 | Northern Jordan Valley | Agricultural | 0.19 | 33.482 | <0.01 | 3.03 | 1070.131 |
| 4 | Pollen 4 | Abu Alanda | Industrial | 0.061 | 50.236 | 0.492 | <0.04 | 1061.612 |
| 5 | Pollen 5 | Amman city, Airport road-Giza- | desert | 0.082 | 32.615 | 0.814 | 1.752 | 1061.896 |
| 6 | Pollen 6 | Ajloun | Agricultural | 0.088 | 32.374 | 0.197 | <0.04 | 1185.52 |
| 7 | Pollen 7 | Jerash | Agricultural | 0.107 | 40.815 | 0.055 | <0.04 | 1307.912 |
| 8 | Pollen 8 | Irbid-in the North- | Industrial | 0.102 | 43.38 | <0.01 | <0.04 | 1575.912 |
| 9 | Pollen 9 | Marka –Amman- | Industrial | 0.104 | 35.549 | 0.022 | 2.215 | 1283.408 |
| 10 | Pollen 10 | China-imported- | Iindustrial | 0.101 | 30.88 | 1.095 | <0.04 | 694.34 |
| 11 | Pollen 11 | Ajloun | Agricultural | 8.547 | 25.24 | 0.687 | <0.04 | 797.705 |
| 12 | Pollen 12 | Ajloun | Agricultural | 8.235 | 28.663 | 0.809 | <0.04 | 1059.699 |
| 13 | Pollen 13 | Madaba | Desert | 10.605 | 31.118 | 1.542 | <0.04 | 1235.078 |
| 14 | Pollen 14 | Southern Jordan valley | Agricultural | 7.197 | 35.988 | 1.057 | <0.04 | 1023.952 |
| 15 | Pollen 15 | China-imported- | Industrial | 7.096 | 27.77 | 0.78 | <0.04 | 1283.702 |
| 16 | Pollen 16 | Amman | Industrial | 9.955 | 36.87 | 1.35 | <0.04 | 1456.801 |
| 17 | Pollen 17 | Ajloun | Agricultural | 8.901 | 29.099 | 0.935 | <0.04 | 1166.26 |
| 18 | Pollen 18 | Area between Ajloun and Jerash | Agricultural | 11.388 | 47.01 | 1.603 | <0.04 | 1509.801 |
| 19 | Pollen 19 | Amman | Industrial | 8.387 | 35.94 | 2.839 | <0.04 | 1295.946 |
| 20 | Pollen 20 | North Irbid | Industrial | 7.971 | 33.227 | 0.731 | <0.04 | 1337.412 |
| 21 | Pollen 21 | Irbid | Industrial | 6.896 | 29.619 | 0.803 | <0.04 | 1172.868 |
| 22 | Pollen 22 | Irbid | Industrial | 5.109 | 26.423 | <0.01 | <0.04 | 641.388 |
Zinc(Zn) is one of the constituent of about 300 enzymes and proteins that participate in all major metabolic processes. The accepted limit for Zinc in bee pollen is 60.0 mg/Kg, (Harmanescu et al., 2007). The results showed that the concentration of Zn in of some samples were below the accepted limit except the pollen sample no. 2, in which it was 77.022 mg/Kg. this value was higher than the accepted limit (0.00–60.0 mg/Kg). Lowest Zn concentration has been found in Pollen sample no. 11 (25.24 mg/Kg) (Table 2). The Zn concentration range in this study were between 25.24 mg/Kg and 77.022 mg/Kg. These results were similar to some previous study has been done in Turkey (Alttunatmaz et al., 2017). In Turkey concentrations of Zn in pollen ranged between 14.832 ppm and 39.079 ppm. Our data also supported by the study done in Romania, in which concentrations ranged between 11.1 ppm and 13.8 ppm (Harmanescu et al., 2007). It indicated that the Zn content in bee pollen were within the acceptable limits of 0.00–60.0 mg/Kg. The result showed from Table 2 that there was a variance in the Zn in the bee pollen collected from different geographical area, Mean of Zn in Agricultural area was 37.79, in Industrial area 34.99 and in the desert area 31.87.
Nickel (Ni) is an essential element for human nutrition. The Nickel requirement of humans has been estimated to be 25–35 μg/day. Excessive soluble Ni are hepatotoxic and nephrotoxic so lots of countries restricted the limits between 0.05 and 1 mg/Kg, (Harmanescu et al., 2007). Our results showed that the concentration of Ni was highest in the pollen samples No. 10, 13, 14, 16, 18, and 19 collected from agricultural, industrial and desert areas. The concentration of Ni in these samples were found 1.095 mg/Kg, 1.542 mg/Kg, 1.05 mg/Kg, 1.350 mg/Kg, 1.603 mg/Kg and 2.809 mg/Kg respectively. These values were higher than the acceptable limit (0.05–1.00 mg/Kg). The lowest values of Ni were found in sample No. 1, 3, 8 and 22 (<0.01 mg/Kg) (Table 2). In our study the concentration ranges between 0.01 mg/kg and 2.809 mg/Kg. These results were similar to the earlier study has been done in Turkey and Romania (Altunatamaz et al., 2017, Harmanescu et al., 2007) respectively. Our results indicated that the values of Ni content in bee pollen were within the acceptable limits of 0.05–1.0 mg/Kg except samples No. 10, 13, 14, 16, 18 and 19. It may be due to fumes of factories, chemicals, iron and steel factories. Mean value of Ni in Agricultural area was (0.5926), in the Industrial area (0.8128) and in the desert area (1.1780).
Selenium (Se) is an essential metal, considered anti-oxidant and supplemental food. Excessive amounts can be toxic to the life of an organism. It has no environmental impact on pollution. The acceptable limit is 60–120 mg/Kg (Alttunatmaz et al., 2017). The results showed that sample from Northern Jordan Valley, Se content was 3.03 mg/Kg, sample from Marka-Amman 2.215 mg/Kg and sample from Amman city, airport road (Giza area) was 1.752 mg/Kg (Table 2). Samples no. 1, 2, 3, 4, 6, 7, 8, 10 to 22 contained low amount of Se (<0.04). The concentration of Se in this study were ranged between <0.04 mg/kg and 2.215 mg/Kg. Our results were according to the previous studies done in Turkey (Alttunatmaz et al., 2017). Mean value of Se in Agricultural area was 0.330, in the Industrial area was 0.249 and in the desert area it was the highest (0.891).
Magnesium (Mg) is an essential element for humans as well as plant physiology. It is present in many enzymes and involved in the structure of proteins, lipids and carbohydrates. Its deficiency in humans can cause muscle spasms. It has been associated with many cardiovascular diseases such as high blood pressure. It has no negative impact on environmental pollution. The acceptable limit is 350 mg/day for men and 300 mg/day for women (Harmanescu et al., 2007). Our results showed that the concentration of Mg was higher than the accepted limit in all samples and it ranged between 641.388 mg/Kg and 1575.19 mg/Kg. In a similar study in Romania the concentration of Mg was found very little and it was in between 702 ppm and 965 ppm, (Harmanescu et al., 2007). Our result showed from Table 2 that there is a variance in the Mg concentration as per the type of sample collecting area, Mean value of Mg in Agricultural area was 1093.826, in the Industrial area was 1180.338 and in the desert area was (1148.487).
3.2. Toxic and trace elements
Lead (Pb) is not an essential element and highly toxic for organisms. This element is considered as one of the major causes of environmental pollution. The acceptable limit of Pb is below 1.0 mg/Kg (Harmanescu et al., 2007). Our results showed that in most of sample Pb content was within the acceptable limit except samples no. 15 and 18. In these sample the Pb value was 2.567 mg/Kg and 2.261 mg/Kg respectively. In our samples the concentration of Pb ranges between 0.03 mg/Kg and 2.567 mg/Kg (Table 3). In some previous study done in Turkey and Romania the value was in the acceptable range and it was (0.000–0.479 ppm) and (0.01–0.40 ppm) respectively (Altunatamaz et al., 2017, Harmanescu et al., 2007). The mean value of Pb in Agricultural area was 0.326, in the Industrial area was 0.358 and in the desert area was 0.020.
Table 3.
The amount of some toxic and trace elements, Pb, Cd and As (mg/Kg) in the Pollen sample collected from different areas.
| No. | Sample | Area | Type of Area | Pb | Cd | As |
|---|---|---|---|---|---|---|
| 1 | Pollen 1 | Salt City | Agricultural | 0.836 | <0.005 | <0.02 |
| 2 | Pollen 2 | Southern Jordan Valley | Agricultural | 0.03> | <0.005 | <0.02 |
| 3 | Pollen 3 | Northern Jordan Valley | Agricultural | 0.03> | <0.005 | <0.02 |
| 4 | Pollen 4 | Abu Alanda | Industrial | 0.03> | <0.005 | <0.02 |
| 5 | Pollen 5 | Amman city, Airport road-Giza- | desert | 0.03> | <0.005 | <0.02 |
| 6 | Pollen 6 | Ajloun | Agricultural | 0.03> | <0.005 | <0.02 |
| 7 | Pollen 7 | Jerash | Agricultural | 0.03> | <0.005 | <0.02 |
| 8 | Pollen 8 | Irbid-in the North- | Industrial | 0.03> | <0.005 | <0.02 |
| 9 | Pollen 9 | Marka –Amman- | Industrial | 0.03> | <0.005 | <0.02 |
| 10 | Pollen 10 | China-imported- | Iindustrial | 0.850 | <0.005 | <0.02 |
| 11 | Pollen 11 | Ajloun | Agricultural | 0.03> | <0.005 | <0.02 |
| 12 | Pollen 12 | Ajloun | Agricultural | 0.03> | <0.005 | <0.02 |
| 13 | Pollen 13 | Madaba | Desert | 0.03> | <0.005 | <0.02 |
| 14 | Pollen 14 | Southern Jordan valley | Agricultural | 0.03> | <0.005 | <0.02 |
| 15 | Pollen 15 | China-imported- | Industrial | 2.567 | <0.005 | <0.02 |
| 16 | Pollen 16 | Amman | Industrial | 0.03> | <0.005 | <0.02 |
| 17 | Pollen 17 | Ajloun | Agricultural | 0.03> | <0.005 | <0.02 |
| 18 | Pollen 18 | Area between Ajloun and Jerash | Agricultural | 2.261 | <0.005 | <0.02 |
| 19 | Pollen 19 | Amman | Industrial | 0.03> | <0.005 | <0.02 |
| 20 | Pollen 20 | North Irbid | Industrial | 0.03> | <0.005 | <0.02 |
| 21 | Pollen 21 | Irbid | Industrial | 0.03> | <0.005 | <0.02 |
| 22 | Pollen 22 | Irbid | Industrial | 0.03> | <0.005 | <0.02 |
Cadmium (Cd) is a trace metal and is essential for some enzymatic activities. It is highly toxic to the organism and the acceptable limit is ranged between 0.05 and 1.00 mg/Kg (Harmanescu et al., 2007). The values of Cd content in all the collected samples were within the acceptable limits (<0.005 mg/Kg) (Table 3). Our results were similar to the previous study done in Turkey and Romania (Altunatamaz et al., 2017, Harmanescu et al., 2007). The mean value of Cd in Agricultural area was 0.0027, in the Industrial area was 0.0024 and in the desert area was 0.0040.
Arsenic (As) is a trace metal that is not an essential for organisms as it is highly toxic. The acceptable limit of As is 0.05–1.00 mg/Kg (Alttunatmaz et al., 2017). The values of As content in bee pollen were within the acceptable limits (<0.02 mg/Kg). It was found that concentrations of this study do not differ from those which done in Turkey (Alttunatmaz et al., 2017) and all the samples were within the accepted international limits. The result showed that there is no variance in the As in the bee pollen samples. The mean of As in all Agricultural areas was (0.01).
4. Conclusion
The study concludes that the concentrations of Zinc, Lead and Nickel are highest at the agricultural and industrial areas. The highest concentrations of Zinc, Lead and Nickel were (77.022 mg/Kg), (2.567 mg/Kg) and (2.839 mg/Kg) respectively. It was also found that in some of the samples concentrations of Magnesium and Selenium were very high. The highest level of Magnesium was (1575.912 mg/Kg) and the highest selenium level was (3.03 mg/Kg). Pollen collected by bees can be used as bio indicator of the environmental pollution by heavy metals. Moreover, bee pollen is a significant source of magnesium and selenium.
Footnotes
Peer review under responsibility of King Saud University.
Contributor Information
Amal Abdullah Al-Abbadi, Email: a.abbadi@bau.edu.jo.
Eyad S.M. Abu-Nameh, Email: abunameh@bau.edu.jo.
References
- Al Naggar A., Naiem A., Seif I., Mona H. Honey bees and their products as a bio-indicator of environmental pollution with heavy metals. Harum. 2013;13–26:10–20. [Google Scholar]
- Altunatamaz S., Tarhan D., Aksu F., Barutcu B., OR, M., Mineral element and heavy metal (cadmium, lead and arsenic) levels of bee pollen in Turkey. Food Sci. Technol. 2017 Print version ISSN 0101-2061. [Google Scholar]
- Atrous O., Al-Oran S., Al-Abbadi S. Chemical analysis and identification of pollen Grains different Jordanian Honey samples. Int. J. Food Sci. Technol. 2004;39:413–417. [Google Scholar]
- Campos M., Bogdanov S., Almeida-Muradian L., Szczesna T., Mancebo Y., Frigerio C., Ferreira F. Pollen composition and standardization of analytical methods. J. Apicult. Res. Bee World. 2008;47(2):156–163. [Google Scholar]
- Formicki G., Greń A., Stawarz R., Zyśk B., Gał A. Metal contention honey, propolis, wax, and bee pollen and implications for metal pollution monitoring. Polish J. Environ. Stud. 2013;22:99–106. [Google Scholar]
- Gergen I., Gogoasa I., Dragan S., Moigradean D., Harmanescu M. Heavy Metal Status in Fruits and Vegetables from a non-polluted Area of Romania (Banta County) In: Garban Z., Dragan P., editors. Metal Element in Environmental, and Medicine and Biology. Publishing House Eurobit; Timisoara: 2006. pp. 149–165. [Google Scholar]
- Harmanescu M., Popovici D., Gergen I. Mineral micronutrients composition of Bee's. J. Agroalimentary Process. Technol. 2007:175–182. [Google Scholar]
- Kalbande D., Dhadse S., Chaudhari P., Wate S. Biomonitoring of heavy metals by pollen in urban environment. Environ. Monitor. Assess. 2008;138(1-3):233–238. doi: 10.1007/s10661-007-9793-0. [DOI] [PubMed] [Google Scholar]
- Lebedev V., Murashova E. Ekologicheskaja Cistota Produktov Pcelovodstvoch. Pcelovodstvo. 2004;82:42–44. [Google Scholar]
- Mohdaly A., Mahmoud A., Roby M., Smetanska I., Ramadan M. Phenolic extract from propolis and bee pollen composition, antioxidant and antibacterial activities. J. Food Biochem. 2015:1745–4514. [Google Scholar]
- Morgano M., Martins M., Rabonato L., Milani F., Yotsuyanagi K., Rodriguezamaya D. A comprehensive investigation of the mineral composition of brazilian bee pollen: geographic and seasonal variations and contribution to human diet. J. Brazil. Chem. 2012:727–736. [Google Scholar]
- Mutsaers, M., Blitterswijk, H., Leven, L., Kerkvliet, J., Waerdt, J., (2005). Bee Products, first ed., 29–32.
- Pohl P. Determination of metal content in honey by atomic absorption and emission spectrometry's. Trends Anal. Chem. 2009;28(1) Trends. [Google Scholar]
- Popescu V., Dima G., Dinu S. The content of heavy metals in pollen from Dambovita region. J. Sci. Arts. 2010:171–174. [Google Scholar]
Further reading
- Adeloju B. University of Western Sydney; Nepean, Kings wood 2 750, Australia: 1989. Comparison of Some Wet Digestion and Dry Ashing Methods for Voltammetric Trace Element Analysis, Centre for Industrial Research and Advanced Technology. [Google Scholar]
- Batsala M., Chandu B., Sakala B., Name S., Domatoti S. Inductively Coupled Plasma Mass Spectrometry (ICP-MS) Int. J. Res. Pharm. Chem. Bee Product Sci. 2012;2(3):671–680. [Google Scholar]
- Bibi S., Husain S., Malik R. Pollen analysis and heavy metals detection in honey samples from seven selected countries. Pakistan J. Bot. 2008;40(2):507–516. [Google Scholar]
- Bogdanov S. Contaminants of bee products. Apidologie. 2006;37:1–18. [Google Scholar]
- Bonvhi J., Torrennto M., Lovente E. Evaluation of polyphenolic and flavonoid compounds in honeybee-collected pollen produced in Spain. J. Agric. Food Chem. 2001;49(4):1848–1853. doi: 10.1021/jf0012300. [DOI] [PubMed] [Google Scholar]
- Conti E., Botrè F. Honey bees, and their products as potential bio-indicators of heavy metals contamination. J. Environ. Monitor. Assessm. 2001;69:267–282. doi: 10.1023/a:1010719107006. [DOI] [PubMed] [Google Scholar]
- Dima G., Popescu I., Dinu S., Niţescu I., Ştirbescu R. Heavy metals in pollen samples collected from the Dambovita county analysed by EDXRF method. Romania J. Phys. 2012:1411–1416. [Google Scholar]
- Franco, G. (1999). Tabela De ComposiçãoQuímica Dos Alimentos. 9. Ed. São paulo: atheneu, 307.
- Guidance for Industrial, Bioanalyticalmethod. (2001), U.S. Department of Health and Human Services, Food and Drug administration, USA, 2–18.
- Korn M., Morte E., Santos D., Castro J., Barbosa J., Korn M. A review. Appl. Spectrosc. Rev. 2008;43(2):67–92. [Google Scholar]
- Mejias M., Montenegro G. The antioxidant activity of chilean honey and bee pollen produced in the Liaima Volcano's Zone. J. Food Qual. 2012;35(5):315–323. [Google Scholar]
- Porrini C., Sabatini A., Girotti S., Ghini S., Medrzycki P., Grillenzoni F., Bortolotti L., Gattavecchia E., Celli G. Honey bees and bee products as monitors of the environmental contamination. Apiacta. 2003;38:63–70. [Google Scholar]