

Abstract
Scope
Insulin resistance (IR) and inflammation are hallmarks of type 2 diabetes (T2D). The nod‐like receptor pyrin domain containing‐3 (NLRP3) inflammasome is a metabolic sensor activated by saturated fatty acids (SFA) initiating IL‐1β inflammation and IR. Interactions between SFA intake and NLRP3‐related genetic variants may alter T2D risk factors.
Methods
Meta‐analyses of six Cohorts for Heart and Aging Research in Genomic Epidemiology Consortium (n = 19 005) tested interactions between SFA and NLRP3‐related single‐nucleotide polymorphisms (SNPs) and modulation of fasting insulin, fasting glucose, and homeostasis model assessment of insulin resistance.
Results
SFA interacted with rs12143966, wherein each 1% increase in SFA intake increased insulin by 0.0063 IU mL−1 (SE ± 0.002, p = 0.001) per each major (G) allele copy. rs4925663, interacted with SFA (β ± SE = −0.0058 ± 0.002, p = 0.004) to increase insulin by 0.0058 IU mL−1, per additional copy of the major (C) allele. Both associations are close to the significance threshold (p < 0.0001). rs4925663 causes a missense mutation affecting NLRP3 expression.
Conclusion
Two NLRP3‐related SNPs showed potential interaction with SFA to modulate fasting insulin. Greater dietary SFA intake accentuates T2D risk, which, subject to functional validation, may be further elaborated depending on NLRP3‐related genetic variants.
Keywords: Cohorts for Heart and Ageing Research in Genomic Epidemiology consortium, genome‐wide interaction studies, insulin resistance, meta‐analyses, NLRP3 inflammasomes, saturated fats
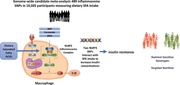
The NLRP3 inflammasome is a metabolic sensor activated by saturated fatty acids initiating IL‐1β inflammation and insulin resistance. A genome‐wide candidate meta‐analysis of NLRP3 genetic variants in 19 005 participants highlights two NLRP3 single‐nucleotide polymorphisms that interact with dietary saturated fat to increase insulin concentrations. Identifying inflammatory gene–nutrient interactions may facilitate identification of individuals at high type 2 diabetes risk.
1. Introduction
The rising prevalence of type 2 diabetes (T2D) has become a worldwide public health concern.1 The increase in T2D may be attributable to recent changes in lifestyle including the adoption of Western style diets high in saturated fats. Chronic low grade inflammation has been widely implicated in the progression of T2D risk factors such as hyperglycemia, hyperinsulinemia, and insulin resistance (IR).2, 3, 4, 5, 6 Immune cells such as macrophages induce inflammation by recognizing a wide variety of pathogen or damage‐associated molecular patterns (P/DAMPS) via innate immune sensors, toll‐like receptors (TLR) or nod‐like receptors (NLR).7 Saturated fatty acids (SFA) and their metabolites and ceramides and diacylglycerol can activate TLRs and NLRs, initiating a pro‐inflammatory response.2, 8, 9, 10, 11, 12 Dietary saturated fats induce a pro‐inflammatory response concurrent with IR in humans and hence play a key role in the pathogenesis of T2D.13, 14, 15, 16
Recent identification of the nod‐like receptor pyrin domain containing‐3 (NLRP3) inflammasome has established a mechanistic link between SFA and inflammation. The NLRP3 inflammasome is an important multi‐protein complex that functions as a metabolic stress sensor to initiate IL‐1β‐mediated inflammation.17, 18, 19, 20 Several studies using genetically modified mouse models which lack components of the NLRP3 inflammasome (NLRP3, caspase‐1, apoptosis‐associated speck‐like protein containing a CARD, IL‐1RI) provide mechanistic evidence that NLRP3 inflammasome activation induces metabolic inflammation and IR.18, 19, 20, 21, 22 Results from the recent CANTOS (Canakinumab Anti‐Inflammatory Thrombosis Outcomes Study) trial showed that inhibiting NLRP3/IL‐1β with therapeutic antibody canakinumab significantly reduced inflammation and cardiovascular events in patients with cardiovascular disease risk, 40% of which had diabetes.23 In obese humans with T2D, caloric restriction and exercise‐mediated weight loss reduces NLRP3 inflammasome expression in adipose tissue and improves insulin sensitivity.18 In myeloid cells from T2D patients, NLRP3 inflammasome expression and IL‐1β secretion was upregulated at baseline. However, following 2 weeks of anti‐diabetic medication metformin, IL‐1β production was reduced.24 Importantly, SFAs act as a NLRP3 trigger, priming and activating IL‐1β leading to IR, whereas unsaturated fatty acids do not.19, 25, 26, 27 Hence, the role of dietary fat in modulating NLRP3 activity is of current interest for T2D etiology.
While prospective evidence in humans strongly supports the negative effects of SFA on inflammation and IR,28, 29, 30 little is known regarding NLRP3‐related genetic variants and their interaction with an individual's dietary and metabolic exposure and response to SFA. Identifying inflammatory gene–nutrient interactions may facilitate identification of individuals at high T2D risk. Eventually, this may lead to applying targeted dietary recommendations to individuals who will respond most effectively to dietary intervention.31 The Genetics of Lipid Lowering Drugs and Diet Network (GOLDN) study demonstrated important interactions between IL‐1β genetic variants and polyunsaturated fats to decrease the risk of metabolic syndrome.32 Complement component 3 (C3) is an innate immune biomarker with distinct sensitivity to SFA. High dietary SFA intake further accentuates the inflammatory impact of both circulating C3 and C3 genotype to augment IR.33, 34 Additionally, the combination of IL‐6, lymphotoxin‐α, and tumor necrosis factor‐α inflammatory risk genotypes interact with plasma fatty acid status to increase metabolic syndrome risk.35 Polymorphisms in the NLRP3 gene have shown associations with T2D;36, 37, 38, 39, 40, 41 however, the role of diet in these associations has not yet been investigated.
Based on the existing evidence, our hypothesis is that altering dietary SFA intake may modulate T2D risk through interactions with NLRP3 inflammasome–related genetic variants. To address this premise, we examined 489 SNPs within 12 candidate genes related to the NLRP3 inflammasome, for interactions with dietary SFA intake, and quantified the extent to which these interactions can modify glycemic outcomes. We performed interaction analyses in 19 005 individuals from six independent U.S. and European cohorts participating in the Cohorts for Heart and Ageing Research in Genomic Epidemiology (CHARGE) consortium.
2. Experimental Section
2.1. Cohorts
The present study was a collaboration of investigators from U.S. and European cohort studies participating in the Nutrition Working Group and Diabetes‐Glycemia Working Group of the CHARGE consortium. Contributing cohorts included the Netherlands Epidemiology of Obesity study (NEO), Cardiovascular Health Study (CHS), Cardiovascular Risk in Young Finns Study (YFS), Framingham Heart Study (FHS), Rotterdam Study (RS), and The Hellenic Study of Interactions between SNPs and Eating in Atherosclerosis Susceptibility (THISEAS). Each of the six contributing cohorts executed analyses locally according to a pre‐specified analysis plan and shared summary statistics for meta‐analyses. The six cohorts, providing results from up to 19 005 adults per analysis, are described in Table 1. This analysis was restricted to White participants, and free from prevalent diabetes mellitus (as defined by self‐reported diabetes, fasting glucose >7 mmol L−1, or use of diabetic medication). Details on the design of each study are described in Section S1, Supporting Information. All studies were conducted in accordance to the Helsinki Declaration of 1975 as revised in 1983. Each participating study had local institutional or national review board approval, and written informed consent was obtained from all participants.
Table 1.
Description of six participating cohorts from the CHARGE Consortium (n = 19005)
| Abbreviation | Reference | Region | Sample size | Age [years] | Sex % female | |
|---|---|---|---|---|---|---|
| Cohort | ||||||
| Netherlands Epidemiology of Obesity Study | NEO | 65 | Northern Europe | 5071 | 55.8 ± 5.9 | 53.1 |
| Cardiovascular Health Study | CHS | 66 | United States | 2746 | 72.3 ± 5.4 | 62.2 |
| Cardiovascular Risk in Young Finns Study | YFS | 67 | Northern Europe | 1651 | 37.8 ± 3.9 | 55.7 |
| Framingham Heart Study | FHS | 68 | United States | 5786 | 45.9 ± 11.5 | 54.7 |
| Rotterdam Study I | RS | 69 | Northern Europe | 2507 | 69.5 ± 9.3 | 58.7 |
| The Hellenic Study of Interactions between SNPs and Eating in Atherosclerosis susceptibility | THISEAS | 70 | Greece | 1244 | 58.0 ± 14.3 | 45.3 |
2.2. Dietary Assessment and Body Mass Index
Habitual dietary intake data were collected from validated food frequency questionnaires (Table S1, Supporting Information). The type of food‐frequency questionnaire used in each cohort differed slightly to capture the dietary habits of the population of interest. The current analysis focused on SFA intake as a percentage of total energy intake (%SFA). Body mass index (BMI) was calculated from measured weight (kg) and height (m)2.
2.3. Genotyping, Fasting Glucose and Insulin Quantification, and Homeostasis Model Assessment of Insulin Resistance Calculations
Cohort‐specific methods for genotyping and fasting glucose and insulin quantification are described in Table S2, Supporting Information. Fasting glucose and insulin were quantified by enzymatic methods and radioimmunoassay, respectively. Homeostasis Model Assessment of Insulin Resistance (HOMA‐IR) was calculated as fasting insulin (µU mL−1) × fasting glucose (mmol L−1)/22.5. The 489 SNPs used in the present analysis were selected using 1000 genomes based on their location within or in surrounding regulatory regions of 12 candidate genes associated with the NLRP3 inflammasome (NLRP3, IL‐1RI, IL‐18RI, IL‐1α, IL‐1β, IL‐1RN, MYD88, nuclear factor κ B [NFκB], TLR4, Caspase‐1, IL‐18, PYCARD) listed in Table S3, Supporting Information. SNPs with a minor allele frequency (MAF) of >15% and a low level of linkage disequilibrium (LD r2 <0.8) were chosen for analysis.
2.4. Statistical Analysis
Glucose was analyzed without transformation and insulin and HOMA‐IR were natural log (ln) transformed before analysis. Coefficients from regression analyses are presented for (ln)insulin and (ln)HOMA‐IR. For descriptive purposes, cohort mean insulin and HOMA‐IR concentrations were presented as geometric means with 95% confidence intervals (C.I.).
2.5. Cohort‐Specific Analysis
Each cohort performed a linear regression model to examine the interaction between dietary SFA and candidate SNPs for three metabolic traits (fasting glucose, fasting insulin, and HOMA‐IR) as outcomes. For interaction analyses, “dietary SFA” refers to energy intake from SFA as percentage of total energy as a continuous variable. Each cohort provided β‐coefficients, SEs, and p‐values for the following linear regression models: 1) interactions between %SFA and 489 SNPs for fasting glucose concentrations, 2) interactions between %SFA and 489 SNPs for fasting insulin concentrations, and 3) interactions between %SFA and 489 SNPs for HOMA‐IR concentrations. Age, sex, BMI, total energy intake (kcal per day), and population specific variables (field center, principle component analysis) were included in each linear regression model as covariates, and a random effect was included to account for family structure when appropriate. Individuals were excluded from this study for the following reasons; missing data on genotype, dietary assessment and/or outcome measures, <18 years of age, diagnosed diabetes, pregnancy, or non‐European ancestry.
2.6. Meta‐Analysis
Summary statistics from each cohort were combined using inverse variance weighted fixed effects meta‐analysis with METAL software to analyze main effects (SNP and SFA) and interactions (SNP × SFA). For each SNP, an overall z‐statistic and p‐value were calculated. Heterogeneity across studies was tested by using Cochran's Q statistic and quantified by the I2 statistic.42 All interaction analyses with moderate heterogeneity (I2 >30%) were further assessed for potential sources of heterogeneity by meta‐regression analysis. Meta‐regression analysis was conducted using the metafor package in R 3.21 (http://www.R-project.org/). Each cohort had a number of missing SNPs from the list of 489 SNPs; therefore, a total of 401 SNPs with complete genotypic counts were available for meta‐analyses. Bonferroni correction was set at p < 0.0001 (p = 0.05/401). SNPs of interest were investigated for functionality using publically available annotation resources.43, 44
3. Results
3.1. Participating CHARGE Cohorts Demonstrate a Heterogeneous Population
A total of 19 005 non‐diabetic participants from six US and European cohorts were included in this analysis (Table 1). Participants were aged between 38 and 72 years, and there was a higher percentage of females within each cohort, with the exception of THISEAS. General characteristics of participants in each cohort are reported in Table 2. Mean BMI exceeded 25 kg m−2 for all cohorts. Total energy intake was variable, ranging from 1641 kcal per day in the THISEAS study to 2383 kcal per day in the YFS. The Dutch cohorts, RS and NEO study, had the highest total fat and saturated fat intakes, with up to 36% of energy intake from fat.
Table 2.
Dietary and metabolic characteristics of six U.S. and European cohort studies
| n | NEO | CHS | YFS | FHS | RS | THISEAS |
|---|---|---|---|---|---|---|
| 5071 | 2746 | 1651 | 5786 | 2507 | 1244 | |
| BMI [kg m−2] | 29.62 ± 4.65 | 26.01 ± 4.31 | 25.71 ± 4.47 | 26.68 ± 5.0 | 26.3 ± 3.7 | 27.91 ± 4.56 |
| Total energy [kcal day−1] | 2284 ± 706 | 2017.18 ± 647.51 | 2383.25 ± 769.21 | 1985.0 ± 663.5 | 1973 ± 503 | 1641 ± 708.00 |
| Total fat [kcal day−1] | 799 ± 317 | 662.67 ± 277.53 | 784.69 ± 292.71 | 622.8 ± 256.2 | 725.2 ± 245.6 | 582.81 ± 267.88 |
| Total fat [% energy] | 34.48 ± 5.62 | 32.21 ± 6.0 | 32.81 ± 4.81 | 31.25 ± 6.6 | 36.4 ± 6.2 | 35.78 ± 6.04 |
| Saturated fat [kcal day−1] | 289.05 ± 127.8 | 212.28 ± 95.46 | 282.09 ± 117.07 | 219.38 ± 98.2 | 287.3 ± 106 | 191.24 ± 104.40 |
| Saturated fat [% energy] | 12.43 ± 2.833 | 10.28 ± 2.23 | 11.74 ± 2.34 | 10.99 ± 3.0 | 14.4 ± 3.2 | 11.62 ± 3.10 |
| Fasting glucose [mmol L−1] | 5.47 ± 0.54 | 5.53 ± 0.52 | 5.26 ± 0.47 | 5.19 ± 0.5 | 5.5 ± 0.54 | 5.28 ± 0.63 |
| Fasting insulin [uIU mL−1] | 11.76 ± 7.58 | 13.49 ± 7.03 | 8.29 ± 6.28 | 4.95 ± 2.7 | 11.1 ± 8.3 | 8.83 ± 3.79 |
| HOMA‐IR | 2.92 ± 2.04 | 3.37 ± 1.95 | 1.98 ± 1.61 | 1.17 ± 0.7 | 2.6 ± 1.6 | 2.08 ± 0.95 |
BMI, body mass index; HOMA‐IR, homeostatic model assessment of insulin resistance; NEO, The Netherlands Epidemiology of Obesity study; CHS, Cardiovascular Health Study; YFS, Young Finns Study; FHS, Framingham Heart Study; RS, Rotterdam Study I; THISEAS, The Hellenic study of Interactions between Single nucleotide polymorphisms and Eating in Atherosclerosis Susceptibility.
All values are mean ± standard deviation (95% C.I.). Insulin was analyzed on the natural log scale and back‐transformed to the geometric scale for presentation.
3.2. Meta‐Analysis of 19 005 Subjects from Six Cohorts Identifies NLRP3 Variants That Interact with Dietary SFA Intake to Modulate Fasting Insulin and HOMA‐IR
Meta‐analyzed estimates of the interactions between dietary SFA intake and selected SNPs on fasting insulin are presented in Table 3. We observed potentially relevant interactions between SFA and two SNPs with respect to fasting insulin concentrations; these SNPs were genotyped in four out of six cohorts (Figure 1). The interactions did not attain, but were close to, the pre‐specified Bonferroni‐corrected significance level of p < 0.0001. The intronic variant (rs12143966), located within the NLRP3 gene, interacted with SFA intake (β ± SE = −0.0063 ± 0.002, p = 0.001). This can be quantified by each 1% increase in SFA intake, increased fasting insulin by 0.0063 uIU mL−1, per each additional copy of the major (G) allele (MAF = 0.38). A second missense variant rs4925663, located in the olfactory receptor family 2, subfamily B member 11 (OR2B11) gene (Olfactory Receptor Family 2, Subfamily B member 11), showed a significant interaction with SFA, (β ± SE = −0.0058 ± 0.002, p = 0.004), such that a 0.0058 uIU mL−1 increase in fasting insulin was associated with each additional 1% SFA intake, per each additional copy of the major (C) allele (MAF = 0.4). These SNPs are located in close proximity on chromosome 1q44 position, yet are not in linkage disequilibrium (LD r2 0.628). We also observed weaker yet noteworthy interactions between other NLRP3‐, IL‐18‐, and TLR4‐related SNPs and dietary SFA intake to modulate fasting insulin concentrations.
Table 3.
Meta‐analyzed interactions between dietary saturated fatty acids (% total energy) and SNPs related to the NLRP3 inflammasome which impact fasting insulin in six cohorts (CHS, YFS, FHS, NEO, RS, THISEAS). Nominally significant SNPs (p < 0.05) are presented
| SNP | Nearest gene | Chr | Alleles major/minor | MAF | Regression coefficient for interaction between SFA x SNP for fasting insulin [uIU mL−1] | |||
|---|---|---|---|---|---|---|---|---|
| β | SE | p‐Value | I2 | |||||
| NLRP3 related SNP | ||||||||
| rs12143966 | NLRP3 | 1 | G/A | 0.38 | −0.0063 | 0.002 | 0.0019 | 0 |
| rs4925663 | OR2B11 | 1 | C/T | 0.40 | −0.0058 | 0.002 | 0.0048 | 29.3 |
| rs10737805 | NLRP3 | 1 | G/A | 0.24 | 0.0068 | 0.0026 | 0.0088 | 13.5 |
| rs12239046 | NLRP3 | 1 | C/T | 0.41 | 0.0052 | 0.002 | 0.0114 | 0 |
| rs4925546 | NLRP3 | 1 | G/A | 0.37 | 0.005 | 0.002 | 0.0141 | 0 |
| rs1539019 | NLRP3 | 1 | C/A | 0.35 | 0.0052 | 0.0021 | 0.0145 | 0 |
| rs3771158 | IL‐18RI | 2 | A/G | 0.19 | 0.006 | 0.0025 | 0.0171 | 0 |
| rs11687768 | IL‐18RI | 2 | A/G | 0.19 | 0.006 | 0.0025 | 0.0204 | 0 |
| rs10202813 | IL‐18RI | 2 | G/T | 0.19 | −0.006 | 0.0025 | 0.0210 | 0 |
| rs10197310 | IL‐18RI | 2 | T/A | 0.19 | −0.006 | 0.0025 | 0.0211 | 0 |
| rs569965 | TLR4 | 9 | G/C | 0.38 | 0.004 | 0.0018 | 0.0214 | 0 |
| rs7744 | MyD88 | 3 | A/G | 0.14 | −0.006 | 0.0029 | 0.0294 | 0 |
| rs17419611 | TLR4 | 9 | G/T | 0.08 | 0.0059 | 0.0027 | 0.0324 | 43.8 |
| rs488992 | Caspase 1 | 11 | G/A | 0.08 | 0.0065 | 0.0032 | 0.0431 | 0 |
| rs2386549 | NLRP3 | 1 | C/G | 0.10 | −0.0099 | 0.005 | 0.0476 | 0 |
SNP, single nucleotide polymorphism; Chr, chromosome; MAF, minor allele frequency; β, regression coefficient for interaction between dietary saturated fats (% total energy) × SNP for fasting insulin [uIU mL−1], adjusted for age, sex, BMI, total energy intake, and field center; I2, Cochran's Q statistic.
p‐Value adjusted for multiple comparisons with Bonferroni Correction p < 0.0001.
Figure 1.
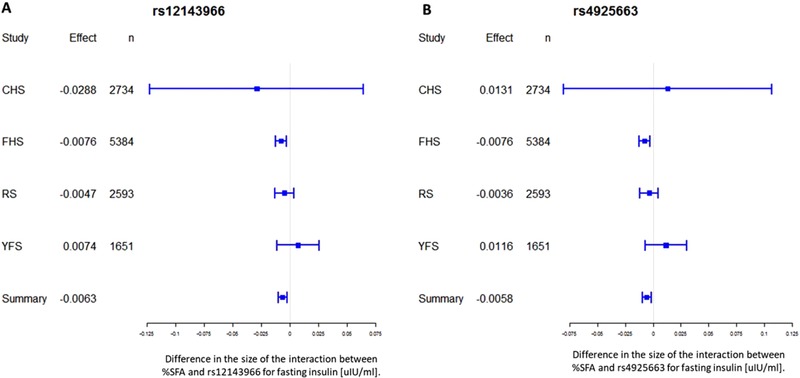
Forest plots of the interactions between rs12143966 and rs4925663 with dietary SFA intake for fasting insulin. For each cohort, linear regression was used to examine the interactions of SFA intake (% energy) with each SNP for fasting insulin [uIU mL−1]. Meta‐analysis was performed with the use of inverse‐variance‐weighted fixed‐effects models. Regression coefficients and 95% C.I. are represented by a filled square and horizontal line for each cohort and overall (summary). CHS, Cardiovascular Health Study; FHS, Framingham Heart Study; RS, Rotterdam Study I; YFS, Young Finns Study.
Table 4 presents the SNP and SFA interactions for HOMA‐IR. These findings were relatively consistent with the fasting insulin interactions; rs12143966 NLRP3 (β ± SE = −0.0065 ± 0.002, p = 0.002482); rs4925663 OR2B11 (β ± SE = −0.0064 ± 0.002, p = 0.003099). However, these interactions did not reach statistical significance for HOMA‐IR. Furthermore the statistical heterogeneity of the meta‐analysis between studies were moderately high for both the rs12143966 variant (I2 = 46.5) and the rs4925663 variant (I2 = 39.4) suggesting that factors in addition to dietary SFA and genotype are contributing to the variability in HOMA‐IR. Putative interactions between SFA and genotype for fasting glucose did not reach significance (Table S4, Supporting Information).
Table 4.
Meta‐analyzed interactions between dietary saturated fatty acids (% total energy) and SNPs related to the NLRP3 inflammasome which impact HOMA‐IR in 6 cohorts (CHS, YFS, FHS, NEO, RS, THISEAS). Nominally significant SNPs (p < 0.05) are presented
| SNP | Nearest gene | Chr | Alleles major/minor | MAF | Regression coefficient for interaction between SFA x SNP for HOMA‐IR | |||
|---|---|---|---|---|---|---|---|---|
| β | SE | p Value | I2 | |||||
| NLRP3 related SNP | ||||||||
| rs12143966 | NLRP3 | 1 | G/A | 0.38 | 0.0065 | 0.002 | 0.0020 | 46.5 |
| rs4925663 | OR2B11 | 1 | C/T | 0.40 | −0.0064 | 0.002 | 0.0031 | 39.4 |
| rs10737805 | NLRP3 | 1 | G/A | 0.24 | 0.0076 | 0.0028 | 0.0061 | 13.3 |
| rs17419611 | TLR4 | 9 | G/T | 0.08 | 0.007 | 0.0029 | 0.0165 | 41.6 |
| rs3771158 | IL‐18RI | 2 | A/G | 0.19 | 0.0064 | 0.0027 | 0.0177 | 0 |
| rs11687768 | IL‐18RI | 2 | A/G | 0.19 | 0.0062 | 0.0027 | 0.0212 | 0 |
| rs10202813 | IL‐18RI | 2 | G/T | 0.19 | −0.0062 | 0.0027 | 0.0212 | 0 |
| rs10197310 | IL‐18RI | 2 | T/A | 0.19 | −0.0062 | 0.0027 | 0.0213 | 0 |
| rs1539019 | NLRP3 | 1 | C/A | 0.35 | 0.0051 | 0.0023 | 0.0248 | 35.8 |
| rs488992 | Caspase 1 | 11 | G/A | 0.08 | 0.0072 | 0.0034 | 0.0356 | 0 |
| rs12239046 | NLRP3 | 1 | C/T | 0.41 | 0.0044 | 0.0022 | 0.0409 | 33.3 |
| rs4925546 | NLRP3 | 1 | G/A | 0.37 | 0.0043 | 0.0022 | 0.0477 | 31.2 |
SNP, single nucleotide polymorphism; Chr, chromosome; MAF, minor allele frequency; β, regression coefficient for interaction between dietary saturated fats (% total energy) × SNP for HOMA‐IR, adjusted for age, sex, BMI, total energy intake, and field center; I2, Cochran's Q statistic.
p‐Value adjusted for multiple comparisons with Bonferroni Correction p < 0.0001.
4. Discussion
The role of the NLRP3 inflammasome and IL‐1β inflammation in IR and T2D risk has gained much attention, with SFA central to its mechanism. This is the first study to investigate the interaction between NLRP3 variants and dietary SFA intake on T2D risk factors. Meta‐analysis of summary results obtained from 19 005 subjects from the CHARGE consortium demonstrates nominally significant interactions between SFA intake and the NLRP3 variant rs12143966 and the OR2B11 rs4925663 variant, to modulate fasting insulin levels. Individuals with one or two copies of the major allele for these variants have greater fasting insulin levels with higher SFA intake and may therefore benefit from reducing dietary SFA. As the major allele for both SNPs is present in ≈85% of the population, current recommendations for the general population to reduce dietary SFA intake remain pertinent. Both SNPs are closely located in the q44 region of chromosome 1, which has been described as a downstream regulatory region for the NLRP3 gene in a study of Crohn's disease.45 To date, although other NLRP3 SNPs have been associated with inflammatory diseases,36, 37, 45, 46, 47, 48, 49 these two variants have not been cited in the literature as having any association with disease risk.
The rs12143966 variant lies near an intron within the NLRP3 gene, which may complicate the understanding of its functionality. However, intronic variants may affect alternative splicing of mRNA, have gene enhancing properties, or may be in high LD with a functional variant. Further investigation of this SNP annotation software revealed that although there was little information available for the rs12143966 variant, it is in high LD with another NLRP3‐related SNP rs4925659 (r2 = 0.967). The rs4925659 variant is located within a strong enhancer region, with highly significant expression quantitative trait loci (eQTL) hits for NLRP3 in human whole blood. We used the Haploreg webtool to investigate Chip‐Seq signals from ENCODE to assess potential regulatory functions at the risk loci, and results suggest that the rs4925659 variant falls within a genomic region to which transcriptional cofactor B‐cell lymphoma 3 (BCL3) and several other related transcription factors bind. BCL3, involved in certain human B‐cell leukemias, encodes a protein that functions as an IĸB‐like molecule, which attenuate NFĸB activation but is specific for the p50 subunit.50 This is an interesting, yet unexplained observation, as NFκB is part of the NLRP3 inflammasome axis and BCL3 binding may somehow be regulated by the presence of the rs4925659 variant. The SNPs location within an enhancer region that is specific to immune cells (B‐cell leukocytes) reinforces support for its modulation of NLRP3 expression. Collectively, these findings allow us to hypothesize that rs4925659, rather than rs12143966, is the variant of interest, interacting with dietary SFA and responsible for modulating IR. However, this remains a preliminary hypothesis and requires further functional annotation.51
The OR2B11 rs4925663 SNP is a non‐synonymous coding/missense variant, located within an olfactory receptor gene associated with taste/olfaction. Missense variants alter the amino acid sequence of a protein and result in a biological change that is potentially deleterious. According to National Center for Biotechnology Information dbSNP database, the ancestral allele is “C” and the only variant allele reported there is “T.” Interestingly, there are differences in major and minor alleles by ancestry. For example, while the frequency of the T allele in HapMap CEU (Northern Europeans) is 0.42, the frequency for HapMap HCB (Han Chinese in Beijing) is 0.29 and in HapMap‐YRI (Sub‐Saharan Africans in Yoruba) is 0.7. In the last case, the major and minor alleles are reversed compared to the other ancestries. Haploreg shows eQTL hits for NLRP3 in blood and liver tissues, adding strength to our hypothesis that these SNPs may be sharing a regulatory element affecting expression of the NLRP3 gene. The olfactory system is an emerging process that may interact with the endocrine system to impact metabolic health.52, 53 Olfactory inputs help coordinate food selection and hormonal responses to impact energy homeostasis, adiposity, and insulin resistance.53 Conditional ablation of the insulin‐like growth factor‐1 receptor in olfactory sensory neurons enhance olfactory performance in mice and leads to increased adiposity and insulin resistance unraveling a new bidirectional function for the olfactory system in controlling energy homeostasis in response to sensory and hormonal signals.53 Variants on olfaction genes can also influence the innate immune response and are linked to disease.[54] Large scale genome wide association studies reported a missense mutation in tripartite motif 5 (TRIM5) which was significantly associated with coronary artery disease (p = 2.1 × 10⁻¹², OR 1.09 (C.I. 1.06, 1.11).[54] This variant interacted with eQTLs in the promoters/enhancers of olfactory genes OR52S1, OR52B6, and TRIM6 suggesting these genes enhance the expression of TRIM5.[54] TRIM5 promotes Interferon γ as part of the innate immune system.[54,55] Therefore, it is plausible that an olfactory sensor variant may have functional consequences for insulin regulation. It is well recognized that variants in taste receptors can influence glucose metabolism56, 57, 58, 59, 60 and that taste receptors may influence an individual's preference for fat intake.59, 60, 61, 62, 63, 64 While the full impact of olfaction gene variants on metabolism and innate immune function remain to be defined, preliminary insight would suggest possible biological interactions with habitual diet to impact risk of T2D.
We acknowledge that these interactions did not meet the highly stringent Bonferroni‐corrected cut‐off point for statistical significance. Aside from the possibility that there is no real interaction between SFA and these loci, the null results could still reflect insufficient statistical power or misclassification in the quantification of SFA intake. False negative results remain a challenge for this type of analysis, as we may be missing some true gene–nutrient interactions. Furthermore, this was a candidate gene study of 489 SNPs related to the NLRP3 inflammasome, and while this analysis provided a novel hypothesis, we may be missing some key SFA interactions with other inflammatory or indeed non‐inflammatory variants.
To conclude, this gene–nutrient interaction analysis identified several NLRP3 inflammasome–related SNPs that interact with SFA intake to modulate glycemic measures. These results support the growing evidence for the role of NLRP3 in the progression of T2D risk factors. While intriguing, results need to be interpreted with caution and validated in other studies such as UKBiobank before disentangling the mechanism by which genotype influences phenotype. Nonetheless, this research provides interesting observations for T2D biology, particularly with regards to the olfactory receptor variant interacting with dietary SFA to modulate insulin levels, and can inform future experimental studies. Understanding how a modifiable dietary factor such as SFA intake interacts with inflammatory genes to alter measures of IR may help identify at‐risk individuals who can benefit from lowering SFA intake to reduce their T2D risk. Recent evidence shows that individuals are more likely to comply with personalized dietary advice over generic nutritional advice.65 These nutrient‐sensitive genotypes offer potential for a “personalized nutrition” approach to dietary advice.
Conflict of Interest
The authors declare no conflict of interest.
Supporting information
Supporting Information
Acknowledgments
A.M.M. designed the study, analyzed the data, and co‐wrote the manuscript. C.E.S. designed the study and co‐wrote the manuscript. L.M.M., J.L.F., R.N., R.N.L., M.K., J.D., T.V., C.T.L., and E.M. analyzed the data. D.O.M.K., O.T.R., J.H., A.D., G.D., R.D.M., T.L., F.R., P.D., V.M., J.B.M., A.U., M.A.I., and O.H.F. collected the data. P.O.G. and M.H. reviewed the manuscript. J.M.O. collected the data and co‐wrote the manuscript. H.M.R. designed the study and co‐wrote the manuscript. All authors have reviewed the final version of the manuscript. A.M.M. and H.M.R. were supported by the Science Foundation Ireland Principal Investigator Programme (11/PI/1119) and Science Foundation Ireland Joint Programmes Initiative (14/JPHDHL/B3076) FOODBALL (The Food Biomarkers Alliance) 14/JPHDHL/B3076. C.E.S. was supported by K08 HL112845. J.B.M. was supported by NIDDK U01 DK078616 and K24 DK080140. Framingham Heart Study: N01‐HC‐25195 and HHSN268201500001I.
Murphy A. M., Smith C. E., Murphy L. M., Follis J. L., Tanaka T., Richardson K., Noordam R., Lemaitre R. N., Kähönen M., Dupuis J., Voortman T., Marouli E., Mook‐Kanamori D. O., Raitakari O. T., Hong J., Dehghan A., Dedoussis G., de Mutsert R., Lehtimäki T., Liu C., Rivadeneira F., Deloukas P., Mikkilä V., Meigs J. B., Uitterlinden A., Ikram M. A., Franco O. H., Hughes M., O' Gaora P., Ordovás J. M., Roche H. M., Potential Interplay between Dietary Saturated Fats and Genetic Variants of the NLRP3 Inflammasome to Modulate Insulin Resistance and Diabetes Risk: Insights from a Meta‐Analysis of 19 005 Individuals. Mol. Nutr. Food Res. 2019, 63, 1900226 10.1002/mnfr.201900226
References
- 1. Jaacks L. M., Siegel K. R., Gujral U. P., Narayan K. M. V., Best Pract. Res. Clin. Endocrinol. Metab. 2016, 30, 331. [DOI] [PubMed] [Google Scholar]
- 2. Samuel V. T., Shulman G. I. J., Clin. Invest. 2016, 126, 12. [DOI] [PMC free article] [PubMed] [Google Scholar]
- 3. Osborn O., Olefsky J. M., Nat. Med. 2012, 18, 363. [DOI] [PubMed] [Google Scholar]
- 4. Olefsky J. M., Glass C. K., Ann. Rev. Physiol. 2010, 72, 219. [DOI] [PubMed] [Google Scholar]
- 5. Mcnelis J. C., Olefsky J. M., Immunity 2014, 41, 36. [DOI] [PubMed] [Google Scholar]
- 6. Donath M. Y., Nat. Rev. Drug Discov. 2014, 13, 465. [DOI] [PubMed] [Google Scholar]
- 7. Chawla A., Nguyen K., Goh Y., Nat. Rev. Immunol. 2011, 11, 738. [DOI] [PMC free article] [PubMed] [Google Scholar]
- 8. Zierath J. R., Cell Metab. 2007, 5, 161. [DOI] [PubMed] [Google Scholar]
- 9. Chavez J. A., Summers S. A., Cell Metab. 2012, 15, 585. [DOI] [PubMed] [Google Scholar]
- 10. Samuel V. T., Shulman G. I., Cell 2012, 148, 852. [DOI] [PMC free article] [PubMed] [Google Scholar]
- 11. Eguchi K., Manabe I., Oishi‐Tanaka Y., Ohsugi M., Kono N., Ogata F., Yagi N., Ohto U., Kimoto M., Miyake K., Tobe K., Arai H., Kadowaki T., Nagai R., Cell Metab. 2012, 15, 518. [DOI] [PubMed] [Google Scholar]
- 12. Rocha D. M., Caldas A. P., Oliveira L. L., Bressan J., Atherosclerosis 2016, 244, 211. [DOI] [PubMed] [Google Scholar]
- 13. Tierney A. C., McMonagle J., Shaw D. I., Gulseth H. L., Helal O., Saris W. H. M., Paniagua J. A., Gołąbek‐Leszczyñska I., Defoort C., Williams C. M., Karsltröm B., Vessby B., Dembinska‐Kiec A., López‐Miranda J., Blaak E. E., Drevon C. A., Gibney M. J., Lovegrove J. A., Roche H. M., Int. J. Obes. 2011, 35, 800. [DOI] [PubMed] [Google Scholar]
- 14. Vessby B., Uusitupa M., Hermansen K., Riccardi G., Rivellese A. A., Tapsell L. C., Nälsén C., Berglund L., Louheranta A., Rasmussen B. M., Calvert G. D., Maffetone A., Pedersen E., Gustafsson I. B., Storlien L. H., KANWU Study Diabetologia 2001, 44, 312. [DOI] [PubMed] [Google Scholar]
- 15. Cruz‐Teno C., Pérez‐Martínez P., Delgado‐Lista J., Yubero‐Serrano E. M., Camargo A., Rodríguez‐Cantalejo F., Malagón M. M., Pérez‐Jiménez J., Roche H. M., López‐Miranda J., Mol. Nutr. Food Res. 2012, 56, 854. [DOI] [PubMed] [Google Scholar]
- 16. van Dijk S. J., Feskens E. J., Bos M. B., Hoelen D. W., Heijligenberg R., Bromhaar M., Grootte de Groot L. C. P. G.M., de Vries J. H. M., Müller M., Afman L., Am. J. Clin. Nutr. 2009, 90, 1656. [DOI] [PubMed] [Google Scholar]
- 17. Stienstra R., Tack C. J., Kanneganti T. D., Joosten La., Netea M. G., Cell Metab. 2012, 15, 10. [DOI] [PubMed] [Google Scholar]
- 18. Vandanmagsar B., Youm Y.‐H., Ravussin A., Galgani J. E., Stadler K., Mynatt R. L., Ravussin E., Stephens J. M., Dixit V. D., Nat. Med. 2011, 17, 179. [DOI] [PMC free article] [PubMed] [Google Scholar]
- 19. Wen H., Gris D., Lei Y., Jha S., Zhang L., Huang M. T., Brickey W. J., Ting J. P., Nat. Immunol. 2011, 12, 408. [DOI] [PMC free article] [PubMed] [Google Scholar]
- 20. Stienstra R., van Diepen Ja., Tack C. J., Zaki M. H., Proc. Natl. Acad. Sci. U. S. A. 2011, 108, 15324. [DOI] [PMC free article] [PubMed] [Google Scholar]
- 21. Stienstra R., Joosten L. aB, Koenen T., Van Tits B., Cell Metab. 2010, 12, 593. [DOI] [PMC free article] [PubMed] [Google Scholar]
- 22. McGillicuddy F. C., Harford Ka., Reynolds C. M., Oliver E., Claessens M., Mills K. H. G., Roche H. M., Diabetes 2011, 60, 1688. [DOI] [PMC free article] [PubMed] [Google Scholar]
- 23. Ridker P. M., Everett B. M., Thuren T., MacFadyen J. G., Fonseca F., Nicolau J., Koenig W., Anker S. D., Kastelein J. J. P., Cornel J. H., Pais P., Pella D., Genest J., Cifkova R., Lorenzatti A., Forster T., Kobalava Z., Vida‐Simiti L., Flather M., Shimokawa H., Ogawa H., Dellborg M., Rossi P. R. F., Troquay R. P. T., Libby P., Glynn R. J., CANTOS Trial Group N. Engl. J. Med. 2017, 377, 1119.28845751 [Google Scholar]
- 24. Lee H.‐M., Kim J.‐J., Kim H. J., Shong M., Ku B. J., Jo E. K., Diabetes 2013, 62, 194. [DOI] [PMC free article] [PubMed] [Google Scholar]
- 25. Finucane O. M., Lyons C. L., Murphy A. M., Reynolds C. M., Klinger R., Healy N. P., Cooke A. A., Coll R. C., McAllan L., Nilaweera K. N., O'Reilly M. E., Tierney A. C., Morine M. J., Alcala‐Diaz J. F., Lopez‐Miranda J., O'Connor D. P., O'Neill L. A., McGillicuddy F. C., Roche H. M., Diabetes 2015, 64, 2116. [DOI] [PubMed] [Google Scholar]
- 26. Reynolds C. M., Mcgillicuddy F. C., Harford K. A., Finucane O. M., Mills K. H., Roche H. M., Mol. Nutr. Food Res. 2012, 56, 1212. [DOI] [PubMed] [Google Scholar]
- 27. Shen L., Yang Y., Ou T., Key C.‐C. C., Tong S. H., Sequeira R. C., Nelson J. M., Nie Y., Wang Z., Boudyguina E., Shewale S. V., Zhu X. J., Lipid Res. 2017, 58, 1808. [DOI] [PMC free article] [PubMed] [Google Scholar]
- 28. Mozaffarian D., Mensink R., Zock P., Kester A.,,, Lancet Diabetes Endocrinol. 2014, 2, 770. [DOI] [PubMed] [Google Scholar]
- 29. Micha R., Mozaffarian D., Lipids 2010, 45, 893. [DOI] [PMC free article] [PubMed] [Google Scholar]
- 30. Forouhi N. G., Koulman A., Sharp S. J., Imamura F., Kröger J., Schulze M. B., Crowe F. L., Huerta J. M., Guevara M., Beulens J. W., van Woudenbergh G. J., Wang L., Summerhill K., Griffin J. L., Feskens E. J., Amiano P., Boeing H., Clavel‐Chapelon F., Dartois L., Fagherazzi G., Franks P. W., Gonzalez C., Jakobsen M. U., Kaaks R., Key T. J., Khaw K. T., Kühn T., Mattiello A., Nilsson P. M., Overvad K., et al. Lancet. Diabetes Endocrinol. 2014, 2, 810. [DOI] [PMC free article] [PubMed] [Google Scholar]
- 31. Casas‐Agustench P., Arnett D. K., Smith C. E., Lai C.‐Q., Parnell L. D., Borecki I. B., Frazier‐Wood A. C., Allison M., Chen Y. D., Taylor K. D., Rich S. S., Rotter J. I., Lee Y. C., Ordovás J. M. J., Acad. Nutr. Diet. 2014, 114, 1954. [DOI] [PMC free article] [PubMed] [Google Scholar]
- 32. Shen J., Arnett D. K., Peacock J. M., Parnell L. D., Kraja A., Hixson J. E., Tsai M. Y., Lai C. Q., Kabagambe E. K., Straka R. J., Ordovas J. M., J. Nutr. 2007, 137, 1846. [DOI] [PubMed] [Google Scholar]
- 33. Phillips C. M., Kesse‐Guyot E., Ahluwalia N., McManus R., McManus R., Hercberg S., Lairon D., Planells R., Roche H. M., Atherosclerosis 2012, 220, 513. [DOI] [PubMed] [Google Scholar]
- 34. Phillips C. M., Goumidi L., Bertrais S., Ferguson J. F., Field M. R., Kelly E. D., Peloso G. M., Cupples L. A., Shen J., Ordovas J. M., McManus R., Hercberg S., Portugal H., Lairon D., Planells R., Roche H. M., Am. J. Clin. Nutr. 2009, 90, 1665. [DOI] [PubMed] [Google Scholar]
- 35. Phillips C. M., Goumidi L., Bertrais S., Ferguson J. F., Field M. R., Kelly E. D., Mehegan J., Peloso G. M., Cupples L. A., Shen J., Ordovas J. M., McManus R., Hercberg S., Portugal H., Lairon D., Planells R., Roche H. M., J. Clin. Endocrinol. Metab. 2010, 95, 1386. [DOI] [PubMed] [Google Scholar]
- 36. Kastbom A., Ärlestig L., Rantapää‐Dahlqvist S. J., Rheumatol. 2015, 42, 1740. [DOI] [PubMed] [Google Scholar]
- 37. Zheng Y., Zhang D., Zhang L., Fu M., Zeng Y., Russell R., Gene 2013, 530, 151. [DOI] [PubMed] [Google Scholar]
- 38. Rasheed H., McKinney C., Stamp L. K., Dalbeth N., Topless R. K., Day R., Kannangara D., Williams K., Smith M., Janssen M., Jansen T. L., Joosten L. A., Radstake T. R., Riches P. L., Tausche A. K., Lioté F., Lu L., Stahl E. A., Choi H. K., So A., Merriman T. R., PLoS One 2016, 11, e0147939. [DOI] [PMC free article] [PubMed] [Google Scholar]
- 39. Kunnas T., Määttä K., Nikkari S. T., Immun. Ageing 2015, 12, 19. [DOI] [PMC free article] [PubMed] [Google Scholar]
- 40. Tan M.‐S., Yu J.‐T., Jiang T., Zhu X.‐C., Wang H. F., Zhang W., Wang Y. L., Jiang W., Tan L. J., Neuroimmunol. 2013, 265, 91. [DOI] [PubMed] [Google Scholar]
- 41. Cheng C.‐H., Lee Y.‐S., Chang C.‐J., Lin J.‐C., Lin T. Y., PLoS One 2015, 10, e0140128. [DOI] [PMC free article] [PubMed] [Google Scholar]
- 42. Higgins J. P. T., Thompson S. G., Deeks J. J., Altman D. G., BMJ 2003, 327, 557. [DOI] [PMC free article] [PubMed] [Google Scholar]
- 43. Ward L. D., Kellis M., Nucleic Acids Res. 2012, 40, D930. [DOI] [PMC free article] [PubMed] [Google Scholar]
- 44. Vaser R., Adusumalli S., Leng S. N., Sikic M., Ng P. C., Nat. Protoc. 2015, 11, 1. [DOI] [PubMed] [Google Scholar]
- 45. Villani A.‐C., Lemire M., Fortin G., Louis E., Silverberg M. S., Collette C., Baba N., Libioulle C., Belaiche J., Bitton A., Gaudet D., Cohen A., Langelier D., Fortin P. R., Wither J. E., Sarfati M., Rutgeerts P., Rioux J. D., Vermeire S., Hudson T. J., Franchimont D., Nat. Genet. 2009, 41, 71. [DOI] [PMC free article] [PubMed] [Google Scholar]
- 46. Zhao X., Gu C., Yan C., Zhang X., Li Y., Wang L., Ren L., Zhang Y., Peng J., Zhu Z., Han Y., Biomed Res Int. 2016, 2016, 7395627. [DOI] [PMC free article] [PubMed] [Google Scholar]
- 47. Ben Hamad M., Cornelis F., Marzouk S., Chabchoub G., Bahloul Z., Rebai A., Fakhfakh F., Ayadi H., Petit‐Teixeira E., Maalej A., Int. J. Immunogenet. 2012, 39, 131. [DOI] [PubMed] [Google Scholar]
- 48. Yang C.‐A., Huang S.‐T., Chiang B.‐L., J. Scand Rheumatol. 2014, 43, 146. [DOI] [PubMed] [Google Scholar]
- 49. Klen J., Goričar K., Janež A., Dolžan V. J., Diabetes Res. 2015, 2015, 616747. [DOI] [PMC free article] [PubMed] [Google Scholar]
- 50. Wulczyn F. G., Naumann M., Scheidereit C., Nature 1992, 358, 597. [DOI] [PubMed] [Google Scholar]
- 51. Edwards S. L., Beesley J., French J. D., Dunning A. M., Am J Hum Genet 2013, 93, 779. [DOI] [PMC free article] [PubMed] [Google Scholar]
- 52. Palouzier‐paulignan B., Lacroix M. C., Aimé P., Baly C., Caillol M., Congar P., Julliard A. K., Tucker K., Fadool D. A., Chem. Senses 2012, 37, 769. [DOI] [PMC free article] [PubMed] [Google Scholar]
- 53. Riera C. E., Tsaousidou E., Halloran J., Follett P., Hahn O., Pereira M. M. A., Ruud L. E., Alber J., Tharp K., Anderson C. M., Brönneke H., Hampel B., Filho C. D. M., Stahl A., Brüning J. C., Dillin A., Cell Metab. 2017, 26, 198. [DOI] [PubMed] [Google Scholar]
- 54. van der Haarst P., Verweij N., Circ Res. 2018, 122, 433. [DOI] [PMC free article] [PubMed] [Google Scholar]
- 55. Hughes M. F., Leinihan Y. M., Godson C., Roche H. M., Front. Cardiovasc. Med. 2018, 6, 148. [DOI] [PMC free article] [PubMed] [Google Scholar]
- 56. Dotson C. D., Zhang L., Xu H., Shin Y.‐K., Vigues S., Ott S. H., Elson A. E., Choi H. J., Shaw H., Egan J. M., Mitchell B. D., Li X., Steinle N. I., Munger S. D., PLoS One 2008, 3, e3974. [DOI] [PMC free article] [PubMed] [Google Scholar]
- 57. Nomura M., Kawahara Y., Yakugaku Zasshi 2015, 135, 763. [DOI] [PubMed] [Google Scholar]
- 58. Neiers F., Canivenc‐Lavier M.‐C., Briand L., Curr. Diab. Rep. 2016, 16, 49. [DOI] [PubMed] [Google Scholar]
- 59. Cvijanovic N., Feinle‐Bisset C., Young R. L., Little T. J., Nutr. Rev. 2015, 73, 318. [DOI] [PubMed] [Google Scholar]
- 60. Park S., Zhang X., Lee N. R., Jin H.‐S. J., Nutrigenet. Nutrigenomics 2016, 9, 47. [DOI] [PubMed] [Google Scholar]
- 61. Besnard P., Passilly‐Degrace P., Khan N. A., Physiol. Rev. 2016, 96, 151. [DOI] [PubMed] [Google Scholar]
- 62. Brissard L., Leemput J., Hichami A., Passilly‐Degrace P., Maquart G., Demizieux L., Degrace P., Khan N. A., Nutrients 2018, 10, 1347. [DOI] [PMC free article] [PubMed] [Google Scholar]
- 63. Sollai G., Melis M., Mastinu M., Pani D., Cosseddu P., Bonfiglio A., Crnjar R., Tepper B. J., Tomassini Barbarossa I., Nutrients 2019, 1, 315. [DOI] [PMC free article] [PubMed] [Google Scholar]
- 64. Phillips C. M., Perry I. J., J. Clin. Endocrinol. Metab. 2013, 98, 1610. [DOI] [PubMed] [Google Scholar]
- 65. Celis‐Morales C., Livingstone K. M., Marsaux C. F. M., Macready A. L., Fallaize R., O'Donovan C. B., Woolhead C., Forster H., Walsh M. C., Navas‐Carretero S., San‐Cristobal R., Tsirigoti L., Lambrinou C. P., Mavrogianni C., Moschonis G., Kolossa S., Hallmann J., Godlewska M., Surwillo A., Traczyk I., Drevon C. A., Bouwman J., van Ommen B., Grimaldi K., Parnell L. D., Matthews J. N., Manios Y., Daniel H., Martinez J. A., Lovegrove J. A.. et al, Food4Me Study, Int. J. Epidemiol. 2017, 46, 578. [DOI] [PubMed] [Google Scholar]
- 66. De Mutsert R., Den Heijer M., Rabelink T. J., Smit J. W. A., Eur. J. Epidemiol. 2013, 28, 513. [DOI] [PubMed] [Google Scholar]
- 67. Fried L. P., Borhani N. O., Enright P., Furberg C. D., Ann. Epidemiol. 1991, 1, 263. [DOI] [PubMed] [Google Scholar]
- 68. Raitakari O. T., Juonala M., Rönnemaa T., Keltikangas‐Järvinen L., Keltikangas‐Järvinen L., Räsänen L., Pietikäinen M., Hutri‐Kähönen N., Taittonen L., Jokinen E., Marniemi J., Jula A., Telama R., Kähönen M., Lehtimäki T., Akerblom H. K., Viikari J. S., Int. J. Epidemiol. 2008, 37, 1220. [DOI] [PubMed] [Google Scholar]
- 69. Splansky G. L., Corey D., Yang Q., Atwood L. D., Cupples L. A., Benjamin E. J., D'Agostino R. B. Sr, Fox C. S., Larson M. G., Murabito J. M., O'Donnell C. J., Vasan R. S., Wolf P. A., Levy D., Am. J. Epidemiol. 2007, 165, 1328. [DOI] [PubMed] [Google Scholar]
- 70. Hofman A., Brusselle G. G. O., Murad S. D., van Duijn C. M., Franco O. H., Goedegebure A., Ikram M. A., Klaver C. C., Nijsten T. E., Peeters R. P., Stricker B. H., Tiemeier H. W., Uitterlinden A. G., Vernooij M. W., Eur. J. Epidemiol. 2015, 30, 661. [DOI] [PMC free article] [PubMed] [Google Scholar]
- 71. Dimitriou M., Rallidis L. S., Theodoraki E. V., Kalafati I. P., Kolovou G., Dedoussis G. V., Public Health Nutr. 2016, 19, 1081. [DOI] [PMC free article] [PubMed] [Google Scholar]
- 72. Feinleib M., Kannel W. B., Garrison R. J., McNamara P. M., Castelli W. P., Prev. Med. 1975, 4, 518. [DOI] [PubMed] [Google Scholar]
- 73. Theodoraki E. V., Nikopensius T., Suhorutsenko J., Papamikos V., Kolovou G. D., Peppes V., Panagiotakos D., Limberi S., Zakopoulos N., Metspalu A., Dedoussis G. V., Clin. Chem. Lab. Med. 2009, 47, 1471. [DOI] [PubMed] [Google Scholar]
- 74. Theodoraki E. V., Nikopensius T., Suhorutsenko J., Peppes V., Fili P., Kolovou G., Papamikos V., Richter D., Zakopoulos N., Krjutskov K., Metspalu A., Dedoussis G. V., BMC Med. Genet. 2010, 11, 28. [DOI] [PMC free article] [PubMed] [Google Scholar]
Associated Data
This section collects any data citations, data availability statements, or supplementary materials included in this article.
Supplementary Materials
Supporting Information