

Abstract
Starting with an isoflavone-rich red clover extract (RCE), this study expands on the DESIGNER approach to Deplete and Enrich Select Ingredients to Generate Normalized Extract Resources using countercurrent separation (CCS) methodology. A hydrostatic CCS (also known as centrifugal partition chromatography, CPC) technique was used to enrich and deplete selected bioactive isoflavones of RCE extracts.
In order to efficiently prepare large enough DESIGNER extracts from RCE for biological testing including in vivo assays, it was necessary to choose a balance between resolution and a loading capacity of at least 1 g per separation for the selected solvent system (SS). Adding 3.0 mL of DMSO to the sample containing equal amounts of upper and lower phases of hexanes-ethyl acetate-methanol-water (HEMWat 5.5/4.5/5/5, v/v) allowed 1 gram of RCE to be dissolved in the sample without disrupting the chromatographic resolution of the target isoflavones. CPC experiments using other solubility modifiers, acetone and acetonitrile indicated that these modifiers increase solubility significantly, even better than DMSO, but the separation of target compounds was sufficiently disturbed to be unacceptable for producing the desired DESIGNER extracts.
The preparation of DESIGNER extracts was achieved with two sequential CPC separations. The first produced a biochanin A enriched fraction (93.60% w/w) with only small amounts of other isoflavones: 2.30% prunetin, 1.17% formononetin, and 0.12% irilone. Gravimetric investigations of this step demonstrated the high efficiency of CCS technology for full and unbiased sample recovery, confirmed experimentally to be 99.80%. A formononetin enriched fraction from this first separation was re-chromatographed on a more polar HEMWat (4/6/4/6, v/v) SS to produce a formononetin enriched DESIGNER fraction of 94.70% w/w purity. The presence of the minor (iso)flavonoids: 3.16% pseudobaptigenin, 0.39% kaempferol, and 0.31% genistein was also monitored in these fractions. Chromatographic fractions, combined fractions, and DESIGNER extracts were analyzed with qHNMR which provided purity information, quantitation, and structural identification of the components.
Keywords: Trifolium pratense L, centrifugal partition chromatography, CPC, countercurrent separation, CCS, DESIGNER extracts, isoflavones, biochanin A, formononetin
1. Introduction
Botanical natural products are a rich source of bioactive compounds and have applications in dietary supplements, cosmetics, food-processing, health care, pharmaceutical and other fields. Some natural materials have been extensively investigated in order to identify the metabolites responsible for the biological activity [1]. Bioactivity guided routes toward the discovery of bioactive metabolites in plant extracts and other natural sources suffer from drawbacks, such as, time-consuming steps for preparative-scale isolation required by in vivo bioassays and non-targeted isolation, which bears the risk of repetitive purification of known compounds. An alternative approach is to use DESIGNER extracts that separate out major components of biological interest while retaining the chemical integrity of the complete extract and provide bioactivity information beyond the identification of putative biologically active single chemical entities. DESIGNER extracts utilize a chromatographic "knockout/knockdown" methodology that targets known metabolites which have been previously identified as biologically active marker compounds [2-5]. By selectively removing these metabolites, it becomes possible to evaluate the role of the minor constituents and/or matrix components that are often (but not necessarily justifiably) considered “inert” materials. In this way, highly active minor constituents and possible additive, subtractive, and synergistic relationships may be identified early in the separation process.
A key attribute of DESIGNER methodology is the preparative scale high-resolution fractionation of extracts with complete recovery of all components. Countercurrent separation (CCS) techniques, such as hydrodynamic methods including high speed/performance countercurrent chromatography (HSCCC/HPCCC), or hydrostatic methods including centrifugal partition chromatography (CPC), address these criteria to a greater extent than any other chromatographic technique. The separation potential of CPC is a result of the rotor design. The rotor comprises hundreds of cells connected in series [6]. These microcells emulate liquid-liquid partitioning similar to that performed in separatory funnels. The resulting repetitive mixing and settling action allows the components to be separated by their respective partition coefficients (K values) and total solubilities in the two-phase systems. It is important to point out that fractionating crude plant extracts or other complex natural materials by solid stationary phase-based liquid chromatography may result in sample loss from degradation and irreversible stationary phase absorption [7, 8]. The main advantages of CCS techniques (both HSCCC and CPC) are the lack of both irreversible absorption and solid phase catalyzed degradation, total sample recovery at the end of the experiment, ease of scale up, and a relatively high loading capacity [9]. The latter advantage particularly applies to CPC, which generally exhibits higher loading capacities relative to column volume than HSCCC. Generally, in vivo animal investigation requires a high loading capacity of crude extract in order to isolate enough amounts of compounds for biological testing. However, the solubility of crude extracts may be a factor in the attempt to increase the loading capacity.
Optimization of preparative CCS involves not only the selection of an appropriate biphasic solvent system (SS) for suitable resolution, but also the maximization of sample loading for effective preparative operation. Sample loading may be increased by augmenting the volume of sample introduced into the column, or by increasing the concentration of the sample in a fixed sample volume. Addition of dimethyl sulfoxide (DMSO) or other organic solvents to the upper and lower phase used to dissolve a crude extract during sample preparation can improve solubility dramatically. In particular, DMSO is an aprotic solvent with pronounced solubilizing ability for a wide variety of otherwise poorly soluble polar and nonpolar molecules [10]. The introduction of DMSO as a co-solvent for CCS has been reported to also produce beneficial effects on selectivity [11-13].
Nuclear magnetic resonance (NMR) spectroscopy is a powerful technique, not only for the structural characterization of purified compounds, but also for the (quantitative and qualitative) analysis of mixtures. NMR spectroscopy is capable of identifying the components of complex mixtures with complementary structural information that is not accessible by UHPLC-UV or LC-MS methods. In addition, when performed under quantitative conditions, quantitative 1D 1HNMR (qHNMR) spectroscopy methodology allows the precise gravimetric analysis of both major and minor components. The use of external calibrants, such as dimethylsulfone (DMSO2) and caffeine, renders qHNMR spectroscopy an absolute method of determining purity and enables the quantification of target compounds without the use of internal calibrants that would contaminate the sample.
With more than 255 species, Trifolium is one of the largest genera in the Fabaceae family. Commonly known as “red clover”, Trifolium pratense L. is indigenous to Europe, Western Asia, and Northwest Africa, but has also been introduced and naturalized in many other parts of the world [14]. Red clover is a well-known medicinal plant renowned for its bioactive isoflavones [15, 16]. Isoflavones are reported to be the main bioactive compounds because of their affinity towards α and β estrogen, androgen, and progesterone receptors [17]. Some red clover isoflavones are reported to have the ability to reduce the daily vasomotor frequency and overall menopausal intensity in postmenopausal women [18].
Because isoflavones reportedly possess estrogenic activity in vitro [19], a red clover clinical extract has been formulated that contains high concentrations of formononetin and biochanin A (14.26% and 14.47%, respectively) [20]. However, the role of formononetin and biochanin A in estrogenic activity is still unclear because these two major ingredients showed no in vitro activity [20]. On the other hand, it was also reported that formononetin, biochanin A, and minor isoflavones (i.e., prunetin) present in red clover, but not estrogenic in vitro, may still potentially be converted to active metabolites in vivo and act as estrogenic “prodrugs”[21]. Therefore, at this time, there is insufficient evidence to pinpoint the active component(s) that can fully justify the use of red clover as a botanical treatment for menopausal symptoms. The investigation of red clover DESIGNER extracts will be helpful for understanding the biological activity of red clover.
The aim of this work was to develop a preparative CPC method to selectively deplete (knockout/knockdown) the isoflavones, formononetin or biochanin A, individually, or both of them simultaneously, from a clinical red clover extract (RCE) to generate the following DESIGNER extracts for further biological testing: formononetin enriched extract, biochanin A enriched extract, biochanin A knockout extract, formononetin knockout extract, and biochanin A & formononetin knockout extract. DESIGNER extracts were prepared in two CPC steps. Previously, a suitable SS for this separation was selected by the TLC-based GUESS method [22]. In this study DMSO was found to increase the solubility of the crude extract for sample preparation without adversely affecting chromatographic resolution. The first CPC separation yielded 94% pure biochanin A with prunetin, formononetin, and irilone as residual components quantified with qHNMR. The sample mass recovery for this experiment was investigated by using gravimetry. An experimental mass recovery of 99.80% was achieved. The second CPC separation produced 95% purity formononetin with pseudobaptigenin, kaempferol, and genistein as residual components. The result of this work was the formulation of at least five DESIGNER extracts.
2. Materials and methods
2.1. Materials
Chemical solvents and reagents were purchased from Thermo Fischer Scientific (Hanover Park, IL, USA) and Sigma Aldrich (St. Louis, MO, USA). HPLC grade solvents were purchased from Sigma Aldrich and DMSO-d6 (99.9 atom % D) was purchased from Cambridge Isotope Laboratories Inc. (Andover, MA, USA). Reference standards of biochanin A, formononetin, calycosin, pseudobaptigenin, prunetin, quercetin, irilone, pratensein, genistein, and daidzein were purchased from Indofine Chemical Co. (Hillsborough, NJ, USA). DMSO was purchased from BDH (Dawsonville, GA, USA). Standardized red clover extract (RCE) was prepared from autohydrolyzed Trifolium pratense aerial parts by PureWorld Botanicals, Inc. (South Hackensack, NJ, USA). According to the manufacturer, the enriched extract contained 34.1% isoflavonoids, with a high concentration of formononetin and biochanin A, also containing minor percentages of irilone, prunetin, calycosin, daidzein, and genistein. The total isoflavonoid content was previously analyzed by two orthogonal analytical methods [20, 23].
The external calibrants, DMSO2 (Code N. 048-33271; 100%, CRM) was purchased from Wako Pure Chemical Ind., Ltd. (Osaka, Japan) and caffeine (CAS:-N.5808-2; 99.5%, CofA) was purchased from Sigma Aldrich (St. Louis, MO, USA). The internal calibrant, 3,5-dinitrobenzoic acid (CAS-N. 99-34-3; 99.3% by qHNMR/100% method) was purchased from Fluka Analytical (Buchs, Switzerland) A gastight (1.0 mL) syringe, purchased from Pressure-Lok, precision sampling (Baton Rouge, LA, USA), was used for volumetric NMR sample preparation. Analytical TLC was performed on Macherey-Nagel (Duren, Germany) Alugram precoated 0.2 mm thick silica gel G/UV254 10 × 20 cm aluminum plates. Macherey-Nagel GmbH & Co. (Duren, Germany) syringe filters (CHROMAFIL Xtra PTFE-20/13, pore size: 0.20 μm, 13 mm diameter) were used for HPLC sample filtration.
2.2. Instrumentation
qHNMR spectroscopy experiments were performed on a JEOL RESONANCE Inc. JNMR-ECZ400/L1 (Akishima, Tokyo, Japan) 400 MHz YH NMR spectroscopy. The instrument was equipped with a JEOL Resonance 5 mm 400 MHz broadband Z-gradient high resolution SuperCool NMR probe with liquid nitrogen loop cooling system (operating temperature <85 K). NMR data were analyzed and processed using JEOL Delta v5.0.4.4 NMR data processing software and Mestrenova 11.0.4 software from Mestrelab Research S. L. (Santiago de Compostela, Spain).
Samples were weighed on an analytical balance (0.01 mg/0.1 mg readability) Mettler Toledo, LLC; (Columbus, OH, USA). TLC chromatograms were visualized with a UVP Inc. (Lutterworth, Leicestershire, UK) UV lamp (CHROMATO-VUE C-70G, UV viewing system, 254 nm, 365 nm, and white light).
The SCPE-250 centrifugal partition chromatography (CPC) extractor from Armen Instrument Gilson Inc. (Vannes, France) had a 264 mL total volume, 220 mL of which was attributed to cell volume (12 disks; twin cell design; 20 cells per disk). It was operated at a flow rate of 50 mL/min and a rotation speed of 2500 rpm, with a pressure maximum of 300 bar. The Spot Prep peripheral operating system was equipped with a 50 mL sample loop, binary pump, a 4 wavelength UV/VIS detector, a sample collector, and data collection software. A miVac centrifugal vacuum concentrator (Speed Vac, Genevac LTD. Ipswich, England) was used to dry each collected sample. Each sample was dried for two or three days on Labconco™ Benchtop FreeZone™ freeze-Dry system (Kansas, MO, USA) before performing gravimetry.
LC-MS-MS analyses were carried out using a Waters 2695 (Milford, MA, USA) solvent delivery connected to a Waters SYNAPT quadrupole/time-of-flight (Q/TOF) mass spectrometer operated in the positive ion electrospray mode.
2.3. CPC fractionation without DMSO
Experiment 1:
A 360 mg portion of RCE was dissolved with sonication in equal amounts of upper and lower phase to a total volume of 46 mL. The sample was then passed through a syringe filter and loaded into the 50 mL sample loop. The residue that remained following filtration was weighed (221 mg) in order to determine the solubility of RCE in the hexanes-ethyl acetate-methanol-water (HEMWat, 5.5/4.5/5/5, v/v) SS (Table 1). The stationary phase retention ratio (Sf) was 0.82 determined with a graduated cylinder. The CPC experiment in descending mode was performed at room temperature without additional temperature control. Extrusion was initiated by pumping upper phase into column after 15 min elution time with the lower phase: A total of 150 fractions (10.0 mL in each test tube) were collected.
Table 1.
Summary of sample preparation parameters for experiments 1-9. HEMWat (5.5/4.5/5/5, v/v) was used for all experiments.
| # Exp. | mg RCE | V additive | VUP | VLP | mg Inj. | % Inj. |
|---|---|---|---|---|---|---|
| 1 | 360 | 0 | 23 | 23 | 221.0 | 61.4 |
| 2 | 360 | 0 | 9 | 36 | 273.6 | 76.0 |
| 3 | 550 | 0 | 36 | 9 | 454.9 | 83.0 |
| 4 | 1006 | 3.0 * | 21 | 21 | 1005.9 | 100.0 |
| 5 | 1089 | 3.0 ** | 21 | 21 | 1089.2 | 100.0 |
| 6 | 600 | 0.25*** | 21 | 21 | 551.1 | 91.9 |
| 7 | 830 | 2.0*** | 21 | 21 | 814.7 | 98.2 |
| 8 | 1001 | 3.0*** | 21 | 21 | 995.1 | 99.4 |
| 9 | 4001 | 4.0*** | 21 | 21 | 3995.5 | 99.9 |
Acetonitrile;
Acetone;
DMSO
Each fraction collected in this experiment was dried in a miVac for two days at 40°C. After the samples were dried, they were each dissolved in 4 mL of methanol in order to perform TLC using a mixture of hexanes/ethyl acetate (2:1, v/v) on a normal phase TLC plate (10×10 cm). Developed TLC plates were initially analyzed under UV 254 nm, then stained with 5% vanillin and 1% H2SO4 in ethanol and heated.
Experiments 2 and 3:
These experiments were performed with the same HEMWat SS and operating parameters as in experiment 1. In experiment 2 the ratio of upper to lower phase was adjusted to 1/4 for sample preparation. A 360 mg portion of RCE was first mixed with 8.8 mL of upper phase. Lower phase was added drop-by-drop under sonication to complete the 44 mL sample volume. After filtration, 273.6 mg was loaded on the column. In experiment 3 the ratio of upper to lower phase was adjusted to 4/1 for sample preparation. In this experiment, 550 mg of RCE was dissolved in 44 mL of SS. After filtration, 454.9 mg was loaded onto the CPC column. The Sf values were 0.76 and 0.80 for these two experiments respectively.
Experiments 4 and 5:
Acetone and acetonitrile were chosen as solubility modifiers in an attempt to dissolve more than 1 g of RCE in a 50 mL sample. In experiments 4 and 5, 3.0 mL of acetonitrile or acetone, respectively, were added into equal amounts of upper and lower phase to a total volume of 42 mL. At first, 3.0 mL of modifier (additive) solvent was mixed with RCE under sonication to make a uniformly saturated solution. Then, 21 mL of upper phase was added drop-by-drop under sonication followed by 21 mL of lower phase. After adding acetone or acetonitrile during sample preparation for injection, both samples still appeared to be biphasic before injection. The Sf values for these two experiments were 0.79 and 0.81, respectively.
2.4. CPC fractionation with DMSO
Experiments 6-9:
These experiments were performed by mixing RCE in equal amounts of upper and lower phase to a total volume of 42 mL to which was added a 250 μL, 2.0 mL, 3.0 mL or 4.0 mL volume of DMSO (experiments 6, 7, 8, and 9 respectively). The sample preparation was achieved with the same procedure described for experiment 4. The Sf values for these four experiments were found between 0.77 and 0.80. Table 1 summarizes the sample preparation parameters for experiments 1 through 9.
2.5. Recovery of crude extract
Before experiment 8 was performed, the CPC instrument was rinsed with a ~750 mL quantity of methanol/water (1:1, v/v), and 350 mL each of methanol, water, acetone, and chloroform, HEMWat 5.5/4.5/5/5, v/v upper phase, and HEMWat 5.5/4.5/5/5, v/v lower phase. The masses of 150 empty test tubes were obtained to the nearest 0.01 mg. After the separation was finished, the solvents were evaporated from each test tube with a miVac for three days, then (freezing to −20°C after adding ~ 200 μL of distilled water to each test tube) lyophilized until all 150 fractions were dried (three or four days). Then each test tube was weighed again. The CPC instrument was rinsed for recovery of the extract retained in the CPC column. The waste generated by the flow stoppage between each test tube during sample collection was also collected and weighed. The syringe filter was weighed prior to use. After filtration, it was dried in an oven at 37°C and weighed.
2.6. Rechromatography of formononetin enriched fractions
In experiment 10, the formononetin enriched fractions 18 to 36 (173.4 mg) from experiment 8 were rechromatographed in HEMWat (4/6/4/6, v/v) under the similar operating parameters as previous experiments. Elution time was extended to 24 min with an 8 min extrusion to give a total time running of 32 min for the CPC experiment. The sample was prepared by dissolving the residue in equal volumes of upper and lower phases. A total of 160 test tubes were collected, evaporated and analyzed by TLC before combining them.
2.7. Acquisition of qHNMR spectra
Prior to NMR analysis, each sample was dried under vacuum (<1 mbar) in a desiccator overnight for removal of residual solvents. Samples were dissolved in 250 μL DMSO-d6, of which only 200 μL was delivered into a 3 mm NORELL NMR tube (Landisville, NJ, USA) with a 1000 μL analytical syringe. NMR spectra were acquired at 298 K. The qHNMR spectra of the RCE fractions were acquired using standard qHNMR parameters [24-26], which included a 60 s relaxation delay (D1), 46 receiver gain (RG), 32 scans (NS), flip angle (P1) 90° (6.4 μs), and automatic gradient shimming. NMR data was processed with a Lorentzian-Gaussian window function (exponential factor −0.3, Gaussian factor 0.05), and a baseline correction (fifth order polynomial). The residual DMSO-d5 signal at 2.500 ppm was used for chemical shift referencing.
2.8. External calibrants
Quantification using external calibrants (ECs) was performed for each experiment by using identical qHNMR parameters. A calibration curve was constructed with DMSO2 concentrations of 1.05, 2.28 and 4.29 mg/mL in 200 μL DMSO-d6 added to 3 mm NMR tubes [27]. The DMSO2 signal appeared at δH 2.993 ppm [6H]. A caffeine calibration curve was established using three different concentrations: 4.25, 8.50, and 16.95 mg/mL in 200 μL of DMSO-d6, using 3 mm NMR tubes [28, 29]. Three caffeine signals were chosen to establish the calibration curve: three methyl groups at δH 3.204 (singlet), 3.398 (singlet), and 3.867 (doublet) ppm. External calibration (EC) was performed for each experiment using identical qHNMR parameters. The data for the calibration curve of DMSO2 and caffeine such as relaxation time (T1) experiments are described in the Supporting Material Figs. S11-S18.
3,5-Dinitrobenzoic acid internal calibrant (IC) has been successfully used for quantitation of natural products and purity determination of organic molecules [23, 30]. The advantage of using 3,5-dinitrobenzoic acid instead of other ICs, is that the two signals at 8.794 and 8.904 ppm do not overlap with any RCE signal. The IC was weighed together with one lyophilized RCE sample in order to evaluate the accuracy of EC experiments (Supporting Material Fig. S25).
2.9. Limit of quantitation (LOQ) and limit of detection (LOD)
Limit of quantitation (LOQ) and limit of detection (LOD) thresholds were determined using the signal-to-noise ratio (S/N) method. According to the International Council for Harmonization protocols, an S/N value of 3:1 is a generally considered acceptable threshold LOD. For LOQ calculations in LC (Liquid Chromatography)-based methods, a typical S/N is 10:1 [31, 32]. A ratio of LOQ = 3.3 × LOD was used for qHNMR validation in the present study [24]. The S/N ratio calculator functions in MestReNova and Delta processing software were used to determine the S/N of individual signals.
2.10. LC-MS analysis
LC-MS separations were carried out using a Waters YMC AQ C18 column (2×10 mm, 3 μm particle size). The mobile phase consisted of 0.1% FA (solvent A) and acetonitrile (solvent B) with a linear gradient from 10% to 95% B in 30 min. The flow rate was 0.2 mL/min, and the column temperature was set at 30 °C. High-resolution accurate mass measurements were performed at the resolving power of 10,000 FWHM using Leu-enkephaline as the mass lock. Product ion spectra were recorded at 15 or 25 eV using argon as the collision gas. For identification of compounds, molecular compositions and tandem mass spectra were compared with the standard spectra from public and in-house generated databases as well as with spectra published in the primary literature.
3. Results and discussion
3.1. Modification of HEMWat upper and lower phase ratios
The SS selection for Centrifugal Partition Chromatography (CPC) was focused on providing the optimal resolution of the isoflavones of interest in the red clover extract (RCE) preparation. Once a suitable SS had been chosen, the practical consideration of loading capacity became important. In most Countercurrent Separation (CCS) literature, the sample is prepared by dissolving an extract in equal volumes of upper and lower phases. In most cases, this provides sufficient loading capacity for the intended separation. Whenever optimal loading of the sample is desired, two general approaches are most feasible: increasing the volume, or increasing the concentration of the sample in a volume accommodated by the sample loop. The second approach involves adjusting the solvent mixture in which the sample is dissolved. For this study, the second approach was adopted, because the sample loop of 50 mL was already optimal for the 266 mL CPC extractor column. Our goal was to accommodate at least 1 g of RCE per CPC separation.
Elution-extrusion CCS was chosen as the separation method primarily because it allows for the complete recovery of the sample. This method is superior to simply pumping out the column because elution chromatographic separation continues, after the inlet solvent is switched from mobile phase to stationary phase, until all the mobile phase has exited the column [33]. Another advantage is that extrusion effectively fills the column with fresh stationary phase for a subsequent separation. Indeed, injection of a new sample can be performed even before extrusion is completed [34].
The hexanes-ethyl acetate-methanol-water (HEMWat, v/v) SS with a component ratio of 5.5/4.5/5/5, v/v gave good resolution for the target isoflavonoids in RCE. However, it became apparent that the loading capacity of this SS, at a 1:1 ratio, was relatively low. Samples needed to be filtered to remove residual solids before injection into the CPC column. Filtering samples to remove insoluble materials is not desirable for the preparation of fractions for bioactivity analysis because such samples cannot be representative of the entire extract as valuable bioactive components may be lost or diminished.
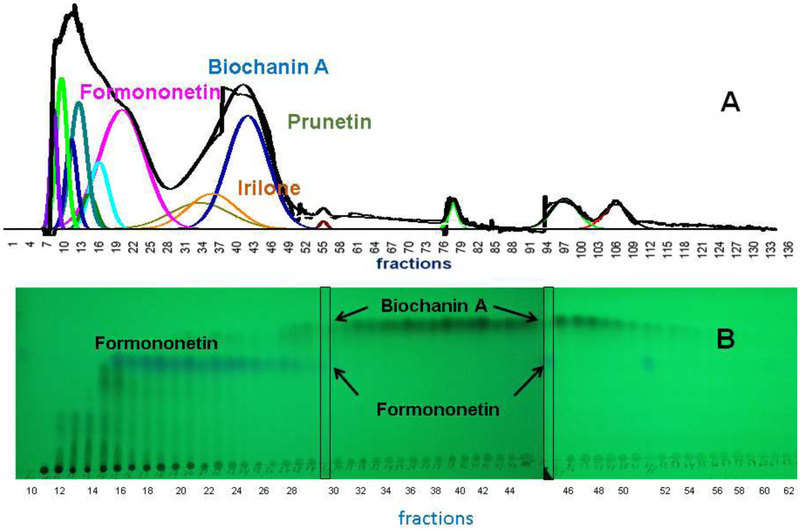
An attempt was made to improve sample loading by modifying the ratio of upper to lower phase in sample preparation. Initially, a 360 mg quantity of RCE was dissolved in equal amounts of HEMWat (5.5/4.5/5/5, v/v) upper and lower phases to make 46 mL (experiment 1). After sonication the sample was filtered, and the residual solids weighed to show that only 221 mg (61.4%) of the sample was dissolved. The subsequent CPC separation with this sample showed good resolution of formononetin, irilone, and a mixture of prunetin and biochanin A that was predicted by partitioning experiments (Fig. 1A). However, it is very likely that a certain amount to isoflavones were lost in the residual solids.
Fig. 1.

RCE loading capacity experiments 1, 2, and 3 (A, B and C, respectively) for HEMWat (5.5/4.5/5/5, v/v) SS with different upper phase to lower phase sample solution ratios. Flow rate 50 mL/min, column rotation 2500 rpm, column volume 266 mL, UV detection at 254 nm, Sf = 0.80-0.82, and sample volume 46 mL (Experiment 1) and 44 mL (Experiments 2 and 3). Extrusion switch volume started on test tube 75 (750 mL, 15 min, Kbiochanin A = 3.27). Fraction volumes were 10 mL each. Deconvolution was performed with Origin 2018b software with guidance from the TLC fractogram. A (Experiment 1): 221.0 mg RCE in 1:1 upper phase to lower phase. B (Experiment 2): 273.6 mg RCE in 1:4 upper phase to lower phase. C (Experiment 3): 454.9 mg RCE in 4:1 upper phase to lower phase.
Modifying the upper to lower phase ratio to 1:4 (v/v) resulted in a better dissolution of 360 mg of RCE in the sample volume (experiment 2). After filtration, 273.6 mg (76%) of the RCE was retained in the sample. The subsequent CPC separation with this sample showed similar resolution of target analytes to that in experiment 1 (Fig. 1B). The broadening of formononetin and irilone peaks may be attributed to a larger quantity of these isoflavones being present.
Modifying the upper and lower phase ratio to 4:1 resulted in the dissolution of 454.9 mg (82.7%) RCE in the sample volume (experiment 3). This was over twice the sample loading capacity of experiment 1. The subsequent CPC separation showed suitable resolution of the target analytes (Fig. 1C). The results of experiments 1, 2, and 3 showed that the loading capacity could be increased without serious adverse effects to resolution. However, sample filtering was still necessary and the goal of 1 g of RCE per CPC separation was still not achieved.
Interestingly, changes in the upper to lower phase ratio in conjunction with the mass of dissolved RCE influence the chromatographic profile in subtle ways. Some of the differences in analyte resolution in experiments 1, 2, and 3 may be directly attributed to the differences in loading capacity. Generally, higher loading capacity results in decreasing resolution due to mass transfer limitations of the mixing and settling processes inside the column. The solute-solute interactions between analytes in a mixture also become important enough to affect resolution as column loading increases. It is very likely that different phase volume ratios of the samples also contribute to subtle differences in observed K values and resolution (Table 2). For example, the stationary phase volume in the sample may displace stationary phase in the column as the sample enters the column chambers. The 1:1 ratio of the two phases was carried forward for the subsequent addition of solvent modifiers to allow for the most complete solubility of the range of sample components.
Table 2.
K value intervals for target isoflavones (FM = formononetin, IR = irilone, PR = prunetin, and BA = biochanin A). The corresponding UV chromatograms are found in Figs. 1-6, K value intervals were determined by deconvolution of UV254 chromatogram with TLC fractogram guidance.
| # Exp. | KFM | KIR | KPR | KBA |
|---|---|---|---|---|
| 1 | 0.50-1.12 | 1.12-1.85 | 2.03-3.07 | 2.03-3.68 |
| 2 | 0.39-1.24 | 0.76-2.10 | 1.73-2.83 | 2.22-3.44 |
| 3 | 0.39-1.24 | 0.76-1.85 | 1.36-2.83 | 1.97-3.44 |
| 4 | 0.09-1.30 | 1.00-2.22 | 0.85-2.06 | 1.25-2.37 |
| 5 | 0.26-1.44 | 1.59-1.99 | 1.15-3.22 | 1.15-2.93 |
| 6 | 0.27-1.30 | 0.75-1.85 | 1.12-2.83 | 1.49-3.44 |
| 7 | 0.15-1.55 | 0.63-2.22 | 1.55-2.71 | 1.73-3.44 |
| 8 | 0.15-1.55 | 0.63-2.22 | 1.55-2.71 | 1.73-3.44 |
3.2. Addition of acetonitrile and acetone
Modifying the sample solution with solvent modifiers is another strategy aimed at increasing the extract concentration. In experiment 4, the sample was formulated with a 3 mL aliquot of acetonitrile added to 42 mL of a 1:1 mixture of upper phase and lower phase. In this case, one gram of RCE was completely soluble in the sample volume. However, the subsequent CPC separation resulted in poor resolution of the target isoflavonoids with a general decrease in K values. With the introduction of acetonitrile, the isoflavonoid components became more soluble in the mobile (lower) phase and exited the column before they were suitably resolved.
The isoflavone overlap observed in the TLC fractogram was further explored by qHNMR analysis of selected fractions. First, fractions 30 through 52 were combined to determine the composition of the biochanin A peak. Biochanin A purity was assessed by using the 100% method as well as the external calibrant (EC) method with DMSO2 and caffeine as external standards (Table S1, Supporting Material). Biochanin A was found to be 89.54% w/w pure with residual amounts of the other three target isoflavones: 6.32% prunetin, 3.39% irilone, and 0.58% formononetin (Table 3).
Table 3.
qHNMR quantitation of the four target isoflavones (FM = formononetin, IR = irilone, PR = prunetin, and BA = biochanin A) in selected fractions from experiments 4 and 5. The corresponding chromatograms for experiments 4 and 5 are found in Figs. 3 and 4 respectively.
| 100% w/w qHNMR | FM | IR | PR | BA |
|---|---|---|---|---|
| Exp. 4 (Frs. 30-52) | 0.58 | 3.39 | 6.32 | 89.54 |
| Fr. 32 | 1.15 | 19.02 | 14.73 | 64.92 |
| Fr. 36 | 0.26 | 3.40 | 16.71 | 76.96 |
| Fr. 38 | 0.24 | 1.47 | 8.77 | 88.82 |
| Fr. 40 | 0.11 | 0.23 | 5.63 | 93.70 |
| Fr. 42 | - | - | 1.78 | 98.18 |
| Fr. 46 | - | - | 0.25 | 99.75 |
| Exp. 5 (Frs. 38-64) | 0.11 | 1.15 | 5.36 | 93.14 |
| Fr. 38 | 1.11 | 14.52 | 25.78 | 54.82 |
| Fr. 39 | 0.25 | 7.52 | 21.26 | 67.27 |
| Fr. 42 | - | 0.60 | 8.50 | 90.17 |
| Fr. 45 | - | - | 3.36 | 96.52 |
| Fr. 48 | - | - | 2.56 | 97.37 |
| Fr. 52 | - | - | 0.65 | 99.34 |
| Fr. 56 | - | - | 0.20 | 99.80 |
Exp. 4 (Frs. 30-52) and Exp. 5 (Frs. 38-64) are representing the combination of fractions in order to determine the content of isoflavonoids and related compounds.
The compositions of individual fractions 32, 36, 38, 40, 42, and 46 were also analyzed with qHNMR (Table S2, Supporting Material). The results, summarized in Table 3, showed that all four target isoflavones were found in four of the six fractions. The two fractions occurring after the biochanin A maximum still contained small amounts of prunetin. This analysis was necessary, in part, because the presence of irilone and prunetin in fractions was difficult to detect in the TLC fractogram (Fig. 2).
Fig. 2.
RCE loading capacity of A (experiment 4) for HEMWat (5.5/4.5/5/5, v/v) SS with acetonitrile added to the sample solution. Flow rate 50 mL/min, column rotation 2500 rpm, column volume 266 mL, UV detection at 254 nm, Sf = 0.79, and sample volume 45 mL. Fraction volumes were 10 mL each. Extrusion switch volume started on test tube 75 (750 mL, 15 min, Kbiochanin A = 1.91). Deconvolution was performed with Origin 2018b software with guidance from the TLC fractogram (B). 1006 mg of RCE was dissolved in 3 mL acetonitrile, 21 mL upper phase and 21 mL lower phase.
In experiment 5, the sample was formulated with a 3 mL aliquot of acetone added to 42 mL of a 1:1 mixture of upper phase and lower phase. Over one gram of RCE was completely soluble in the sample volume. Unfortunately, the subsequent CPC separation resulted in poor resolution of the target isoflavones. In contrast to the previous experiment, formononetin was better separated from a mixture of irilone, prunetin and biochanin A (Fig. 3).
Fig. 3.

RCE loading capacity A (experiment 5) for HEMWat (5.5/4.5/5/5, v/v) SS with acetone added to the sample solution. Flow rate 50 mL/min, column rotation 2500 rpm, column volume 266 mL, UV detection at 254 nm, Sf = 0.81, and sample volume 45 mL. Fraction volumes were 10 mL each. Extrusion switch volume started on test tube 75 (750 mL, 15 min, Kbiochanin A = 2.19). Deconvolution was performed with Origin 2018b software with guidance from the TLC fractogram (B). 1089.2 mg of RCE was dissolved in 3 mL acetone, 21 mL upper phase and 21 mL lower phase.
The isoflavone overlap observed in the TLC fractogram was further explored by qHNMR analysis of selected fractions. First, fractions 38 through 64 were combined to determine the composition of the fractions containing biochanin A. Purity was assessed by using the 100% method as well as the external calibrant (EC) method with DMSO2 and caffeine as external standards (Table S3, Supporting Material). Biochanin A was found to be 93.14% w/w pure with residual amounts of the other three target isoflavones: 5.36% prunetin, 1.15% irilone and 0.11% formononetin.
The compositions of individual fractions 38, 39, 42, 45, 48, 52, and 56 were also analyzed with qHNMR (Table S4, Supporting Material). The results summarized in Table 3 showed that there was a complete overlap of biochanin A and prunetin in the seven fractions. Overlap of all four isoflavones was seen in fractions 38 and 39. This analysis was necessary, in part, because the presence of irilone and prunetin in fractions was difficult to detect in the TLC fractogram (Fig. 3).
Experiments 4 and 5 reveal the perils of introducing a “foreign” solvent into the CPC process. A fifth solvent introduced into the HEMWat equilibrated column disrupted the balanced dynamics of equilibration and modified the partitioning of solutes within the column. The effect of solvent additives on the resolution of target isoflavones was nearly impossible to predict. Even after the separation experiment was conducted, it was difficult to explain the observed outcomes.
3.3. Addition of DMSO
DMSO was selected as the third solvent additive for this investigation. DMSO is considered to be a near-universal solvent for small organic compounds [10]. At least two articles have used DMSO as sample additive [11, 13]. Experiments 6, 7, 8 and 9 were performed by adding DMSO to the sample solution in aliquots of 250 μL, 2.0 mL, 3.0 mL and 4 mL, respectively. In contrast to acetonitrile and acetone, the retention times were not significantly shifted after introduction of DMSO. It was important to mix the RCE with the DMSO prior to dropwise addition of 22 mL of upper phase under ultrasound for 20 min followed by dropwise addition of 22 mL of lower phase.
In experiment 6, a total of 551.1 mg of RCE was dissolved in 42 mL of a 1:1 ratio of upper and lower phases after the addition of 250 μL DMSO. This was more than twice the amount of RCE dissolved in a greater sample volume without DMSO. A small amount (< 10%) of undissolved solids were removed by filtration. The subsequent CPC fractionation shown in Fig. 4A exhibited acceptable resolution of the four target isoflavones when compared with experiments 1, 2, and 3 (Table 2). This encouraging result led to increasing the amount of DMSO to 2 mL in the sample. This resulted in the dissolution of 814.7 mg of RCE in the sample. The ensuing CPC fractionation shown in Fig. 4B exhibited acceptable resolution of the four target isoflavones. In order to reach the goal of one gram of RCE per CPC separation, experiment 8 was initiated by dissolving nearly one gram of RCE in a sample modified with 3 mL of DMSO. The resulting CPC separation shows some loss of resolution due to increased sample loading, but the K values of peak maxima are unchanged (Fig. 4C).
Fig. 4.
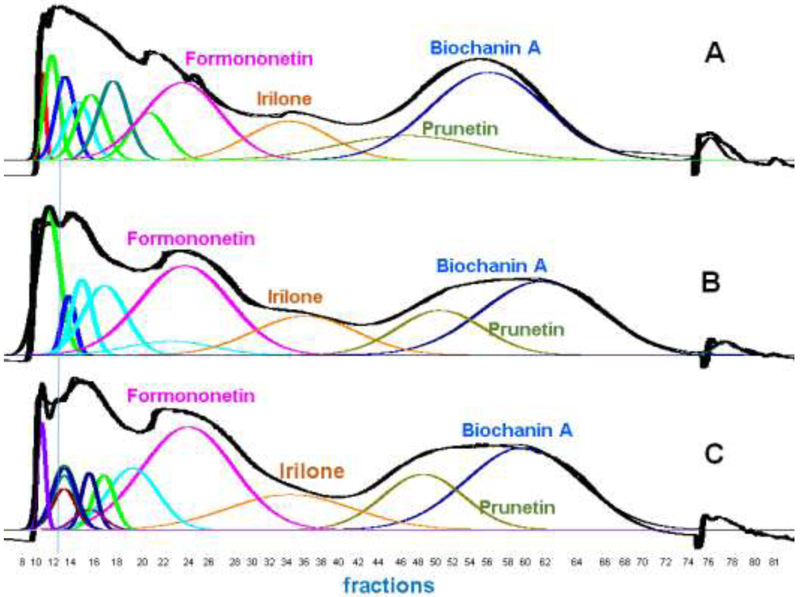
RCE loading capacity A, B, and C (experiments 6, 7, and 8) for HEMWat (5.5/4.5/5/5, v/v) SS with DMSO added to the sample solution. Flow rate 50 mL/min, column rotation 2500 rpm, column volume 266 mL, UV detection at 254 nm, Sf = 0.77-0.80, and sample volume 45 mL. Fraction volumes were 10 mL each. Extrusion switch volume started on test tube 75 (750 mL, 15 min, Kbiochanin A = 2.75). Deconvolution was performed with Origin 2018b software with guidance from the TLC fractogram. A. 551.1 mg of RCE was dissolved in 0.25 mL DMSO, 21 mL upper phase and 21 mL lower phase. B 814.7 mg of RCE was dissolved in 2 mL DMSO, 21 mL upper phase and 21 mL lower phase. C 995.1 mg of RCE was dissolved in 3 mL DMSO, 21 mL upper phase and 21 mL lower phase.
An attempt was made to push the limits of the sample loading by dissolving nearly 4 grams of RCE in a sample volume modified with 4 mL DMSO. Experiment 9 resulted in complete loss of resolution due to an overloaded column (Fig. S10, Supporting Material). An additional attempt was made to use the sample preparation conditions of experiment 3 with DMSO as a modifier. A total of 1.2 g of RCE was dissolved in 42 mL of biphasic solvent with the addition of 3 mL of DMSO. The subsequent CPC result is shown in Fig. S23. These experimental conditions were not used for DESIGNER extract preparation. Biochanin A and formononetin overlap due to their high concentration in the column.
The series of experiments 6-9 showed that DMSO is a useful additive to increase sample concentration without significantly affecting the resolution of the target analytes. One drawback of DMSO as an additive is that it is more difficult to remove from fractions than the other solvents used in this study. Fortunately, only a few fractions end up containing DMSO, which is difficult, but not impossible, to remove. Generally, fractions 8 to 16 contained all of the DMSO added during injection.
3.4. Extract recovery
Complete recovery of the original metabolites in the chromatographic fractions is an important requirement of DESIGNER extract preparation. Liquid-liquid separation techniques such as CPC are best suited to realize a high percentage of extract recovery. To confirm this, an extract recovery experiment was performed to create a mass fractogram and monitor all eluents from the CPC method developed in experiment 8. The test tubes used for recovery of the eluent were dried and weighed before experiment 8 was performed. In addition to weighing the contents of each fraction (980.6 mg), the insoluble residue left on the filter was also weighed (5.80 mg). The CPC instrument closes the elution nozzle and diverts the eluent into a waste container between test tubes. This waste was collected and combined with the column rinse after the experiment had finished (12.30 mg). The total of all the masses from test tubes, filter, waste, and rinsing the column was 998.7 mg, represent a 99.8% RCE recovery (Fig. 5). The resulting mass fractogram was an important complement to the UV chromatogram and TLC fractogram because it supplied information on fraction masses that cannot be measured by any other method. The RCE sample contains a significant mass of polar metabolites that are less studied than (iso)flavanoids but may play a role in bioactivity as bioactive metabolites themselves or components of NAtural Deep Eutectic Solvents (NADES) that enhance the stability and delivery of bioactive metabolites [35]. A group of poorly characterized polar/non-polar metabolites is also present in the eluent. Polar (hydrophilic) fractions contain isoflavonoid and other glycosides as residual components of the native red clover extract after hydrolysis [36]. On the other hand, non-polar/hydrophobic fractions are enriched in compounds containing aliphatic chains such as fatty acids. The composition of NADES is a mixture of organic acids, glycosides and fatty acids, these compounds were identified by NMR and LC-MS in the polar/hydrophilic fractions and non-polar hydrophobic fractions (Fig. S32-S36, Supporting Material).
Fig. 5.

RCE recovery (experiment 8) for HEMWat (5.5/4.5/5/5, v/v) SS with 3 mL DMSO added to the sample solution. Flow rate 50 mL/min, column rotation 2500 rpm, column volume 266 mL, Sf = 0.80, and sample volume 45 mL. Fraction volumes were 10 mL each. Extrusion switch volume was on test tube 75 (750 mL, 15 min, Kbiochanin A = 2.75). Deconvolution was performed with Origin 2018b software with guidance from the TLC fractogram. A. UV254 chromatogram of the CPC separation. B Mass fractogram of the CPC separation. C TLC fractogram of the CPC separation visualized under UV254.
Fractions 18-36 (Fig. 5 and Fig. 6) and 39-74 (Fig. 5) were combined to create fractions enriched in formononetin and biochanin A respectively. The K values corresponding to the absorption maxima of the formononetin and biochanin A peaks were 0.95 (fraction 24) and 2.75 (fraction 53) respectively. These combined fractions were analyzed with qHNMR to quantitate the isoflavonoid and related components. Table 4 shows that the biochanin A combined fraction is over 93.60% biochanin A (A4) with trace amounts of 2.30% prunetin, 1.17% formononetin, and 0.12% irilone. The formononetin-enriched combined fraction is less than 74.11% (A2) pure with five other isoflavonoids and related compounds present in varying amounts. The remaining compounds from experiment 8 were 11.17% irilone, 5.32% pratensein, 4.56% genistein, 0.98% pseudobaptigenin, and 0.80% kaempferol (Table S5-S6, Supporting Material).
Fig. 6.

DESIGNER extracts preparation experiment 10 for HEMWat (4/6/4/6, v/v) SS with a sample containing equal volumes of upper and lower phases. Flow rate 50 mL/min, column rotation 2500 rpm, column volume 266 mL, Sf = 0.78 and sample volume 45 mL. Fraction volumes were 10 mL each. Extrusion switch volume started on test tube 120 (1200 mL, 24 min, Kformononetin = 4.33). Deconvolution was performed with Origin 2018b software with guidance from the TLC fractogram. A. UV254 chromatogram of the CPC separation. B TLC fractogram of the CPC separation of fractions 10-116 visualized under UV254. C TLC fractogram of the CPC separation of fractions 64-116 visualized under UV254.
Table 4.
qHNMR analysis of combined fractions enriched in formononetin and biochanin A from experiments 8 and 10. A2 is the formononetin enriched combined fraction from experiment 8, A4 is the biochanin A enriched combined fraction from experiment 8, B2 is the formononetin enriched combined fraction from experiment 10. Compounds abbreviation are: FM = formononetin, IR = irilone, PRA = pratensein, GE = genistein, KA = kaempferol, PS = pseudobaptigenin, BA = biochanin A, PR = prunetin.
| 100% w/w qHNMR |
FM | IR | PR | BA | PRA | GE | KA | PS |
|---|---|---|---|---|---|---|---|---|
| A2 | 74.11 | 11.17 | - | - | 5.32 | 4.56 | 0.80 | 0.98 |
| A4 | 1.17 | 0.12 | 2.30 | 93.60 | - | - | - | - |
| B2 | 94.70 | - | - | - | - | 0.31 | 0.39 | 3.16 |
3.5. Formononetin enriched fraction
In order to improve the purity of the formononetin enriched combined fraction, experiment 10 was undertaken. The formononetin enriched combined fraction from experiment 8 was re-chromatographed in a HEMWat (4/6/4/6, v/v) SS. The more polar HEMWat SS increased the K value of formononetin to 4.33 which caused it to be well resolved from other metabolites in the fraction. It was not necessary to add DMSO to the sample for experiment 10. Fractions 79-116 were combined (131.58 mg) to give a formononetin enriched combined fraction, which was analyzed with qHNMR. Table 4 shows that the re-chromatographed formononetin is 94.70% (B2) pure and pseudobaptigenin (3.16%) with traces of kaempferol (0.39%), and genistein (0.31%), found by qHNMR and LC-MS (Table S7 and Fig. S24, Supporting Material).
3.6. DESIGNER extract preparation
The separation scheme shown in Fig. 7, outlines the preparation of DESIGNER extracts from experiments 8 and 10. Biochanin A and formononetin were isolated in purified fractions (Fig. 7 A4 & B2) with greater than 90% purity and yield as shown in Table 4. The importance of obtaining purified compounds not only in high purity, but also high yield is emphasized equally in DESIGNER methodology. This enabled the preparation of knockout extracts that are deficient in biochanin A and/or formononetin. This will have a great significance in understanding the bioactivity of the extract as a whole. The presence of high abundance metabolites such as biochanin A and formononetin tend to mask the bioactivity of minor components with high activity [37]. General loss of activity between the RCE and the component fractions would lead directly to investigation of additive and/or synergistic relationships between metabolites in separated fractions and would not be attributed to loss of active metabolites during the chromatographic process. There are at least five possible DESIGNER extracts: biochanin A enriched extract (A4), formononetin enriched extract (B2), biochanin knockout (combined A1, A3, A5, B1, B2, and B3), formononetin knockout (combined A1, A3, A4, A5, B1, and B3), and biochanin A & formononetin knockout (combined A1, A3, A5, B1, and B3). In addition, A1, A3, A5, B1, and B3 may be tested separately for a closer look a bioactivity trends (Fig. S8).
Fig. 7.

DESIGNER extract preparation scheme from experiments 8 and 10. Formononetin enriched fractions from experiment 8 (fractions 18-36, 173.4 mg, A2) were combined and chromatographed to yield 95% pure formononetin after experiment 10 (B2). Five DESINGER extracts may be formulated: biochanin A enriched extract (A4), formononetin enriched extract (B2), biochanin A knockout (A1, A3, A5, B1, B2 and B3), formononetin knockout (A1, A3, A4, A5, B1, and B3), and biochanin A & formononetin knockout (A1, A3, A5, B1, and B3).
3.7. qHNMR analysis of DESIGNER extracts
qHNMR analysis was employed to quantitate the amounts of the isoflavonoid targets in the DESIGNER extracts. The RCE starting material, analyzed by EC qHNMR, contained 15.09% and 14.59% of biochanin A and formononetin respectively (Fig. 8A and Fig. S8). The analysis of the enriched biochanin A (DESIGNER extract A4) and formononetin (DESIGNER extract B2) extracts were recorded in Table 4. The biochanin A and formononetin knockout DESIGNER extract was depleted in both biochanin A (1.34%) and formononetin (0.74%) (Fig. 8B and Fig S8). The biochanin A knockout DESIGNER extract was depleted in biochanin A (1.64%) and enriched in formononetin (19.73%) (Fig. 8C). The formononetin knockout DESIGNER extract was determined to contain 18.88% and 0.33% of biochanin A and formononetin, respectively (Fig. 8D). The remainder of the DESIGNER knockout extracts contained enriched quantities of the minor isoflavones, NADES components, and other metabolites present in the original RCE. Internal calibration (IC) and external calibration (EC) methods were compared for determining the percentage of biochanin A and formononetin in RCE extracts. Results provided an error of 2.27% for biochanin A and 1.22% for formononetin between the two methods. This result demonstrated that the EC quantitation method was sufficiently accurate (Fig. S25). LC-MS was useful to confirm the presence of daidzein and genistein in DESIGNER extracts (Fig. S20-S22). Additionally, all isoflavonoids were identified by using LC-MS-MS, (Supporting Materials Figs. S26-S31).
Figure 8.

The NMR (400 MHz) spectra of formononetin, biochanin A, RCE starting material and three DESIGNER knockout extracts. All spectra were acquired in DMSO-d6 under qNMR conditions. A. formononetin standard, B. biochanin A standard, C. qHNMR spectrum of the original RCE, D. the biochanin A and formononetin knockout DESIGNER extract, E the biochanin A knockout DESIGNER extract, F the formononetin knockout DESIGNER extract.
Using the approach of successive CCS with a polarity adjusted SS was the best strategy for further purification and separation of formononetin. A SS in the same HEMWat family but with different solvent proportions provided high purity and maximum recovery of formononetin from RCE. Other strategies that may be considered are recycling CCS with the same solvent system and related 2 dimensional CCS × CCS techniques. Recycling CCS is an effective method of separating compounds with similar K values but requires a special solvent delivery setup that pumps the effluent back into the column which may contaminate the pump. Other CCS × CCS techniques require complex (multiple) pump and column setups that necessitate intensive development work and increase the complexity of the workflow which is not possible in a laboratory environment where several researchers are using the same equipment [38, 39]. Improving the resolution of overlapping peaks by heartcut two-dimensional countercurrent chromatography with the same SS in both dimensions [40].
4. Conclusions
In this study, DESIGNER extracts of an isoflavone enriched RCE were produced by a two-step CPC fractionation scheme that employed optimized solvent systems and separation conditions. Even though a generally suitable SS was identified previously, extensive work was still required to increase the sample loading sufficiently to produce adequate quantities for in vivo bioactivity assays. Several attempts were made to increase the amount of RCE to one gram in a 45 mL sample loading solution. The desired sample loading was achieved, without disrupting the resolution, by adding DMSO to the sample.
Under optimal sample loading conditions, the preparation of five DESIGNER extracts was achieved with minimal sample loss employing CPC. The challenge of preparing DESIGNER extracts was to achieve both high purity and high recovery of DESIGNER extracts enriched in biochanin A and formononetin. The use of qHNMR analysis for the quantitation of the target isoflavones was an important aspect of this investigation, employing qHNMR, rather than the more commonly used UHPLC-UV, methodology allowed the quantitation of closely related congeners without the need for highly purified reference standards. While UHPLC-UV depends on UV-Vis absorption response factors that vary by constituent, qHNMR has a default unity response factor and, thus, there is no need for calibration of individual target analytes. Another advantage of NMR analysis was that compounds could be identified without authentic reference compounds for comparison. Finally, compounds could be quantified without contaminating the sample by using external calibration (EC in qHNMR).
The present study exemplifies how chemically complex botanical extracts with polypharmacological effects, such as red clover, can either be transformed into pharmacological tools that reveal otherwise invisible compound/compound interactions, or can be chemically designed towards a desired bioactivity profile for specific clinical purposes. One notable aspect of the present study is that it will enable the evaluation of a widely used botanical extract, with an array of marker constituents, in a panel of pharmacological assays. This will help advance the understanding of the multifactorial nature that botanical natural products have in both the biological and chemical domains.
By maintaining the chemical integrity of the complete metabolomic extract, the applied DESIGNER methodology enables a new level in the combined chemical and biological standardization of botanical products. The ability of specialized extracts to modulate bioactivities via phytochemical design was demonstrated for red clover as a prototype of a botanical that is used widely in the U.S., Europe, and other countries. Five DESIGNER extracts were produced with varying concentrations of biochanin A and formononetin. The method of CCS-based chemical subtraction [41] is a powerful tool that can help advance dietary supplements and phytomedicines to more rational, botanical-derived remedies, with more targeted biomedical applications. The DESIGNER approach may also be an attractive means of reducing interfering or unwanted bioactivities in botanical extracts that can potentially lead to the formulation of natural remedies with enhanced efficacy and/or safety profiles.
Supplementary Material
HIGHLIGHTS.
Countercurrent separation yields isoflavones-specific Red Clover DESIGNER extracts
The method produced gram-range quantities, sufficient for in vivo biological assays
Gravimetry demonstrated high efficiency and full, unbiased sample recovery
qHNMR spectroscopy provided purity, quantitation, and structural information
Acknowledgement
This work was supported mainly by grant P50 AT000155 and in part by U41 AT008706 from ODS and NCCIH of the NIH. Furthermore, technical support for CCS instrumentation from the team at Cherry Instruments, Wrightwood Technologies (Chicago, IL), in particular by Samuel Pro and Warren Friedel, is gratefully acknowledged. The authors wish to acknowledge the support by Dr. Yuzo Nishizaki of the National Institute of Health Sciences (Japan), currently a Visiting Scholar in our laboratory, who kindly provided the qHNMR calibration reference sample.
Footnotes
Publisher's Disclaimer: This is a PDF file of an unedited manuscript that has been accepted for publication. As a service to our customers we are providing this early version of the manuscript. The manuscript will undergo copyediting, typesetting, and review of the resulting proof before it is published in its final citable form. Please note that during the production process errors may be discovered which could affect the content, and all legal disclaimers that apply to the journal pertain.
Conflict of interest
The authors declare no compete in financial interests.
Appendix A. Supporting Material
Supplementary data associated with this article can be found, in the online version, at [TBD by publisher]. The original NMR data (FIDs) are made available at the following permanent link: https://doi.org/10.7910/DVN/13NPRW..
References
- [1].Atanasov AG, Waltenberger B, Pferschy-Wenzig EM, Linder T, Wawrosch C, Uhrin P, Temml V, Wang L, Schwaiger S, Heiss EH, Rollinger JM, Schuster D, Breuss JM, Bochkov V, Mihovilovic MD, Kopp B, Bauer R, Dirsch VM, Stuppner H, Discovery and resupply of pharmacologically active plant-derived natural products: A review, Biotechnol. Adv, 33 (2015) 1582–1614. [DOI] [PMC free article] [PubMed] [Google Scholar]
- [2].Ramos Alvarenga RF, Friesen JB, Nikolic D, Simmler C, Napolitano JG, van Breemen R, Lankin DC, McAlpine JB, Pauli GF, Chen SN, K-targeted metabolomic analysis extends chemical subtraction to DESIGNER extracts: selective depletion of extracts of hops (Humulus lupulus), J.Nat.Prod, 77 (2014) 2595–2604. [DOI] [PMC free article] [PubMed] [Google Scholar]
- [3].Uto T, Tuvshintogtokh I, Shoyama Y, Preparation of knockout extract for determination of really active compound using MAb, Curr. Drug Discov. Technol, 8 (2011) 16–23. [DOI] [PubMed] [Google Scholar]
- [4].Yuan CS, Tanaka H, Bioactivity of American ginseng by knockout extract preparation using monoclonal antibody, Curr. Drug Discov. Technol, 8 (2011) 32–41. [DOI] [PubMed] [Google Scholar]
- [5].Fukuda N, Tanaka H, Shoyama Y, Isolation of the pharmacologically active saponin ginsenoside Rb1 from ginseng by immunoaffinity column chromatography, J. Nat. Prod, 63 (2000) 283–285. [DOI] [PubMed] [Google Scholar]
- [6].Thiébaut D, Rosset R, Hydrodynamic and hydrostatic high-speed countercurrent chromatography and its coupling with various kinds of detectors: Application to biochemical separations, J. Chromatogr. A, 626 (1992) 41–52. [Google Scholar]
- [7].Ito Y, High-speed countercurrent chromatography, Nature, 326 (1987) 419–420. [DOI] [PubMed] [Google Scholar]
- [8].Liu Y, Friesen JB, McAlpine JB, Pauli GF, Solvent system selection strategies in countercurrent separation, Planta Med., 81 (2015) 1582–1591. [DOI] [PMC free article] [PubMed] [Google Scholar]
- [9].Ito Y, Conway WD, High-speed countercurrent chromatography, Crit. Rev. Anal. Chem, 17 (1986) 65–143. [Google Scholar]
- [10].Martin D, Weise A, Niclas HJ, The solvent dimethyl sulfoxide, Angew. Chem. Int. Ed. Engl, 6 (1967) 318–334. [DOI] [PubMed] [Google Scholar]
- [11].Ignatova S, Sumner N, Colclough N, Sutherland I, Gradient elution in counter-current chromatography: a new layout for an old path, J. Chromatogr. A, 1218 (2011) 6053–6060. [DOI] [PubMed] [Google Scholar]
- [12].Qiu F, Friesen JB, McAlpine JB, Pauli GF, Design of countercurrent separation of Ginkgo biloba terpene lactones by nuclear magnetic resonance, J. Chromatogr. A, 1242 (2012) 26–34. [DOI] [PMC free article] [PubMed] [Google Scholar]
- [13].Wagenaar FL, Hochlowski JE, Pan JY, Tu NP, Searle PA, Purification of high-throughput organic synthesis libraries by counter-current chromatography, J. Chromatogr. A, 1216 (2009) 4154–4160. [DOI] [PubMed] [Google Scholar]
- [14].Lim TK, Trifolium pratense, in: Edible medicinal and non-medicinal plants: Volume 7, Flowers, Springer, Dordrecht, Netherlands, 2014, pp. 925–948. [Google Scholar]
- [15].Saviranta NM, Julkunen-Tiitto R, Oksanen E, Karjalainen RO, Leaf phenolic compounds in red clover (Trifolium pratense L.) induced by exposure to moderately elevated ozone, Environ. Pollut, 158 (2010) 440–446. [DOI] [PubMed] [Google Scholar]
- [16].Wu Q, Wang M, Simon JE, Determination of isoflavones in red clover and related species by high-performance liquid chromatography combined with ultraviolet and mass spectrometric detection, J. Chromatogr. A, 1016 (2003) 195–209. [DOI] [PubMed] [Google Scholar]
- [17].Pfitscher A, Reiter E, Jungbauer A, Receptor binding and transactivation activities of red clover isoflavones and their metabolites, J. Steroid Biochem. Mol. Biol, 112 (2008) 87–94. [DOI] [PubMed] [Google Scholar]
- [18].Lipovac M, Chedraui P, Gruenhut C, Gocan A, Kurz C, Neuber B, Imhof M, The effect of red clover isoflavone supplementation over vasomotor and menopausal symptoms in postmenopausal women, Gynecol. Endocrinol, 28 (2012) 203–207. [DOI] [PubMed] [Google Scholar]
- [19].Spagnuolo P, Rasini E, Luini A, Legnaro M, Luzzani M, Casareto E, Carreri M, Paracchini S, Marino F, Cosentino M, Isoflavone content and estrogenic activity of different batches of red clover (Trifolium pratense L.) extracts: an in vitro study in MCF-7 cells, Fitoterapia, 94 (2014) 62–69. [DOI] [PubMed] [Google Scholar]
- [20].Booth NL, Overk CR, Yao P, Burdette JE, Nikolic D, Chen SN, Bolton JL, van Breemen RB, Pauli GF, Farnsworth NR, The chemical and biologic profile of a red clover (Trifolium pratense L.) phase II clinical extract, J. Altern. Complement. Med, 12 (2006) 133–139. [DOI] [PMC free article] [PubMed] [Google Scholar]
- [21].Hu M, Krausz K, Chen J, Ge X, Li J, Gelboin HL, Gonzalez FJ, Identification of CYP1A2 as the main isoform for the phase I hydroxylated metabolism of genistein and a prodrug converting enzyme of methylated isoflavones, Drug Metab. Dispos, 31 (2003) 924–931. [DOI] [PubMed] [Google Scholar]
- [22].Friesen JB, Pauli GF, GUESSmix-guided optimization of elution-extrusion counter-current separations, J. Chromatogr. A, 1216 (2009) 4225–4231. [DOI] [PubMed] [Google Scholar]
- [23].Phansalkar RS, Simmler C, Bisson J, Chen SN, Lankin DC, McAlpine JB, Niemitz M, Pauli GF, Evolution of quantitative measures in NMR: quantum mechanical qHNMR advances chemical standardization of a red clover (Trifolium pratense) extract, J. Nat. Prod, 80 (2017) 634–647. [DOI] [PMC free article] [PubMed] [Google Scholar]
- [24].Gödecke T, Napolitano JG, Rodriguez-Brasco MF, Chen SN, Jaki BU, Lankin DC, Pauli GF, Validation of a generic quantitative (1)H NMR method for natural products analysis, Phytochem. Anal, 24 (2013)581–597. [DOI] [PMC free article] [PubMed] [Google Scholar]
- [25].Pauli GF, qNMR--a versatile concept for the validation of natural product reference compounds, Phytochem. anal, 12 (2001) 28–42. [DOI] [PubMed] [Google Scholar]
- [26].Pauli GF, Jaki BU, Lankin DC, A routine experimental protocol for qHNMR illustrated with Taxol, J. Nat. Prod, 70 (2007) 589–595. [DOI] [PMC free article] [PubMed] [Google Scholar]
- [27].Wells RJ, Cheung J, Hook JM, Dimethylsulfone as a universal standard for analysis of organics by QNMR, Accredit. Qual. Assur, 9 (2004) 450–456. [Google Scholar]
- [28].Burton IW, Quilliam MA, Walter JA, Quantitative 1H NMR with external standards: use in preparation of calibration solutions for algal toxins and other natural products, Anal. Chem, 77 (2005) 3123–3131. [DOI] [PubMed] [Google Scholar]
- [29].Pauli GF, Gödecke T, Jaki BU, Lankin DC, Quantitative 1H NMR. development and potential of an analytical method: an update, J. Nat. Prod, 75 (2012) 834–851. [DOI] [PMC free article] [PubMed] [Google Scholar]
- [30].Weber M, Hellriegel C, Rueck A, Wuethrich J, Jenks P, Using high-performance 1H NMR (HP-qNMR®) for the certification of organic reference materials under accreditation guidelines-describing the overall process with focus on homogeneity and stability assessment, J. Pharm. Biomed. Anal, 93 (2014) 102–110. [DOI] [PubMed] [Google Scholar]
- [31].Saito T, Ihara T, Koike M, Kinugasa S, Fujimine Y, Nose K, Hirai T, A new traceability scheme for the development of international system-traceable persistent organic pollutant reference materials by quantitative nuclear magnetic resonance, Accredit. Qual. Assur, 14 (2009) 79–86. [Google Scholar]
- [32].Sugimoto N, Tada A, Suematsu T, Arifuku K, Development of an absolute quantification method for organic compounds using quantitative NMR (qNMR) and improvement of the reliability of food analysis, Food Foods Ingredients J. Jpn, 215 (2010) 129–136. [Google Scholar]
- [33].Berthod A, Friesen JB, Inui T, Pauli GF, Elution–Extrusion countercurrent chromatography: theory and concepts in metabolic analysis, Anal. Chem, 79 (2007) 3371–3382. [DOI] [PMC free article] [PubMed] [Google Scholar]
- [34].Wu D, Cao X, Wu S, Overlapping elution-extrusion counter-current chromatography: a novel method for efficient purification of natural cytotoxic andrographolides from Andrographis paniculata, J. Chromatogr. A, 1223 (2012) 53–63. [DOI] [PubMed] [Google Scholar]
- [35].Liu Y, Friesen JB, McAlpine JB, Lankin DC, Chen S-N, Pauli GF, Natural deep eutectic solvents: properties, applications, and perspectives, J. Nat. Prod, 81 (2018) 679–690. [DOI] [PMC free article] [PubMed] [Google Scholar]
- [36].Malca-Garcia GR, Zagal D, Graham J, Nikolic D, Friesen JB, Lankin DC, Chen SN, Pauli GF, Dynamics of the isoflavone metabolome of traditional preparations of Trifolium pratense L, J. Ethnopharmacol, 238 (2019) ( 10.1016/j.jep.2019.111865, in press). [DOI] [PMC free article] [PubMed] [Google Scholar]
- [37].Choules MP, Klein LL, Lankin DC, McAlpine JB, Cho SH, Cheng J, Lee H, Suh JW, Jaki BU, Franzblau SG, Pauli GF, Residual complexity does impact organic chemistry and drug discovery: the case of rufomyazine and rufomycin, J. Org. Chem, 83 (2018) 6664–6672. [DOI] [PMC free article] [PubMed] [Google Scholar]
- [38].Friesen JB, McAlpine JB, Chen S-N, Pauli GF, Countercurrent separation of natural products: An update, J. Nat. Prod, 78 (2015) 1765–1796. [DOI] [PMC free article] [PubMed] [Google Scholar]
- [39].Michel T, Destandau E, Elfakir C, New advances in countercurrent chromatography and centrifugal partition chromatography: focus on coupling strategy, Anal. Bioanal. Chem, 406 (2014) 957–969. [DOI] [PubMed] [Google Scholar]
- [40].Müller M, Murić M, Glanz L, Vetter W, Improving the resolution of overlapping peaks by heartcut two-dimensional countercurrent chromatography with the same solvent system in both dimensions, J. Chromatogr. A, 1596 (2019) 142–151. [DOI] [PubMed] [Google Scholar]
- [41].Chen SN, Turner A, Jaki BU, Nikolic D, van Breemen RB, Friesen JB, Pauli GF, An experimental implementation of chemical subtraction, J. Pharm. Biomed. Anal, 46 (2008) 692–698. [DOI] [PMC free article] [PubMed] [Google Scholar]
Associated Data
This section collects any data citations, data availability statements, or supplementary materials included in this article.