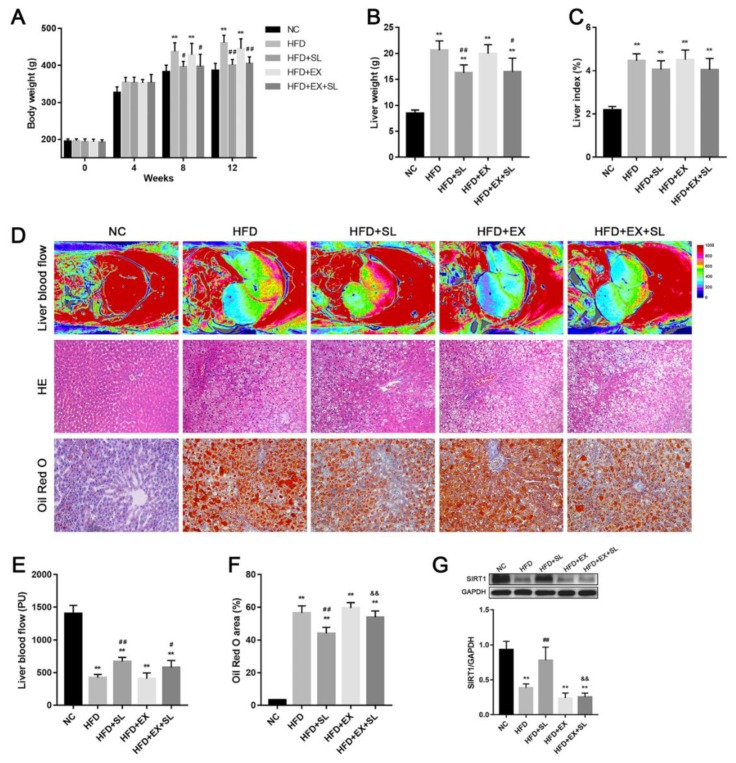
Figure 1.
Body characteristics and liver histology in the five groups. (A) Body weight. (B) Liver weight. (C) Liver index. (D) Representative images of liver blood flow (upper panel), HE staining (middle panel, ×200 magnification) and Oil Red O staining (bottom panel, ×200 magnification) of the liver. (E) Quantification of liver blood flow. (F) Quantification of Oil Red O-positive area. (G) Western blot analysis of SIRT1 expression in the liver. ** p < 0.01, compared with NC group; # p < 0.05, ## p < 0.01, compared with HFD group; && p < 0.01, compared with HFD+SL group.

