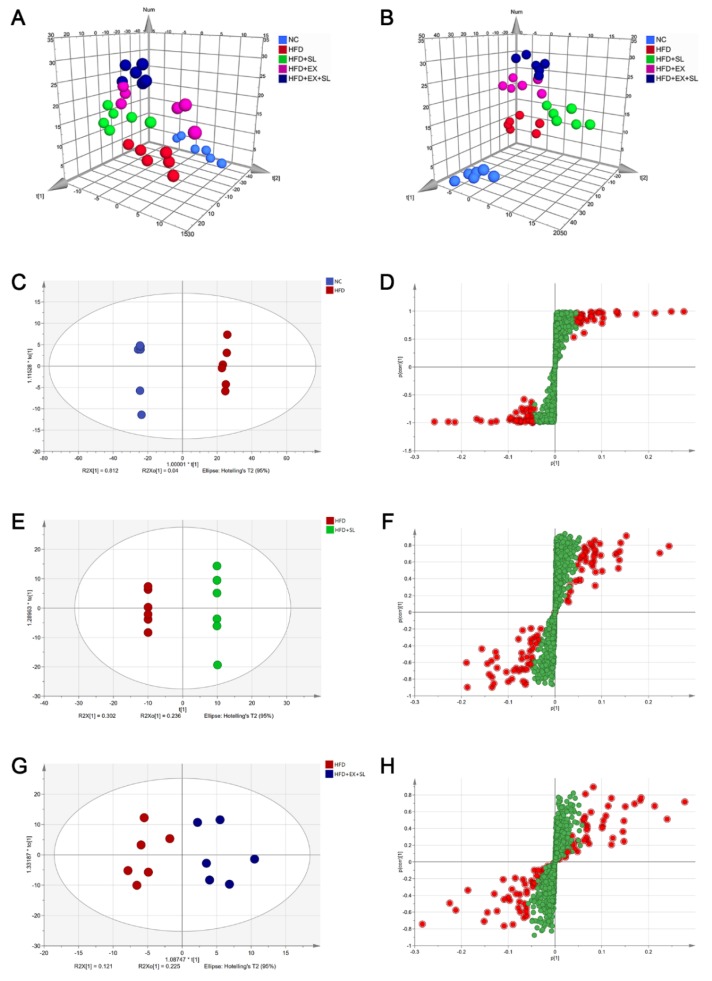
Figure 4.
Score plots of the PCA, PLS-DA and OPLS-DA models of the five groups. (A) 3D PCA score plot of the five groups [R2X(cum) = 0.761, Q2(cum) = 0.687]. (B) 3D PLS-DA score plot of the five groups [R2X(cum) = 0.757, Q2(cum) = 0.357]. (C) OPLS-DA score plot between NC group and HFD group [R2X(cum) = 0.852, Q2(cum) = 0.995]. (D) S-plot between NC group and HFD group. (E) OPLS-DA score plot between HFD group and HFD + SL group [R2X(cum) = 0.88, Q2(cum) = 0.845]. (F) S-plot between HFD group and HFD + SL group. (G) OPLS-DA score plot between HFD group and HFD + EX + SL group [R2X(cum) = 0.347, Q2(cum) = 0.087]. (H) S-plot between HFD group and HFD + EX + SL group. Potential variables in S-plot are marked in red when VIP >1.5.

