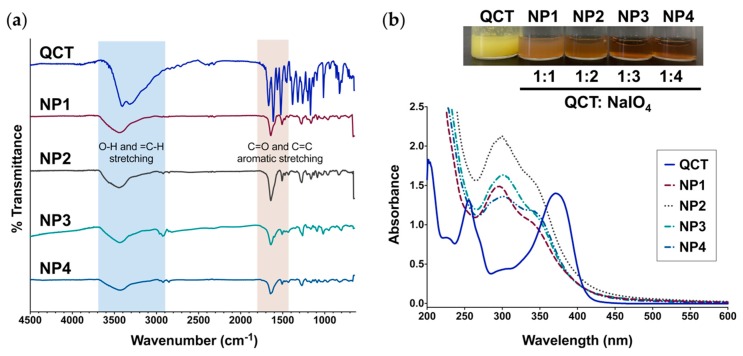
Figure 3.
(a) FT-IR spectra of QCT and the NPs prepared in this study showing the characteristic bands for O-H stretching (3300–3700 cm−1), C=C-H stretching (2900–3000 cm−1), and C=O/C=C aromatic stretching (1400–1800 cm−1); (b) UV-Vis spectra of QCT and QCT NPs. Top: Aqueous dispersions of QCT NPs synthesized at a QCT:NaIO4 ratio of 1:1, 1:2, 1:3, and 1:4 (NP1, NP2, NP3, and NP4, respectively) next to QCT. UV-Vis revealed a shift in the characteristic absorption bands of QCT after oxidation and NP formation, accompanied by a distinct change in color.

