Figure 10.
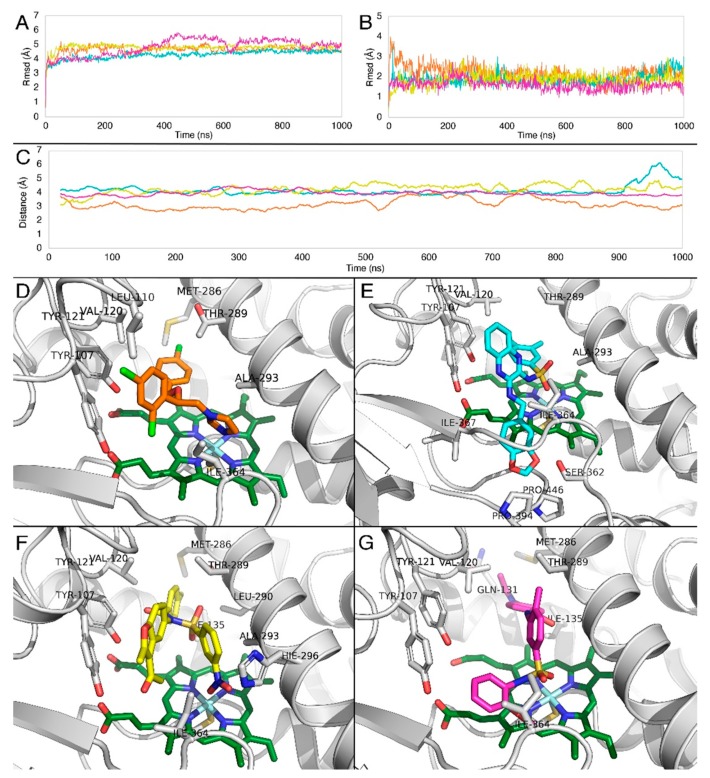
RMSD of (A) Cα atoms of CYP51A, (Β) ligands along the MD trajectory. Graph colors correspond to the coloring of the four ligands. (C) Averaged distances obtained from the molecular dynamics between the heme iron and imidazole nitrogen of R-econazole (orange), center of mass of the two sulfonyl oxygens of compound 1 (cyan), center of mass of the two nitro group oxygens of compound 2 (yellow) and the center of mass of the two sulfonyl oxygens of compound 4 (magenta). Representative complexes obtained from the MD simulations of Aspergillus fumigatus CYP51A with (D) R-econazole (orange), (E) compound 1 (cyan), (F) compound 2 (yellow), and (G) compound 4 (magenta). The heme molecule is represented in green.

