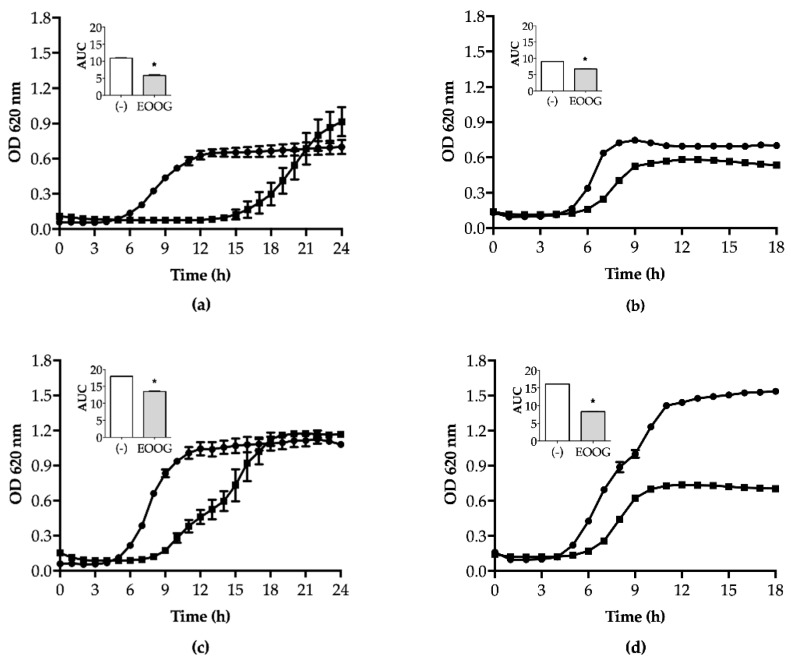
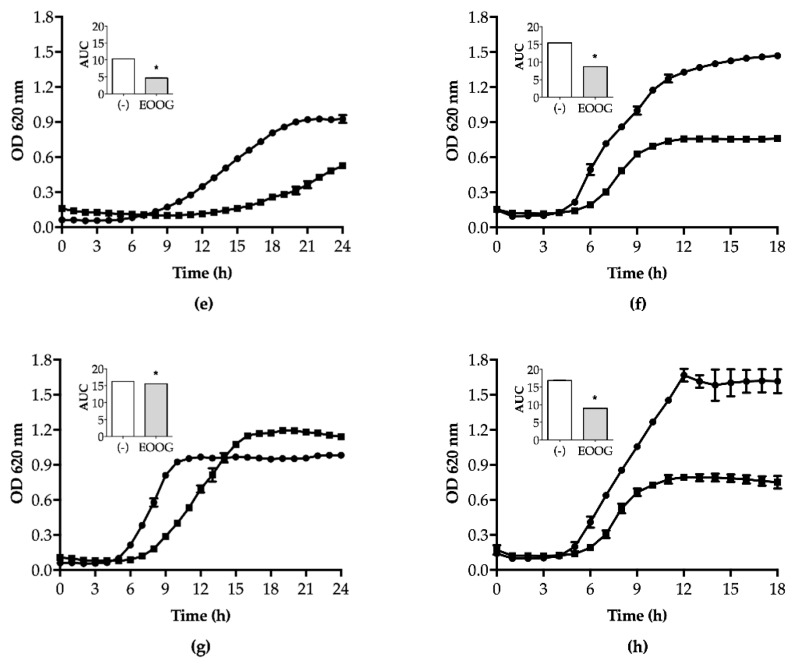
Figure 2.
Effect of EOOG (1/2 MIC) on the bacterial growth curve (line graph) of S. aureus (a) ATCC 6538, (c) 2B, (e) 5B, and (g) 7B and of E. coli, (b) ATCC 11303, (d) P12, (f) P25, and (h) P36. The growth level of the EOOG-treated (■/grey bar) and -untreated (●/white bar) cells was quantified by the area under the curve (AUC). * Statistically different by ANOVA (p < 0.01) compared to the control group.


