Abstract
Clear cell renal cell carcinoma (ccRCC) is the most common type of kidney cancer. Novel biomarkers of ccRCC may provide crucial information on tumor features and prognosis. The present study aimed to determine whether the expression of γ-aminobutyric acid (GABA) A receptor subunit θ (GABRQ) could serve as a novel prognostic marker of ccRCC. GABA is the main inhibitory neurotransmitter in the brain that activates the receptor GABAA, which is comprised of three subunit isoforms: GABRA3, GABRB3 and GABRQ. A recent study reported that GABRQ is involved in the initiation and progression of hepatocellular carcinoma; however, the role of GABRQ in ccRCC remains unknown. In the present study, clinical and transcriptomic data were obtained from cohorts of the International Cancer Genome Consortium (ICGC) and The Cancer Genome Atlas (TCGA). Differential GABRQ expression levels among early (TI and II), late (TIII and IV), nonmetastatic (M0) and metastatic (M1, primary tumor) stages of ccRCC samples were then identified. Furthermore, the use of GABRQ as a prognostic gene was analyzed using Uno's C-index based on the time-dependent area under the curve (AUC), the AUC of the receiver operating characteristic curve at 5 years, the Kaplan-Meier survival curve and multivariate analysis. The survival curve analysis revealed that low GABRQ mRNA expression was significantly associated with a poor prognosis of ccRCC (P<0.001 and P=0.0012 for TCGA and ICGC data, respectively). In addition, analyses of the C-index and AUC values further supported this discriminatory power. Furthermore, the prognostic value of GABRQ mRNA expression was confirmed by multivariate Cox regression analysis. Taken together, these results suggested that GABRQ mRNA expression may be considered as a novel prognostic biomarker of ccRCC.
Keywords: γ-aminobutyric acid receptor A subunit θ, clear cell renal cell carcinoma, prognosis, The Cancer Genome Atlas, International Cancer Genome Consortium
Introduction
Kidney cancer is one of the top 10 types of cancer in terms of incidence and mortality rate in men and women, worldwide. Renal cell carcinoma (RCC) accounts for ~90% of all kidney cancer cases (1,2). RCC mainly includes the papillary subtype, the chromophobe subtype and clear cell RCC (ccRCC) (3); ccRCC is the most common subtype. Furthermore, 30% of patients with kidney cancer present with metastatic disease (4). Surgical resection remains the most effective therapeutic strategy against clinically localized ccRCC. In addition, current treatments are focused on vascular endothelial growth factor receptor (VEGFR)-targeted therapy and mammalian target of rapamycin (mTOR) inhibition (5,6). However, 30% patients with ccRCC are already at an advanced stage at the time of diagnosis (7), and the current therapeutic strategies offer limited efficacy. The development of novel therapeutic drugs for ccRCC is therefore challenging and it is crucial to determine efficient prognostic biomarkers of ccRCC in order to develop an effective treatment.
As the best-known inhibitory neurotransmitter in the brain, γ-aminobutyric acid (GABA) activates three pharmacologically and structurally distinct classes of receptor: GABAA, GABAB and GABAC (8). Among them, GABAA is the major inhibitory receptor in the central nervous system (9,10). Notably, GABAA receptor subunit θ (GABRQ) can bind with other receptors to form a functional chloride channel that mediates inhibitory synaptic transmission in the mature central nervous system (9). GABA and receptor GABAA are also present in peripheral tissues, including cancerous cells, but their precise function is poorly understood (10). A previous study revealed that GABRQ is overexpressed in hepatocellular carcinoma and that GABA promotes the proliferation of cancer cells through GABRQ (11). However, the prognostic significance of GABRQ in ccRCC remains unknown. To the best of our knowledge, the present study was the first to report on the mRNA expression levels of GABRQ in samples obtained from the International Cancer Genome Consortium (ICGC) (12) and The Cancer Genome Atlas (TCGA) (13,14) primary-ccRCC cohorts. The results suggested that the mRNA expression levels of GABRQ may be considered an effective prognostic marker of ccRCC.
Materials and methods
Patient data and characteristics
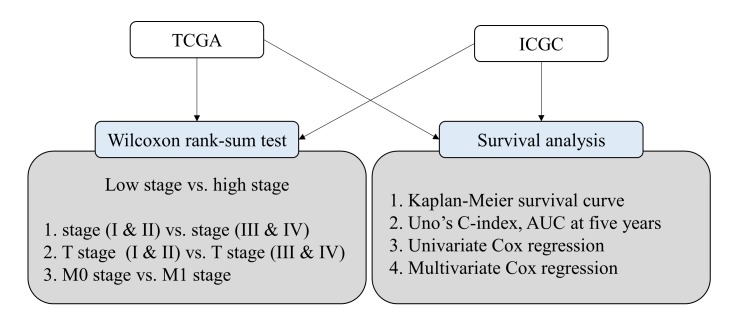
The clinical and transcriptomic data from patients with ccRCC were downloaded from TCGA (13,14) and ICGC (12) databases in March 2018. To identify the prognostic significance of GABRQ (Table I). TCGA and ICGC databases are approved for the quality of patient data and are widely used in numerous studies. No additional quality assessment was performed, since data that were not produced by a reputable institution were excluded. Samples with insufficient survival information were excluded (15,16). The overall study workflow is presented in Fig. 1. Comparative analyses between normal and tumor cells was conducted with the use of publicly available microarray data from the Oncomine database. To relate GABRQ copy number (17), the GSE20306 dataset (n=449) was used.
Table I.
Characteristics of patients from TCGA and ICGC databases.
| Characteristic | TCGA (%) | ICGC (%) |
|---|---|---|
| ATCC stage | ||
| I | 216 (48.4) | 48 (52.7) |
| II | 46 (10.3) | 12 (13.2) |
| III | 111 (24.9) | 13 (14.3) |
| IV | 71 (15.9) | 9 (9.9) |
| Not available | 2 (0.4) | 9 (9.9) |
| Grade | ||
| I | 9 (2.0) | – |
| II | 189 (42.4) | – |
| III | 175 (39.2) | – |
| IV | 68 (15.2) | – |
| Not available | 5 (1.1) | – |
| Sex | ||
| Male | 290 (65.0) | 52 (57.1) |
| Female | 156 (35.0) | 39 (42.9) |
| Age (mean ± standard deviation) | 60.62±12.80 | 60.47±10.03 |
| Total number of patients | 446 | 91 |
AJCC, American Joint Committee on Cancer; ICGA, International Cancer Genome Consortium; TCGA, The Cancer Genome Atlas.
Figure 1.
Flowchart of the present study. AUC, area under the curve; ICGA, International Cancer Genome Consortium; TCGA, The Cancer Genome Atlas.
Statistical analyses
Wilcoxon's rank-sum test was performed to identify the differences in GABRQ expression between early and late stages of ccRCC in TCGA and ICGC cohorts. Survival analyses to predict overall survival of patients with ccRCC and the associated statistical analyses were conducted using R software (version 3.5.0; The R Foundation for Statistical Computing; 2018; http://www.R-project.org). Furthermore, to validate the prognostic value of GABRQ, the following statistical methods were carried out: i) Uno's C-index; ii) area under the curve (AUC) in receiver operating characteristics (ROC) at 5 years; and iii) P-value from log-rank test of Kaplan-Meier survival curve to evaluate the accuracy of the discrimination, as described previously using the ‘survival’ and ‘survAUC’ R packages (16,18). The C-index is a well-known parameter of the fit of a survival model within a continuous time period during a clinical study (19,20). Regarding the survival curve analyses, the optimal cutoff value that had the maximal Uno's C-index by 5-fold cross-validation was determined as previously described (15,16,18). Since the RNA sequencing data from TCGA and ICGC had been obtained using different sequencing and normalization methods, the absolute value of gene expression varied widely among datasets. For these reasons, the optimal cutoff values were different for each cohort. T and M stage information in both cohorts was sufficient to perform subgroup analysis; however, as there was no information for N stage, subgroup analysis was not performed (12–14). Univariate and multivariate Cox regression analyses were performed to compare the effects of GABRQ expression (as a categorical value) on prognosis and other clinical variables.
Results
Patient characteristics
A total of 446 and 91 patients from the TCGA and ICGC databases, respectively, were analyzed in the present study (12–14,21,22). The 446 patients from TCGA comprised 290 men and 156 women. The 91 patients from the ICGC comprised 52 men and 39 women. The patient characteristics investigated in the present study are listed in Table I.
Downregulation of GABRQ at late stages of ccRCC
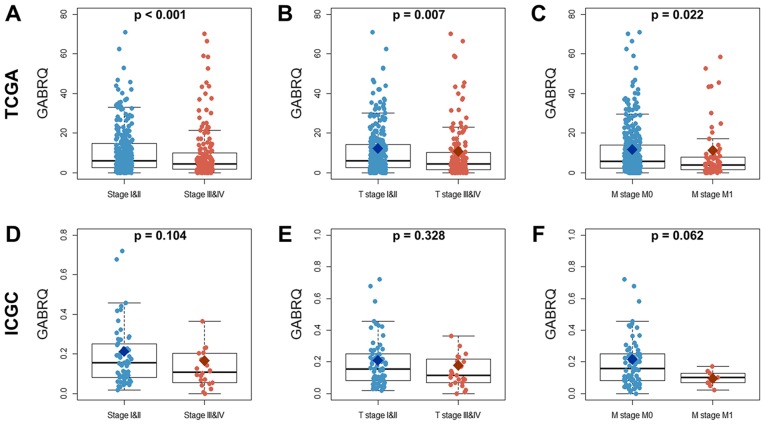
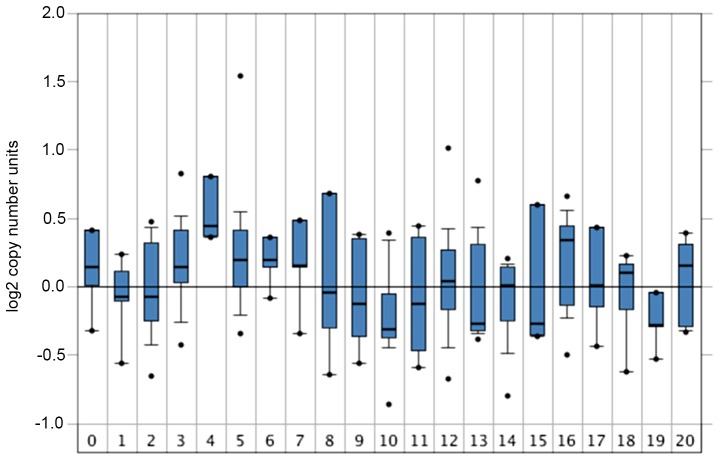
The mRNA expression levels of GABRQ were compared among samples from early (TI and II), late (TIII and IV), nonmetastatic (M0) and metastatic (M1, primary tumor) stages of ccRCC (Table II) from TCGA and ICGC cohorts. The mRNA expression levels of GABRQ were much higher in early (TI and II) and nonmetastatic (M0) ccRCC samples compared with in late (TIII and IV) and metastatic (M1, primary tumor) ccRCC samples in TCGA (Fig. 2). The similar trend was seen in the ICGC but this was not statistically significant. In addition, GABRQ copy numbers are decreased in several types of cancers, including kidney cancers, leukemia, multiple myeloma and prostate cancers (Fig. 3).
Table II.
Optimal cutoff values for γ-aminobutyric acid receptor A subunit θ expression in TCGA and ICGC cohorts.
| Dataset | Cutoff value |
|---|---|
| TCGA | 4.9689 |
| ICGC | 0.1440 |
ICGA, International Cancer Genome Consortium; TCGA, The Cancer Genome Atlas.
Figure 2.
Comparison of GABRQ mRNA expression among early (TI and II), late (TIII and IV), nonmetastatic (M0), and metastatic (M1, primary tumor) stages of ccRCC samples from TCGA and ICGC cohorts. (A-C) GABRQ expression values in ccRCC samples from TCGA cohort. (D-F) GABRQ expression values in ccRCC samples from ICGC cohort. ccRCC, clear cell renal cell carcinoma; GABRQ, γ-aminobutyric acid receptor A subunit θ; ICGA, International Cancer Genome Consortium; TCGA, The Cancer Genome Atlas.
Figure 3.
GABRQ gene expression in tumors. The copy number of GABRQ in tumors in the Oncomine database corresponds to the GSE20306 dataset (n=449) (36). The x-axis represents the number of patients with different types of cancer: 0, Normal (n=4); 1, Bladder (n=9); 2, Brain and central nervous system (n=17); 3, Breast (n=21); 4, Cervical (n=7); 5, Colorectal (n=21); 6, Esophageal (n=4); 7, Gastric (n=5); 8, Head and neck (n=6); 9, Kidney (n=8); 10, Leukemia (n=33); 11, Liver (n=9); 12, Lung (n=78); 13, Lymphoma (n=41); 14, Melanoma (n=12); 15, Myeloma (n=5); 16, Other (n=7); 18, Pancreatic (n=9); 19, Prostate (n=5) and 20, Sarcoma (n=20). GABRQ, γ-aminobutyric acid receptor A subunit θ.
Prognostic value of GABRQ mRNA expression in patients with ccRCC
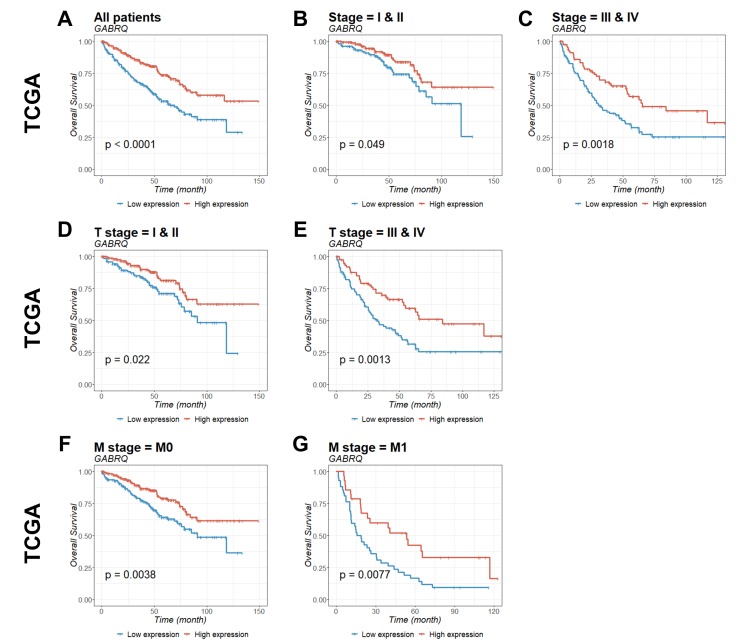
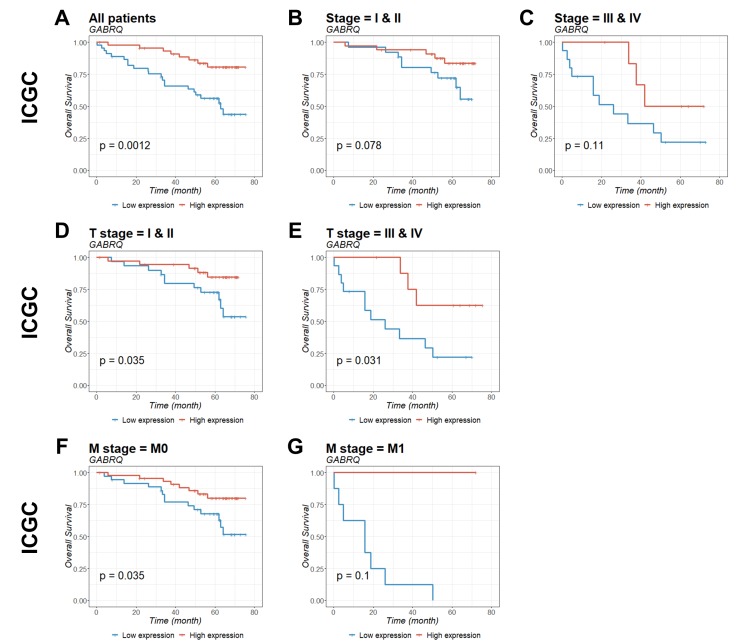
To identify the prognostic significance of GABRQ in ccRCC, survival curves for GABRQ mRNA expression (Table II) and survival within TCGA (Fig. 4) and ICGC (Fig. 5) cohorts were analyzed. Patients with low GABRQ mRNA expression in the primary tumor in the two cohorts had significantly shorter overall survival time compared with patients with higher GABRQ mRNA expression (Figs. 4 and 5). Prognostic value was then examined using multivariate Cox regression analysis (Table III). The multivariate analysis conformed that GABRQ mRNA expression was an independent prognostic factor for ccRCC.
Figure 4.
Kaplan-Meier estimation of GABRQ mRNA expression as a prognostic biomarker in patients with ccRCC. The association of GABRQ gene expression with overall survival among patients from TCGA was examined. Gene expression was analyzed for (A) all patients, (B) stage I and II, (C) stage III and IV, (D) T stage I and II, (E) T stage III and IV, (F) M stage 0, and (G) M stage 1. P-values were calculated by the log-rank test and are provided in the bottom left of each plot. ccRCC, clear cell renal cell carcinoma; GABRQ, γ-aminobutyric acid receptor A subunit θ; TCGA, The Cancer Genome Atlas; M0, non-metastatic; M1, primary tumor.
Figure 5.
Kaplan-Meier estimation of GABRQ mRNA expression as a prognostic biomarker in patients with ccRCC. The association of GABRQ gene expression with overall survival among patients from the ICGC was examined. Gene expression was analyzed for (A) all patients, (B) stage I and II, (C) stage III and IV, (D) T stage I and II, (E) T stage III and IV, (F) M stage 0, and (G) M stage 1. P-values were calculated by the log-rank test and are provided in the bottom left of each plot. ccRCC, clear cell renal cell carcinoma; GABRQ, γ-aminobutyric acid receptor A subunit θ; ICGC, International Cancer Genome Consortium; M0, non-metastatic; M1, primary tumor.
Table III.
Univariate and multivariate analyses of overall survival in each cohort.
| A, TCGA | ||||||||
|---|---|---|---|---|---|---|---|---|
| Univariate Cox regression | Multivariate Cox regression | |||||||
| Variable | P-value | Hazard ratio | 95% confidence interval | P-value | Hazard ratio | 95% confidence interval | ||
| GABRQ (categorical) | <0.001c | 0.483 | 0.348 | 0.672 | <0.001c | 0.562 | 0.401 | 0.788 |
| Age | <0.001 c | 1.033 | 1.018 | 1.047 | <0.001c | 1.030 | 1.015 | 1.046 |
| Stage (I, II vs. III, IV) | <0.001c | 3.478 | 2.474 | 4.888 | <0.001c | 2.883 | 2.012 | 4.132 |
| Sex (female vs. male) | 0.333 | 0.850 | 0.612 | 1.181 | 0.859 | 0.969 | 0.688 | 1.366 |
| Grade (I, II vs. III, IV) | <0.001c | 2.247 | 1.572 | 3.212 | 0.135 | 1.340 | 0.913 | 1.968 |
| B, ICGC | ||||||||
| Univariate Cox regression | Multivariate Cox regression | |||||||
| Variable | P-value | Hazard ratio | 95% confidence interval | P-value | Hazard ratio | 95% confidence interval | ||
| GABRQ (categorical) | 0.002b | 0.283 | 0.126 | 0.638 | 0.014a | 0.343 | 0.146 | 0.804 |
| Age | 0.109 | 1.031 | 0.993 | 1.071 | 0.448 | 1.015 | 0.976 | 1.056 |
| Stage | <0.001c | 4.796 | 2.264 | 10.16 | <0.001c | 4.628 | 2.094 | 10.232 |
| (I, II vs. III, IV) | ||||||||
| Sex (female vs. male) | 0.863 | 1.066 | 0.517 | 2.194 | 0.307 | 0.657 | 0.294 | 1.470 |
P<0.05
P<0.01
P<0.001. GABRQ, γ-aminobutyric acid receptor A subunit θ; ICGA, International Cancer Genome Consortium; TCGA, The Cancer Genome Atlas.
C-index and AUC of GABRQ
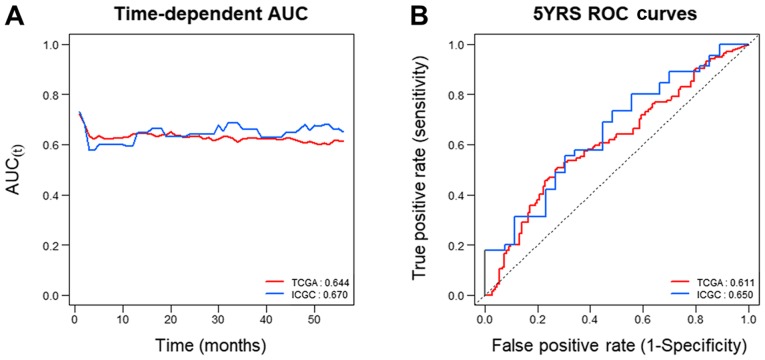
To assess whether GABRQ mRNA expression could be considered a prognostic biomarker of ccRCC, Uno's C-index based on the time-dependent AUC analysis and the AUC of the receiver operating characteristic curve at 5 years were examined. The results demonstrated that GABRQ mRNA had high C-index values in the two independent cohorts (TCGA: 0.644 and ICGC: 0.670; Fig. 6A and Table IV). The 5-year ROC curves yielded high AUC values for both TCGA and ICGC (0.611 and 0.650, respectively; Fig. 6B). These results suggest that GABRQ mRNA expression is useful to predict prognosis of patients with ccRCC.
Figure 6.
Time-dependent AUC and ROC curve analysis at 5 years according to GABRQ mRNA expression in TCGA and ICGC samples. Analysis of GABRQ gene expression in TCGA (red) and ICGC (blue) samples according to (A) time-dependent AUC and (B) ROC curve at 5 years. C-index values are provided in the bottom right corner of each plot. AUC, area under the curve; GABRQ, γ-aminobutyric acid receptor A subunit θ; ICGA, International Cancer Genome Consortium; ROC, receiver operating characteristic; TCGA, The Cancer Genome Atlas.
Table IV.
C-index values of GABRQ in the specified categories of TCGA and ICGC cohorts.
| C-index | ||
|---|---|---|
| Categories | TCGA | ICGC |
| All patients | 0.644 | 0.670 |
| Stage I & II | 0.597 | 0.639 |
| Stage III & IV | 0.634 | 0.585 |
| T (I & II) | 0.600 | 0.621 |
| T (III & IV) | 0.645 | 0.671 |
| M0 | 0.623 | 0.652 |
| M1 | 0.644 | 0.655 |
ICGA, International Cancer Genome Consortium; TCGA, The Cancer Genome Atlas.
Discussion
Classification of ccRCC includes localized and advanced ccRCC. Numerous therapeutic options are currently available for localized ccRCC; however the most effective therapy remains surgical resection. Furthermore, there are no suitable drugs for the adjuvant treatment of local kidney cancer (23). Current treatments of advanced ccRCC target VEGFR and mTOR (24). Due to recent advances in biotechnology, including next-generation sequencing, bioinformatics has rapidly developed and highlighted a great number of potential biomarkers (25). Numerous patient databases are freely available to the public, including the Gene Expression Omnibus and TCGA, which contain extensive gene expression data that can be used to determine novel biomarkers (26). Notably, these databases can be used to identify essential biomarkers for effective prognosis of ccRCC. In addition, molecular markers that can be used in combination with the current cancer staging systems need to be identified.
The present study demonstrated that GABRQ mRNA expression could be a prognostic marker of ccRCC. In particular, low GABRQ mRNA expression was associated with a poor prognosis among patients with ccRCC. A previous study indicated that GABRQ is overexpressed in hepatocellular carcinoma and that GABA promotes the proliferation of cancer cells through GABRQ (11). In addition, GABA can inhibit colon cancer cell migration associated with the norepinephrine-induced pathway (27), and via the GABAB pathway, which is involved in prostate cancer metastasis and invasion (28). Although GABRQ may contribute to cancer progression, it has been reported that it can serve additional roles in other types of disease, including essential tremor (8) and migraines (29).
This study presented some methodological limitations. Since the expression data of GABRQ in the two independent cohorts were obtained through different methods, the absolute expression values differed for each cohort. The cutoff values of GABRQ were therefore different for each cohort. Most cohort studies present the same technical limitations, unless data processing was performed by the same hospital and at the same time. To identify the involvement of GABRQ in ccRCC, experiments need to be conducted at the protein level. However, there are numerous studies that have determined prognostic biomarkers based on mRNA expression (for example oncotype DX (30), MammaPrint (31) and gene signatures tests (19,32–34)). Although the present study did not confirm GABRQ function at the protein level, mRNA-based studies are emerging in this field, and represent time- and cost-effective methods.
The main conclusions from the present study may strengthen the foundation of precision medicine via analysis of transcriptomic data. mRNA-based prognostic markers have been identified in numerous diseases, including cancer, and certain markers are so accurate that they can be included in clinical guidelines (19,32,35–37). The results from both cohorts analyzed in this study demonstrated that lower GABRQ mRNA expression was associated with a worse ccRCC prognosis. In addition, GABRQ copy numbers were much lower in numerous types of cancer, including kidney cancer, leukemia, multiple myeloma and prostate cancer, according to genomic analyses from Oncomine (17) (Fig. 6). Although there are limitations to transcriptome-based studies of GABRQ, the results from the present study suggested that GABRQ mRNA expression may be considered a novel prognostic biomarker of ccRCC.
Acknowledgements
Not applicable.
Funding
The present study was supported by the MRC program (grant no. NRF-2015R1A5A2009656), the National Research Foundation of Korea (NRF) funded by the Korean government (MSIT) (grant no. NRF-2018R1C1B6001290) and the Convergence Medical Institute of Technology R&D project (grant no. CMIT2019-03) of Pusan National University Hospital. In addition, this work was supported by the Collaborative Genome Program for Fostering New Post-Genome Industry of the NRF funded by the Korean government (MSIT; grant no. NRF-2017M3C9A6047610).
Availability of data and materials
The datasets used and/or analyzed during the current study are available from the corresponding author on reasonable request.
Authors' contributions
DL, MH, SOO and YHK contributed to the design of the study. CMH, JYK, SMP, DSP, DHS, HJS, HSY, CDKi, CDKa and MEH acquired the data. MH, YH, DSP, DHS, HJS, HSY, CDKi, CDKa and MEH acquired and analyzed the data. DL, SOO and YHK drafted the manuscript. DL, DSP, DHS, HJS, HSY, CDKi, CDKa, MEH, SOO and YHK revised and edited the manuscript. DL, SOOO and YHL acquired funding, resources and supervised the project.
Ethics and consent to participate
Not applicable.
Patient consent for publication
Not applicable.
Competing interests
The authors declare that they have no competing interests.
References
- 1.Siegel RL, Miller KD, Jemal A. Cancer statistics, 2018. CA Cancer J Clin. 2018;68:7–30. doi: 10.3322/caac.21442. [DOI] [PubMed] [Google Scholar]
- 2.Choueiri TK, Motzer RJ. Systemic therapy for metastatic renal-cell carcinoma. N Engl J Med. 2017;376:354–366. doi: 10.1056/NEJMra1601333. [DOI] [PubMed] [Google Scholar]
- 3.Srigley JR, Delahunt B, Eble JN, Egevad L, Epstein JI, Grignon D, Hes O, Moch H, Montironi R, Tickoo SK, et al. The international society of urological pathology (ISUP) Vancouver classification of renal Neoplasia. Am J Surg Pathol. 2013;37:1469–1489. doi: 10.1097/PAS.0b013e318299f2d1. [DOI] [PubMed] [Google Scholar]
- 4.Nickerson ML, Jaeger E, Shi Y, Durocher JA, Mahurkar S, Zaridze D, Matveev V, Janout V, Kollarova H, Bencko V, et al. Improved identification of von Hippel-Lindau gene alterations in clear cell renal tumors. Clin Cancer Res. 2008;14:4726–4734. doi: 10.1158/1078-0432.CCR-07-4921. [DOI] [PMC free article] [PubMed] [Google Scholar]
- 5.Powles T, Albiges L, Staehler M, Bensalah K, Dabestani S, Giles RH, Hofmann F, Hora M, Kuczyk MA, Lam TB, et al. Updated European association of urology guidelines recommendations for the treatment of first-line metastatic clear cell renal cancer. Eur Urol. 2017 Dec 7; doi: 10.1016/j.eururo.2017.11.016. doi: 10.1016/j.eururo.2017.11.016 (Epub ahead of print) [DOI] [PubMed] [Google Scholar]
- 6.Powles T, Staehler M, Ljungberg B, Bensalah K, Canfield SE, Dabestani S, Giles R, Hofmann F, Hora M, Kuczyk MA, et al. Updated EAU Guidelines for clear cell renal cancer patients who fail vegf targeted therapy. Eur Urol. 2016;69:4–6. doi: 10.1016/j.eururo.2015.10.017. [DOI] [PubMed] [Google Scholar]
- 7.Karakiewicz PI, Briganti A, Chun FK, Trinh QD, Perrotte P, Ficarra V, Cindolo L, De la Taille A, Tostain J, Mulders PF, et al. Multi-institutional validation of a new renal cancer-specific survival nomogram. J Clin Oncol. 2007;25:1316–1322. doi: 10.1200/JCO.2006.06.1218. [DOI] [PubMed] [Google Scholar]
- 8.Garcia-Martin E, Martinez C, Alonso-Navarro H, Benito-León J, Lorenzo-Betancor O, Pastor P, Puertas I, Rubio L, López-Alburquerque T, Agúndez JA, Jiménez-Jiménez FJ. Gamma-aminobutyric acid GABRA4, GABRE, and GABRQ receptor polymorphisms and risk for essential tremor. Pharmacogenet Genomics. 2011;21:436–439. doi: 10.1097/FPC.0b013e328345bec0. [DOI] [PubMed] [Google Scholar]
- 9.Neelands TR, Zhang J, Macdonald RL. GABA(A) receptors expressed in undifferentiated human teratocarcinoma NT2 cells differ from those expressed by differentiated NT2-N cells. J Neurosci. 1999;19:7057–7065. doi: 10.1523/JNEUROSCI.19-16-07057.1999. [DOI] [PMC free article] [PubMed] [Google Scholar]
- 10.Haydar TF, Wang F, Schwartz ML, Rakic P. Differential modulation of proliferation in the neocortical ventricular and subventricular zones. J Neurosci. 2000;20:5764–5774. doi: 10.1523/JNEUROSCI.20-15-05764.2000. [DOI] [PMC free article] [PubMed] [Google Scholar]
- 11.Li YH, Liu Y, Li YD, Liu YH, Li F, Ju Q, Xie PL, Li GC. GABA stimulates human hepatocellular carcinoma growth through overexpressed GABAA receptor theta subunit. World J Gastroenterol. 2012;18:2704–2711. doi: 10.3748/wjg.v18.i21.2704. [DOI] [PMC free article] [PubMed] [Google Scholar]
- 12.International Cancer Genome Consortium. Hudson TJ, Anderson W, Artez A, Barker AD, Bell C, Bernabé RR, Bhan MK, Calvo F, Eerola I, et al. International network of cancer genome projects. Nature. 2010;464:993–998. doi: 10.1038/nature08987. [DOI] [PMC free article] [PubMed] [Google Scholar]
- 13.Cerami E, Gao J, Dogrusoz U, Gross BE, Sumer SO, Aksoy BA, Jacobsen A, Byrne CJ, Heuer ML, Larsson E, et al. The cBio cancer genomics portal: An open platform for exploring multidimensional cancer genomics data. Cancer Discov. 2012;2:401–404. doi: 10.1158/2159-8290.CD-12-0095. [DOI] [PMC free article] [PubMed] [Google Scholar]
- 14.Cancer Genome Atlas Research Network. Weinstein JN, Collisson EA, Mills GB, Shaw KR, Ozenberger BA, Ellrott K, Shmulevich I, Sander C, Stuart JM. The cancer genome atlas pan-cancer analysis project. Nat Genet. 2013;45:1113–1120. doi: 10.1038/ng.2764. [DOI] [PMC free article] [PubMed] [Google Scholar]
- 15.Ha M, Han ME, Kim JY, Jeong DC, Oh SO, Kim YH. Prognostic role of TPD52 in acute myeloid leukemia: A retrospective multicohort analysis. J Cell Biochem. 2019;120:3672–3678. doi: 10.1002/jcb.27645. [DOI] [PubMed] [Google Scholar]
- 16.Han ME, Kim JY, Kim GH, Park SY, Kim YH, Oh SO. SAC3D1: A novel prognostic marker in hepatocellular carcinoma. Sci Rep. 2018;8:15608. doi: 10.1038/s41598-018-34129-9. [DOI] [PMC free article] [PubMed] [Google Scholar]
- 17.Rhodes DR, Yu J, Shanker K, Deshpande N, Varambally R, Ghosh D, Barrette T, Pandey A, Chinnaiyan AM. ONCOMINE: A cancer microarray database and integrated data-mining platform. Neoplasia. 2004;6:1–6. doi: 10.1016/S1476-5586(04)80047-2. [DOI] [PMC free article] [PubMed] [Google Scholar]
- 18.Cho SH, Pak K, Jeong DC, Han ME, Oh SO, Kim YH. The AP2M1 gene expression is a promising biomarker for predicting survival of patients with hepatocellular carcinoma. J Cell Biochem. 2019;120:4140–4146. doi: 10.1002/jcb.27699. [DOI] [PubMed] [Google Scholar]
- 19.Kim YH, Jeong DC, Pak K, Goh TS, Lee CS, Han ME, Kim JY, Liangwen L, Kim CD, Jang JY, et al. Gene network inherent in genomic big data improves the accuracy of prognostic prediction for cancer patients. Oncotarget. 2017;8:77515–77526. doi: 10.18632/oncotarget.20548. [DOI] [PMC free article] [PubMed] [Google Scholar]
- 20.Uno H, Cai T, Pencina MJ, D'Agostino RB, Wei LJ. On the C-statistics for evaluating overall adequacy of risk prediction procedures with censored survival data. Stat Med. 2011;30:1105–1117. doi: 10.1002/sim.4154. [DOI] [PMC free article] [PubMed] [Google Scholar]
- 21.Hoshida Y, Nijman SM, Kobayashi M, Chan JA, Brunet JP, Chiang DY, Villanueva A, Newell P, Ikeda K, Hashimoto M, et al. Integrative transcriptome analysis reveals common molecular subclasses of human hepatocellular carcinoma. Cancer Res. 2009;69:7385–7392. doi: 10.1158/0008-5472.CAN-09-1089. [DOI] [PMC free article] [PubMed] [Google Scholar]
- 22.Shtraizent N, DeRossi C, Nayar S, Sachidanandam R, Katz LS, Prince A, Koh AP, Vincek A, Hadas Y, Hoshida Y, et al. MPI depletion enhances O-GlcNAcylation of p53 and suppresses the Warburg effect. Elife. 2017;6(pii):e22477. doi: 10.7554/eLife.22477. [DOI] [PMC free article] [PubMed] [Google Scholar]
- 23.Subramanian P, Haas NB. Recent advances in localized RCC: A focus on VEGF and immuno-oncology therapies. Urol Oncol. 2018;36:23–30. doi: 10.1016/j.urolonc.2017.09.008. [DOI] [PubMed] [Google Scholar]
- 24.Wang Y, Chen L, Wang G, Cheng S, Qian K, Liu X, Wu CL, Xiao Y, Wang X. Fifteen hub genes associated with progression and prognosis of clear cell renal cell carcinoma identified by coexpression analysis. J Cell Physiol. 2019;234:10225–10237. doi: 10.1002/jcp.27692. [DOI] [PubMed] [Google Scholar]
- 25.Guan L, Tan J, Li H, Jin X. Biomarker identification in clear cell renal cell carcinoma based on miRNA-seq and digital gene expression-seq data. Gene. 2018;647:205–212. doi: 10.1016/j.gene.2017.12.031. [DOI] [PubMed] [Google Scholar]
- 26.Gao C, Zhou C, Zhuang J, Liu L, Liu C, Li H, Liu G, Wei J, Sun C. MicroRNA expression in cervical cancer: Novel diagnostic and prognostic biomarkers. J Cell Biochem. 2018;119:7080–7090. doi: 10.1002/jcb.27029. [DOI] [PubMed] [Google Scholar]
- 27.Joseph J, Niggemann B, Zaenker KS, Entschladen F. The neurotransmitter gamma-aminobutyric acid is an inhibitory regulator for the migration of SW 480 colon carcinoma cells. Cancer Res. 2002;62:6467–6469. [PubMed] [Google Scholar]
- 28.Azuma H, Inamoto T, Sakamoto T, Kiyama S, Ubai T, Shinohara Y, Maemura K, Tsuji M, Segawa N, Masuda H, et al. Gamma-aminobutyric acid as a promoting factor of cancer metastasis; induction of matrix metalloproteinase production is potentially its underlying mechanism. Cancer Res. 2003;63:8090–8096. [PubMed] [Google Scholar]
- 29.Plummer PN, Colson NJ, Lewohl JM, MacKay RK, Fernandez F, Haupt LM, Griffiths LR. Significant differences in gene expression of GABA receptors in peripheral blood leukocytes of migraineurs. Gene. 2011;490:32–36. doi: 10.1016/j.gene.2011.08.031. [DOI] [PubMed] [Google Scholar]
- 30.Paik S, Shak S, Tang G, Kim C, Baker J, Cronin M, Baehner FL, Walker MG, Watson D, Park T, et al. A multigene assay to predict recurrence of tamoxifen-treated, node-negative breast cancer. N Engl J Med. 2004;351:2817–2826. doi: 10.1056/NEJMoa041588. [DOI] [PubMed] [Google Scholar]
- 31.Wittner BS, Sgroi DC, Ryan PD, Bruinsma TJ, Glas AM, Male A, Dahiya S, Habin K, Bernards R, Haber DA, et al. Analysis of the MammaPrint breast cancer assay in a predominantly postmenopausal cohort. Clin Cancer Res. 2008;14:2988–2993. doi: 10.1158/1078-0432.CCR-07-4723. [DOI] [PMC free article] [PubMed] [Google Scholar]
- 32.Chen HY, Yu SL, Chen CH, Chang GC, Chen CY, Yuan A, Cheng CL, Wang CH, Terng HJ, Kao SF, et al. A five-gene signature and clinical outcome in non-small-cell lung cancer. N Engl J Med. 2007;356:11–20. doi: 10.1056/NEJMoa060096. [DOI] [PubMed] [Google Scholar]
- 33.Goh TS, Lee JS, II Kim J, Park YG, Pak K, Jeong DC, Oh SO, Kim YH. Prognostic scoring system for osteosarcoma using network-regularized high-dimensional Cox-regression analysis and potential therapeutic targets. J Cell Physiol. 2019;234:13851–13857. doi: 10.1002/jcp.28065. [DOI] [PubMed] [Google Scholar]
- 34.Pak K, Kim YH, Suh S, Goh TS, Jeong DC, Kim SJ, Kim IJ, Han ME, Oh SO. Development of a risk scoring system for patients with papillary thyroid cancer. J Cell Mol Med. 2019;23:3010–3015. doi: 10.1111/jcmm.14208. [DOI] [PMC free article] [PubMed] [Google Scholar]
- 35.Kim YH, Jeong DC, Pak K, Han ME, Kim JY, Liangwen L, Kim HJ, Kim TW, Kim TH, Hyun DW, Oh SO. SLC2A2 (GLUT2) as a novel prognostic factor for hepatocellular carcinoma. Oncotarget. 2017;8:68381–68392. doi: 10.18632/oncotarget.20266. [DOI] [PMC free article] [PubMed] [Google Scholar]
- 36.Nault JC, De Reynies A, Villanueva A, Calderaro J, Rebouissou S, Couchy G, Decaens T, Franco D, Imbeaud S, Rousseau F, et al. A hepatocellular carcinoma 5-gene score associated with survival of patients after liver resection. Gastroenterology. 2013;145:176–187. doi: 10.1053/j.gastro.2013.03.051. [DOI] [PubMed] [Google Scholar]
- 37.van't Veer LJ, Dai H, van de Vijver MJ, He YD, Hart AA, Mao M, Peterse HL, van der Kooy K, Marton MJ, Witteveen AT, et al. Gene expression profiling predicts clinical outcome of breast cancer. Nature. 2002;415:530–536. doi: 10.1038/415530a. [DOI] [PubMed] [Google Scholar]
Associated Data
This section collects any data citations, data availability statements, or supplementary materials included in this article.
Data Availability Statement
The datasets used and/or analyzed during the current study are available from the corresponding author on reasonable request.


