Abstract
Optical coherence tomography (OCT) angiography (OCTA) has been actively studied as a noninvasive imaging technology to generate retinal blood vessel network maps for the diagnoses of retinal diseases. Given that the uses of OCT and OCTA have increased in the field of ophthalmology, it is necessary to develop retinal phantoms for clinical OCT for product development, performance evaluation, calibration, certification, medical device licensing, and production processes. We developed a retinal layer-mimicking phantom with microfluidic channels based on microfluidic fabrication technology using polydimethylsiloxane (PDMS) and titanium dioxide (TiO2) powder. We implemented superficial and deep retinal vessels using microfluidic channels. In addition, multilayered thin films were synthesized with multiple spin-coating processes that comprised layers that corresponded to the retinal layers, including the ganglion cell layer (GCL), inner plexiform layer (IPL), and inner nuclear layer (INL). The phantom was formed by merging the multilayered thin film, and microfluidic channels were assembled with an optical lens, water chamber, and an aluminum tube case. Finally, we obtained cross-sectional OCT images and en-face OCTA images of the retinal phantom using lab-made ophthalmic OCT. From the cross-sectional OCT image, we could compare each of the layer thicknesses of the phantom with the corresponding layer thicknesses of the human retina. In addition, we obtained en-face OCTA images with injections of intralipid solutions. It is shown that this phantom will be able to be potentially used as a convenient tool to evaluate and standardize the quality and accuracy of OCT and OCTA images.
1. Introduction
The identification of the capillary dropout or pathologic neovascularization has become important because retinal vascular changes constitute various markers of major retinal diseases that led to blindness, such as age-related macular degeneration (AMD) and diabetic retinopathy [1,2]. Various techniques used for retinal angiography, like fluorescein angiography (FA) and indocyanine green angiography (ICGA), have served as standard methods for imaging the retinal vascular structure, and for the diagnosis and monitoring of specific pathologies [3]. These conventional angiographic techniques involve the intravenous injection of exogenous contrast agents in the vascular system. However, these techniques require time and cost to acquire the angiographic images. Although it is extensively known that fluorescein and ICG are safe for patients, they pose risks that range from nausea to allergic reactions, including anaphylaxis in rare instances [4,5]. In addition, as the FA and ICGA in fundus imaging generate only two-dimensional (2D) en-face images, it is difficult to distinguish vascular networks at different depths (superficial retinal, deep retinal, and choriocapillaries).
Optical coherence tomography (OCT) has been extensively studied as a clinical and noninvasive imaging tool for biological tissues because of its ability to provide cross-sectional and three-dimensional volumetric images with high-axial resolution at the micrometer scale. Specifically, following the first demonstration of an OCT image of the human retina [6], OCT has been extensively used as one of the ophthalmic diagnostic devices to measure the retinal thickness, and to monitor the retina vitreous interface and macular edema. Through the monitoring of structural changes in the retina using OCT images, fluid exudation associated with retinal vascular diseases can be detected and monitored. However, structural OCT is unable to directly detect capillary dropout or neovascularization, unlike conventional retinal angiography. Recently, OCT angiography (OCTA) has been actively studied as an expanded functional OCT because it can image retinal vascular networks without exogenous contrast agents based on the detection of OCT signal changes, such as phase-signal- [7–10], intensity-signal- [11–13], and complex-signal-based changes [14–17] generated by the flowing red blood cells in blood vessels.
Standard test methods and optical phantoms have been required because markets of OCT and OCTA are still growing. Specifically, in the field of ophthalmology, it is necessary to prove the image quality and performance for accurate disease diagnosis. In addition, when a system is evaluated, or quality assurance and software modifications are conducted, experiments with human or animal eyes should be performed. However, preclinical and clinical trials cannot be carried out frequently, and it is difficult to obtain reliable and consistent data for system validations. Additionally, it is difficult to obtain subject-independent data. Therefore, a retinal phantom for OCT and OCTA, which ameliorates these problems, is thus needed. Several groups have tried to develop a phantom to evaluate the performance of OCT or OCTA images. Agrawal et al. [18,19] and Wooliams et al. [20] have developed phantoms to measure the point spread function (PSF) of OCT with the use of sparse distributions of nanoparticles or microparticles which were embedded in transparent polymers, such as silicone, UV-curing epoxy, and polyurethane resin. Bruin and Kinkelder et al. [21,22] have described the development of a multilayered thin film phantom. Zawadzki and Rowe have developed the retinal phantom that consisted of five layers which were stacked on a hot, melted rubber adhesive using biaxial polypropylene films with a thickness of ∼60 µm [23,24]. Recently, to evaluate and standardize OCT, Baxi et al. have demonstrated the implementation of a retinal phantom that emulates the retina with the use of spin coating of nanoparticle-embedded silicone films and laser microetching [25]. Lee et al. [26] have developed retinal phantoms that have accurately replicated the tapering shape of the foveal fit. In addition, they also fabricated disease-mimicking phantoms, such as macular degeneration and retinal separation phantoms [26]. In 2015, the International Organization for Standardization (ISO) published a standard document (ISO 16971) about OCT of the posterior segment of the human eye [27]. This document was established by the Subcommittee 7 (SC–7, Ophthalmic Optics and Instruments) of the Technical Committee 172 of the ISO standard (ISO/TC 172, Optics and Photonics). For the evaluation of OCTA, including Doppler OCT, most of the prior studies had used flow phantoms [28–32]. These flow phantoms consisted of glass (or silicone) capillary tubes and agar (or gelatin) mixed with a scattering medium.
In this study, we developed a retinal phantom that can simultaneously evaluate the performance and estimate the accuracy and image quality of OCT and OCTA. The phantom included microfluidic channels as well as retinal structural information. We used a spin coating technique to synthesize multilayered thin films that emulated the retinal layers. In addition, we applied microfluidic techniques to produce miniaturized flow channels that emulated the retinal blood vessels. The phantom was formed based on the merging of the multilayered thin film and microfluidic channels, and was assembled with an optical lens, water chamber, and an aluminum tube case. Finally, we obtained cross-sectional OCT images and en-face OCTA images of the retinal phantom using lab-made ophthalmic OCT.
2. Methods
2.1. Preparation and phantom materials
In this study, a retina phantom should emulate the retinal structure and function. The flow diagram of the process is shown in Fig. 1. We mimicked the vascular layer of the retina, such as the superficial retinal vessels (SRV) and deep retinal vessels (DRV) using microfluidic channels. The multilayered thin film between the channels incorporated three retinal layers, namely, the ganglion cell layer (GCL), inner plexiform layer (IPL), and inner nuclear layer (INL). The phantom consisted of polydimethylsiloxane (PDMS; Sylgard 184 kit, Dow Corning, USA), which is a silicone elastomer, and TiO2 powder (718467, Sigma–Aldrich, USA). The refractive index of cured PDMS (nPDMS) was 1.41 ± 0.01 within the infrared wavelength range (800–1300 nm) [18]. This value is close to the refractive index of retina (nretina = 1.36) [25,33]. We adjusted the concentration of TiO2 particles in PDMS to match the intensity of the retina in the OCT image. The thickness of the phantom layer was determined based on a previously published analysis of the human retina OCT image [25].
Fig. 1.
Flowchart of processing steps required for the construction of a retina phantom.
We synthesized a mixture of PDMS and TiO2, which were the main materials of the phantom, with the use of a probe tip sonicator (Sonifier S–450D, Branson Ultrasonics, USA) and a sonication bath (Ultrasonic Cleaner, Branson Ultrasonics, USA). The concentrations of the TiO2 particles used for the syntheses of the multilayered thin films that corresponded to GCL, IPL, and INL, were 0.05%, 0.5%, and 0.05% by mass, respectively. In addition, the TiO2 concentrations of the PDMS mixtures for two thin films which included microfluidic channels and corresponded to the nerve fiber layer (NFL, superficial vessel layer) and outer plexiform layer (OPL, deep vessel layer) were 0.8% and 0.5% by mass, respectively. The TiO2 particles and base of PDMS were sonicated for 10 h. To prevent thermal deformation of the PDMS mixture, the sonication system was set to 10 s (on period) and 60 s (off period). Curing agent mixtures with the same concentration of TiO2 were also prepared separately using the sonication bath because the mixing of PDMS with the curing agent solidified at high temperatures or over time. Subsequently, the PDMS mixture was mixed with the curing agent mixture at a 10:1 weight ratio. The PDMS mixture was mixed with a curing agent mixture, and was placed in a vacuum chamber to remove air bubbles.
2.2. Spin coating of multilayered thin film
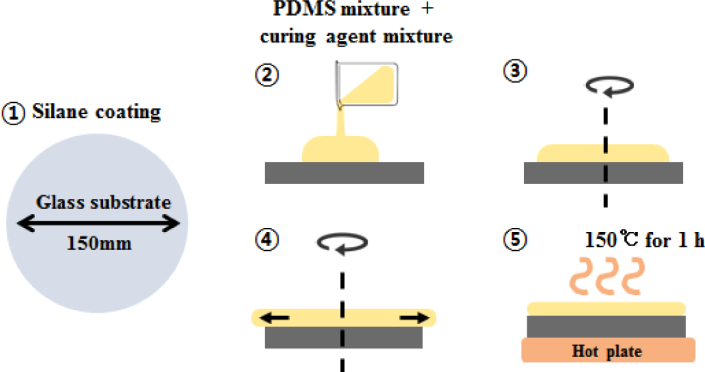
A multilayered thin film was made by spin coating the PDMS mixture on a glass substrate. This glass substrate was made of a Pyrex glass which could withstand increased temperatures, and which had a thickness of 3.3 mm and a diameter of 150 mm. Before spin coating, the substrate was coated with Silane (Chlorotrimethylsiane 92361, Sigma–Aldrich, USA) to provide hydrophobic coating to facilitate removal of the hardened multilayered thin film (step 1 in Fig. 2). The mixtures were dropped on the center of the substrate which was fixed to a spin coater (ACE–200, Dong Ah Corporation, Korea). The thickness of the layer depended upon the rotational speed (revolutions per minute) and the spin time of the spin coater [34]. After spinning for 5 min, the PDMS mixture was cured on a hot plate at 150°C for 1 h. These processes are shown in Fig. 2. The thickness of the cured PDMS thin film was measured around the center without an edge bead with the use of a lab-made OCT. After surface measurements, the uncured PDMS mixture was deposited above the cured thin film as the next layer. The processes of spin coating, measurement and curing were repeated twice.
Fig. 2.
Illustration of processing steps for spin coating used to synthesize the multilayered thin films. Step 1: A Pyrex glass is used as a substrate and is coated with Silane to allow easy removal of the cured PDMS. Step 2: The mixture which contains PDMS, TiO2, and curing agent is dropped on the substrate. Steps 3 and 4: The mixture is spun for 5 min depended upon the rotational speed of each layer. Step 5: After the end of spin coating, the PDMS mixture is placed on a hot plate at 150°C for 1 h to cure it.
2.3. Microfluidic channels
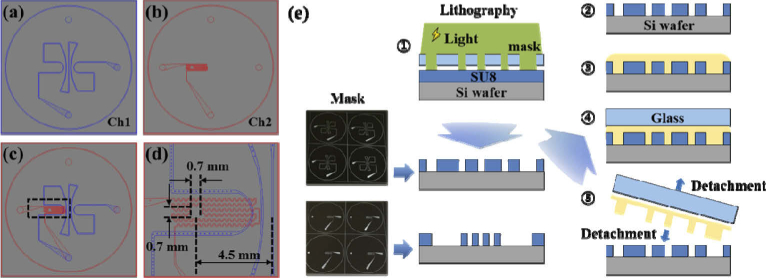
We designed two microfluidic channels, as shown in Fig. 3(a) and (b), separately and as simple as possible. The first microfluidic channel (Ch1) mimicked superficial retinal vessels. Figure 3(a) shows that the five large pathways around the center were designed to spread from the center to the edge like the blood vessels in the optic disc area. The widths of the first microfluidic channels ranged from 100 µm to 200 µm. The second channel (Ch2) mimicked deep retinal vessels in the outer plexiform layer (OPL). As shown in Fig. 3(b), we designed Ch2 to have a serpentine shape and a width of 50 µm at the horizontal axis for simplification, although deep retinal vessels are distributed within most of the area. Figure 3(d) shows an enlarged drawing of the region highlighted by the black square in Fig. 3(c). In the Ch2 (red) of Fig. 3(d), the empty area of 0.7 mm × 0.7 mm mimicked the avascular zone of the fovea, which was positioned at a distance of 4.5 mm away from the center. Both channels were serially connected by a through hole. We outsourced masks for channel patterns with our designs. In addition, masks were designed to be able to make four phantoms at a time.
Fig. 3.
Design of the microfluidic channels and illustration of processing steps of the microfluidic channels. (a) Ch1 mimicked superficial vessels which were designed to spread from the center to the edge like the optic disc area. The widths of the channels ranged from 100 to 200 µm. (b) Ch2 mimicked deep vessels. The widths of the channels were designed to be 50 µm. (c) Overlapped drawings of Ch1 and Ch2. (d) Enlarged drawing of the area highlighted by the black square of Fig. 3(c). An empty space with an area of 0.7 mm × 0.7 mm mimicked the avascular zone of the fovea that was located 4.5 mm away from the center. (e) Processing step of the microfluidic channels with a microfluidic technique: Steps 1 and 2: Two molds for microfluidic channels are patterned in two Si wafers using photo-lithographic processes. Step 3: The mixture which consists of PDMS, TiO2 and curing agent is poured onto each mold. Step 4: A silane coated glass is placed on the mixture to provide pressure. Step 5: After curing, the microfluidic channel layer is detached from the mold and glass.
The microfluidic channels were patterned in two silicon (Si) wafers with a diameters of 101.6 mm (4 in) using a photolithographic process. Photoresist (SU-8 2050, Microchem, USA) materials were spun-coated on the Si wafer. All procedures and conditions for pre/postbaking and ultraviolet (UV) exposure of the photoresist layer were followed based on the manufacturer’s recommendations depending on the target thickness of the photoresist layer. After postexposure baking, the wafer was dipped in the SU-8 Developer (Microchem, USA) and rinsed with isopropyl alcohol (IPA). Only UV-exposed patterns remained on the wafer. These were used as a mold for microchannel fabrication. Each patterned Si wafer can be reused until it is damaged. The PDMS mixed with TiO2 was poured on each patterned wafer, and was then pressed with the use of a glass, as shown in Fig. 3(e). The glass was coated by silane in a vacuum desiccator to facilitate demolding. After an adequate time period elapsed for curing, the temperature of the hot plate was set to 60°C, and the microfluidic channel layer was detached from the wafer and glass. The microchannel thickness was adjusted by changing the load on the glass. Ch 2 were fabricated to have thicknesses around 2 mm for interconnection of fluidic tubing.
2.4. Fabrication and phantom assembly
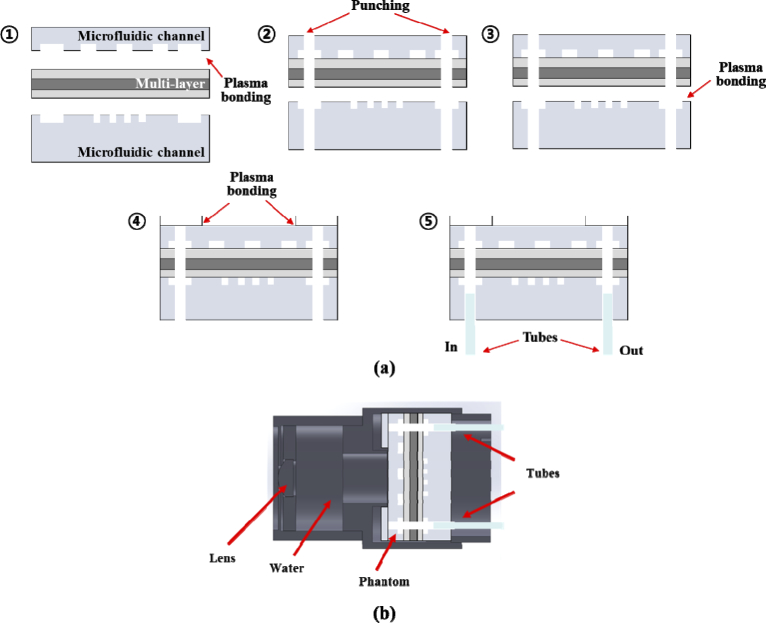
The multilayered thin film was positioned between two microfluidic channel layers, as shown in Fig. 4(a), and the oxygen plasma between the upper channel (Ch1) and the multilayered thin film was carried out for 1 min to attach it on a plasma system (COVANSE, Femto Science Inc., Korea) [35]. Before attaching the multilayered film, including the Ch1 to the lower channel (Ch2), punching was carried out to construct the inlet and outlet, and to connect Ch1 and Ch2, as shown in Step 2 of Fig. 2(a). The multilayered film (including the Ch1) and the Ch2, were then attached with oxygen plasma. The multilayered PDMS structure was cut with a specialized cutter to have diameters which were equal to 30 mm. The ring pattern PDMS layer (white top layer in Steps 4 and 5 of Fig. 4(a)) was prepared and attached on the Ch1 layer to prevent leakage. The ring pattern PDMS layer, which is the transparent layer without TiO2 particles, had a donut shape with an inner diameter of 14 mm, an outer diameter of 30 mm, and a thickness of 2 mm, approximately. Finally, fluorinated ethylene propylene (FEP) tubes (1521L, IDEX Health & Science LLC., USA) were connected in the inlet and outlet. The FEP tube had an inner diameter of 1/16 in and an outer diameter of 1/8 in.
Fig. 4.
Illustration of fabrication processing steps of the retinal phantom (a) and schematic of the retinal phantom assembly for the eye model (b). (a) Fabrication processing: Step 1: The upper channel (Ch1) and the multilayered thin film are attached with oxygen plasma administered for a period of 1 min. Step2. The multilayered film (including the Ch1) and lower channel (Ch2) are punched to construct the inlet and outlet and to connect Ch1 and Ch2. Step 3: The multilayered film and Ch2 are attached with oxygen plasma administered for a period of 1 min. Step 4: The multilayered PDMS structure was cut to 30 mm and the ring pattern PDMS layer was attached on the structure. Step 5: Fluorinated ethylene propylene (FEP) tubes are connected in the inlet and outlet.
After all the fabrication processing was carried out, we packaged the retinal phantom with a lens in the cylindrical housing to use it in ophthalmic OCT. Figure 4(b) shows a schematic of the retinal phantom assembly that was used as an eye model. We used a lens with a back focal length of 17 mm (58 D) in the air–lens–water interfaces according to the ISO recommendation [27]. Water was filled between the lens and the retinal phantom to match the refractive index of vitreous humor (nviterous humor ≈ 1.33). A syringe was connected with the FEP tube of the inlet at the phantom and was placed on a syringe pump to provide a constant flow rate. We injected diluted intralipid solution (I141–100ML, Sigma–Aldrich, USA) with concentrations ranging from 1% to 5%.
2.5. OCT system
We obtained cross-sectional and volumetric OCT and OCTA images of the assembled phantom with a lab-made OCT system [36]. Briefly, a superluminescent diode (SLD) with a center wavelength of 849 nm (BLM2–D–840–B–I–10, Superlum, Ireland) and a −3 dB bandwidth of 100 nm—which corresponds to a theoretical axial resolution of 3.2 µm in air—was used as the light source in OCT. The light from the SLD was coupled to a 2 × 2 optical fiber coupler and was split into the reference and sample arms at a 90:10 ratio (Gould Fiber Optics, USA). In the sample arm, the collimated light with an optical power of approximately 780 µW was incident upon the phantom via 2D galvanometers, a scan lens, and a tube lens. The light beams reflected from the reference and sample arms were recombined and directed into a spectrometer with an A-line rate of 125 kHz. The axial resolution was 3.8 µm within a depth range of 2.4 mm in air. The standard ISO 16971 requires that the depth range and the axial resolution of the retinal OCT system should be calibrated with a piece of glass with a thickness of the order of 1 mm. Additionally, the thickness and refractive index of this glass should be known and should have tolerances that are significantly less than 3% [27]. Therefore, our OCT system was calibrated with the use of a piece of BK7 glass with a refractive index of 1.5098 at 850 nm and a thickness of 995.71 ± 0.50 µm before the thicknesses of the layers of the phantom were measured. The test of the glass thickness was performed—in comparison with the reference gauge block—with the use of the gauge block comparator.
OCTA images were acquired using the split spectrum, amplitude-decorrelation angiography (SSADA) algorithm [13]. We set the split spectrum and averaging numbers to four and five, respectively. The threshold used to reduce the noise was set empirically, and a median filter was applied with a 3 × 3 matrix window.
3. Results
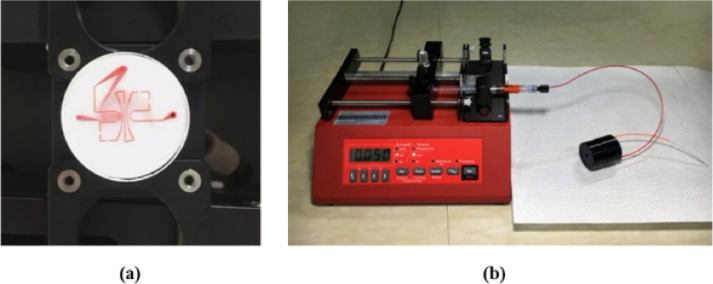
Before packaging the retinal phantom into the cylindrical case, red ink was injected for 15 min to check the emission from the outlet, the shape of the channels, and fluid leaks, as shown in Fig. 5(a). The red ink, which was injected at a constant flow rate set by the syringe pump, entered the FEP tube of the inlet and was discharged along the FEP tube of the outlet. Figure 5(a) and Visualization 1 (3MB, mov) shows that the red ink injected into the phantom passed through the upper channel and then through the lower channel. Through the injection of the red ink, we could check whether the plasma bonding between each layer (Steps 1, 3, and 4, of Fig. 4) created an inseparable incorporation, and whether the fluid only flowed through the channels without any leaks. In addition, the fluidic interconnection between the tube and the inlet or outlet (Step 5 of Fig. 4) was also secured, even when the tube was replaced, because the PDMS was resilient. We washed the channels of the phantom with deionized water and ethanol for reuse. Figure 5(b) shows the retinal phantom that was packaged in a cylindrical housing and operated with the syringe pump.
Fig. 5.
Test conducted to check the emission from the outlet, the shape of the channels, and for fluid leaks. (a) Display flow of the red ink at the retinal phantom (Visualization 1 (3MB, mov) ). (b) Photograph of the phantom and syringe pump. To match the refractive index of the vitreous humor, water was injected and filled the spaces between the lens and the retinal phantom within the cylindrical housing. The syringe pump was used to provide a constant flow rate.
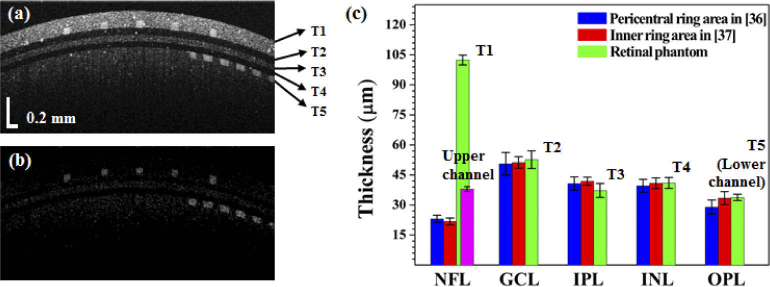
Figure 6 shows the cross-sectional OCT and OCTA images of the assembled phantom after the injection of 5% intralipid solution. Two layers (T1 and T5), including the microfluidic channels, represent the NFL and OPL. The regions of the three-layered thin film which extend from T2 to T4 in Fig. 6(a) respectively correspond to the locations of the GCL, IPL, and INL. Each layer is clearly distinguished. As observed, each layer has a constant thickness and does not contain irregular parts. The first layer (T1) is the brightest of the five layers, and corresponds to the intensity of the NFL. Figure 6(b) shows a cross-sectional OCTA image which is computed with the SSADA algorithm. The two channel layers are readily identifiable and have rectangular cross-sectional shapes. We compared the thicknesses of each of the phantom layers with the corresponding thicknesses of each retinal layer in the human eye based on published data from previous studies [37,38]. The blue and red values in Fig. 6(c) were obtained and modified from [37] and [38]. To measure the thickness of each layer, we calculated the refractive indices of PDMS mixtures from prior publications [39–41]. The refractive indices of PDMS mixtures were calculated to be 1.410 (0.05%), 1.411 (0.5%), and 1.412 (0.8%). Refractive indices of PDMS mixtures with low TiO2 concentration (< 1%) scarcely affect thickness measurements of thin films because all thin layers in the phantom have thickness values below 100 µm. Therefore, we confirmed that the refractive index of cured PDMS mixed with TiO2 was 1.41, and then measured the thickness of each layer with OCT. The green values show that the measured thicknesses of each layer of the phantom were: T1 = 102.42 ± 2.40 µm, T2 = 52.67 ± 4.40 µm, T3 = 37.28 ± 3.48 µm, T4 = 41.04 ± 2.69 µm, and T5 = 33.82 ± 1.57 µm. The thicknesses of the phantom layers with the exclusion of T1 and T5 were within the standard deviations of the human measurements. The first layer, T1, which included the upper microfluidic channel, was approximately five times thicker than the NFL layer of the human. The thickness of the upper microfluidic channel (purple bar) was measured to be 38.03 ± 1.20 µm. The thickness of T5 was measured as the thickness of the lower microfluidic channel. In these studies, seven phantoms were used and the thickness of each layer was measured at three points per retina phantom.
Fig. 6.
Cross-sectional OCT and OCTA images of phantom with a 5% intralipid concentration and thickness comparisons. (a) Cross-sectional OCT image, (b) Cross-sectional OCTA image. (c) Plot of the thickness values for the various layers and comparison of outcomes between the phantom and human [37,38]: T1 = 102.42 ± 2.40 µm, T2 = 52.67 ± 4.40 µm, T3 = 37.28 ± 3.48 µm, T4 = 41.04 ± 2.69 µm, and T5 = 33.82 ± 1.57 µm. The purple bar is the thickness of the upper microfluidic channel, which was measured to be equal to 38.03 ± 1.20 µm.
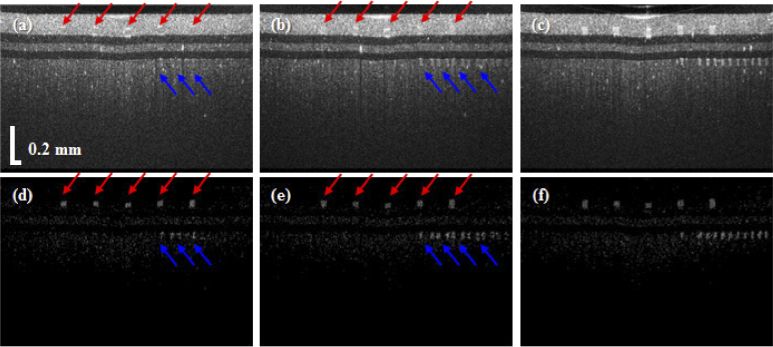
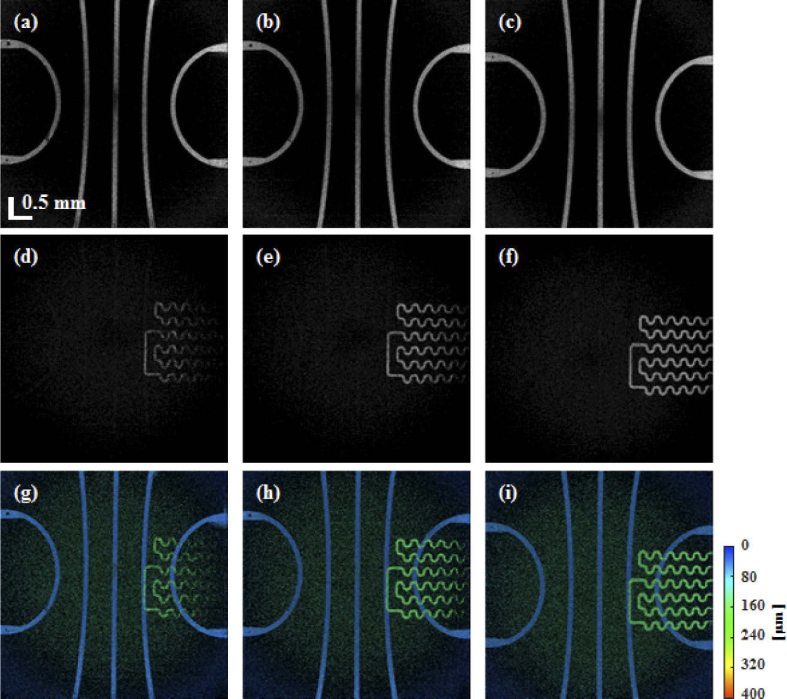
Figure 7 shows cross-sectional OCT and OCTA images of the retinal phantom when 1%, 2%, and 5% intralipid solutions were injected into the microfluidic channels. As shown in Fig. 7(a), although the upper and lower microfluidic channels were filled with 1% intralipid solution, the two microfluidic channels are not distinguished from the PDMS, which was mixed with TiO2 around the channels. However, in the OCTA image of Fig. 7(d), the upper and lower microfluidic channels are observed clearly. As the concentration of intralipid solution was increased to 2%, the lower microfluidic channel appears in Fig. 7(b), but the upper microfluidic channels are not distinguished yet. Figure 8 shows en-face OCTA images at each intralipid concentration tested herein. For en-face image projection, the cross-sectional OCTA images were flattened using high-contrast differences between the water and the top of the phantom, as shown in the cross-sectional OCT image of Fig. 7. Figures 8(a), (b), and (c), respectively show the en-face OCTA images of the upper microfluidic channels following injections of intralipid solutions with concentrations of 1%, 2%, and 5%. In addition, Figs. 8(d), (e), and (f), display the lower microfluidic channels. Although our retina phantom has a flat surface, a curved surface was displayed owing to pivot scanning that has relatively longer path length toward the side, as shown in Fig. 6(a). In addition, SD-OCT has the disadvantage of fast sensitivity roll-off in axial direction compared to swept-source OCT. Therefore, the connectivity of the lower microfluidic channel at the edge of the en-face image is low owing to weak OCTA signals attributed to low scattering and fast sensitivity roll-off, as shown in Fig. 8(d). The black dots on the upper channel are the pillars that prevent the channel from collapsing. The lower channel may have shadowing artifacts which correspond to the darker part caused by the upper channel. Figures 8(g), (h), and (i), are en-face maximum amplitude projection (MAP) images using a depth colormap (as shown). The MAP images were calculated with image depths in the range from 0 (surface) to 400 µm in the retina phantom.
Fig. 7.
Comparison of cross-sectional OCT and OCTA images when the concentrations of the intralipid solution were 1% (a, d), 2% (b, e), and 5% (c, f), respectively. Red and blue arrows are upper channels and lower channels, respectively.
Fig. 8.
En-face images of the retinal phantom with intralipid concentrations of 1%, 2%, and 5%, corresponding to the upper microfluidic (a, b, and c), lower microfluidic (d, e, and f), and all the microfluidic channels (g, h, and i), respectively. The colormap indicates the depth range from 0 (surface) to 400 µm in the retina phantom.
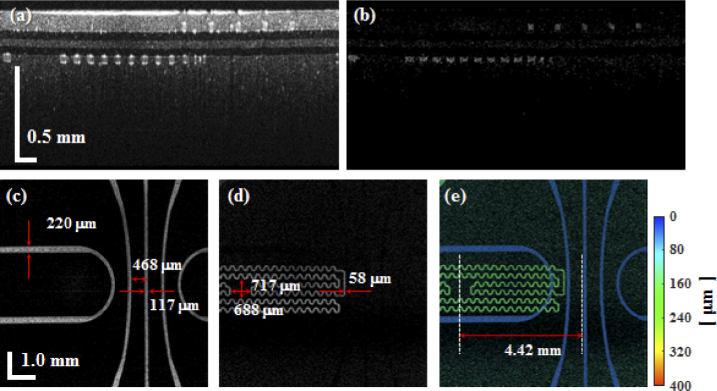
Despite the fact that an empty area that mimicked the avascular zone of the fovea in the lower channel was designed in this study, the empty area could not be displayed because our lab-made retinal OCT system had a small field-of-view, as shown in Fig. 8. Therefore, we obtained OCT and OCTA images with an OCT scan lens (LSM04-BB, Thorlabs, USA). At that time, the tube lens and the scan lens in the retinal OCT were detached. In addition, the lens within the cylindrical housing of the phantom was removed. Figure 9 shows OCT and OCTA images of the phantom. As shown in Figs. 9(d) and (e), not only the upper and lower microfluidic channels, but also the empty area (fovea avascular zone) could be displayed clearly within the large field-of-view. Furthermore, we could measure fabricated microfluidic channel dimensions through Figs. 9(c) to (e).
Fig. 9.
Cross-sectional images and en-face images of the phantom with an intralipid concentration of 5% with the use of an OCT scan lens. (a) Cross-sectional OCT image, (b) cross-sectional OCTA image, (c) en-face OCTA image of the upper microfluidic channels, (d) en-face OCTA image of the lower microfluidic channels, and (e) en-face maximum amplitude projection image of the entire set of channels with depth information. The colormap indicates a depth range from 0 (surface) to 400 µm in the retina phantom.
4. Discussion
We developed and verified the retina phantom for OCT and OCTA system that mimicked the layers and vessels of the retina of the human. In previous studies, several groups had introduced the retina phantom with designed multilayers in an effort to emulate those of the retina [21–25]. Specifically, one of these previous retina phantoms became commercialized successfully. However, these retina phantoms emulated only the multilayers of the retina. Their major disadvantage was attributed to the fact that they could not be used in OCTA because they did not have functionalities that could mimick the function of the blood vessels, such as the Doppler effects and intensity (or phase) changes owing to the movement of red blood cells. The methods used to construct the flow phantom have usually employed circular polyethylene conduits [28] or glass capillary tubes [29–32]. These phantoms are easy to make, but they are not suited to mimic retinal blood vessels because of the limitations associated with the reduction of the inner and outer diameters of the tube. In addition, circular polyethylene conduits and glass capillary tubes cannot mimic patterns of blood vessel networks, and cannot be located at different depths within the 500 µm range. Our phantom that applied the microfluidic technique could implement small-sized channels below 200 µm, and could mimic the pattern of blood vessel networks with masks of the desired designs in conjunction with lithography. In addition, the two channels at different depths, including the microfluidic channel, could be implemented by stacking the films. We compared the thickness of the SU-8 layer, the PDMS channel heights before fabrication, and the channels thickness of the phantom during the injection of the intralipid solution. The thicknesses of the SU-8 layer for Ch1 and Ch2 were measured with white light scanning interferometry (WSI, NV-2400, NanoSystem Co., Korea) and were found equal to 32.9 ± 0.4 µm and 33.0 ± 0.1 µm, respectively. The corresponding cured PDMS channel thicknesses were 32.5 ± 0.1 µm and 32.9 ± 0.1 µm, respectively. Thicknesses of the cured PDMS channels were also measured by the WSI. The thickness of the cured PDMS channel before fabrication was slightly reduced compared to the SU-8 mold. Given that PDMS is cured at high temperatures, it is well known that thermal shrinkage occurs in the PDMS microchannel. The channel thicknesses of the phantom filled with intralipid solution in Ch1 and Ch2 were 38.03 ± 1.20 µm and 33.82 ± 1.57 µm, as described in the Results section. It can be observed that the PDMS channels were slightly thickened by the liquid pressure applied to the channels.
The retina has more layers under the OPL, such as the outer nuclear layer (ONL), external limiting membrane (ELM), photoreceptor layers (PR), and retinal pigment epithelium (RPE). Additionally the retinal surface has a smooth curvature around the foveal pit because the layers tend to be merged together. Currently, our phantom did not mimic the irregular layers, and the layers below the INL which are typically observed in the retina. A limitation associated with the emulation of first microfluidic channel is the thickness discrepancy. The thickness of the thin film, including the upper microfluidic channel, was measured to be 102 ± 2.40 µm, and is much thicker than the NFL of the human retina [37,38]. When the thickness from the surface of the thin film to the top of the upper channel was thin, the channel was burst owing to high-liquid pressure. We constructed channels with various thickness values to identify the optimal value. When the thickness of the upper microfluidic channel was almost 30 µm, the phantoms with thicknesses > 60 µm from the surface of the thin film to the top of the upper channel were not destroyed and were available for a long time. Although the thickness of the first layer of our phantom was thicker than that of the NFL of the human retina, our phantom could provide competitive advantages over structural information and could be used as a test tool to assess the software accuracy and image qualities of OCT and OCTA, simultaneously.
In this study, we obtained only OCT and OCTA images of the retina phantom. However, this phantom can also become a useful tool for FA and ICGA in conjunction with the use of the fundus camera or the scanning laser ophthalmoscope (SLO). It is well known that FA and ICGA are mainly used in the field of ophthalmology for the evaluation of various retinal diseases using fluorescein or ICG dyes. In the cross-sectional OCT image, our retina phantom has an intensity that is similar to the OCT image of the human retina. In addition, because the thickness of each layer was close to the thickness of each retinal layer, we could observe patterns that mimicked blood vessel networks following the injection of red ink, as shown in Fig. 5(a). Therefore, if the liquid injected into the retinal phantom had similar optical properties as those of the blood following its mixture with fluorescein or ICG, the reliability of the software and hardware in the fundus camera or SLO for FA or ICGA will be able to be estimated.
In future studies, we will develop a new method for a retinal phantom for the quantification of the shape of the foveal pit and structural layers, including the mimicked retinal layers under OPL. In addition, the design will be modified so that the position of the microfluidic channel is moved to one side to display the avascular zone of the fovea in the OCTA image. Construction of these fabrications of the microfluidic channels emulating the actual retinal structure will allow us to be able to provide a standardized phantom that can be accurately evaluated. We will apply a retinal phantom to compare and quantify the influence of the processing algorithm for angiography based on various imaging biomarkers, such as contrast, signal-to-noise ratio, connectivity, and visibility [42–44]. Furthermore, this phantom will not only help test the initial device performance and allow the periodic conduct of quality assurance tests, but will also be useful in certification, medical device licensing, and production processes of ophthalmic imaging devices, such as OCT, OCTA, fundus camera, and the SLO.
5. Conclusion
In this study, we proposed an advanced retina phantom with a multilayered thin film and two microfluidic channels to emulate the human retina based on microfluidic fabrication technology. Multilayered thin films that corresponded to the retinal GCL, IPL, and INL, were synthesized using multiple spin-coating based on the adjustment of the concentration of TiO2 in PDMS. We implemented superficial and deep retinal vessels using microfluidic channels. The phantom formed by merging the multilayered thin film and microfluidic channels was assembled with an optical lens, water chamber, and an aluminum tube case. We obtained cross-sectional OCT images of the retinal phantom using lab-made ophthalmic OCT. Based on the cross-sectional OCT image, we compared each of the layer thicknesses of the phantom with the corresponding thicknesses of the layers of the human retina. Finally, we obtained en-face OCTA images with injections of intralipid solutions. This phantom can be potentially used as a convenient tool to evaluate and standardize the quality and accuracy of OCT and OCTA images. Usage of our retinal phantom will save the time on product development processes and in the medical device certification of ophthalmic imaging devices, including OCT and OCTA. In future studies, several improvements, such as mimicking other layers and reproducing the smooth curvature of the fovea pit, will be considered to ensure a more accurate emulation of the retina.
Funding
National Research Foundation of Korea10.13039/501100003725 (2014M3A7B6020163, 2018M3D1A1058814); Korea Research Institute of Standards and Science10.13039/501100003706 (KRISS-2019-GP2019-0013).
Disclosures
The authors declare that there are no conflicts of interest related to this article.
References
- 1.Jia Y., Bailey S. T., Hwang T. S., McClintic S. M., Gao S. S., Pennesi M. E., Flaxel C. J., Lauer A. K., Wilson D. J., Hornegger J., Fujimoto J. G., Huang D., “Quantitative optical coherence tomography angiography of vascular abnormalities in the living human eye,” Proc. Natl. Acad. Sci. U. S. A. 112(18), E2395–E2402 (2015). 10.1073/pnas.1500185112 [DOI] [PMC free article] [PubMed] [Google Scholar]
- 2.Hayreh S. S., “Ocular vascular occlusive disorders: natural history of visual outcome,” Prog. Retinal Eye Res. 41, 1–25 (2014). 10.1016/j.preteyeres.2014.04.001 [DOI] [PMC free article] [PubMed] [Google Scholar]
- 3.Pichi F., Sarraf D., Arepalli S., Lowder C. Y., Cunningham E. T., Jr., Neri P., Albini T. A., Gupta V., Baynes K., Srivastava S. K., “The application of optical coherence tomography angiography in uveitis and inflammatory eye diseases,” Prog. Retinal Eye Res. 59, 178–201 (2017). 10.1016/j.preteyeres.2017.04.005 [DOI] [PubMed] [Google Scholar]
- 4.Lopez-Saez M. P., Ordoqui E., Tornero P., Baeza A., Sainza T., Zubeldia J. M., Baeza M. L., “Fluorescein-induced allergic reaction,” Ann. Allergy, Asthma, Immunol. 81(5), 428–430 (1998). 10.1016/S1081-1206(10)63140-7 [DOI] [PubMed] [Google Scholar]
- 5.Hope-Ross M., Yannuzzi A., Gragoudas E. S., Slakter J. S., Sorrenson J. A., Krupsky S., Orlock D. A., Puliafito C. A., “Adverse reactions due to Indocyanine Green,” Ophthalmology 101(3), 529–533 (1994). 10.1016/S0161-6420(94)31303-0 [DOI] [PubMed] [Google Scholar]
- 6.Huang D., Swanson E. A., Lin C. P., Schuman J. S., Stinson W. G., Chang W., Hee M. R., Flotte T., Gregory K., Puliafito C. A., Fujimoto J. G., “Optical coherence tomography,” Science 254(5035), 1178–1181 (1991). 10.1126/science.1957169 [DOI] [PMC free article] [PubMed] [Google Scholar]
- 7.Yazdanfar S., Kulkarni M., Izatt J., “High resolution imaging of in vivo cardiac dynamics using color Doppler optical coherence tomography,” Opt. Express 1(13), 424–431 (1997). 10.1364/OE.1.000424 [DOI] [PubMed] [Google Scholar]
- 8.Chen Z., Milner T. E., Srinivas S., Wang X., Malekafzali A., van Gemert M. J., Nelson J. S., “Noninvasive imaging of in vivo blood flow velocity using optical Doppler tomography,” Opt. Lett. 22(14), 1119–1121 (1997). 10.1364/OL.22.001119 [DOI] [PubMed] [Google Scholar]
- 9.Fingler J., Schwartz D., Yang C., Fraser S. E., “Mobility and transverse flow visualization using phase variance contrast with spectral domain optical coherence tomography,” Opt. Express 15(20), 12636–12653 (2007). 10.1364/OE.15.012636 [DOI] [PubMed] [Google Scholar]
- 10.Kim D. Y., Fingler J., Werner J. S., Schwartz D. M., Fraser S. E., Zawadzki R. J., “In vivo volumetric imaging of human retinal circulation with phase-variance optical coherence tomography,” Biomed. Opt. Express 2(6), 1504–1513 (2011). 10.1364/BOE.2.001504 [DOI] [PMC free article] [PubMed] [Google Scholar]
- 11.Barton J., Stromski S., “Flow measurement without phase information in optical coherence tomography images,” Opt. Express 13(14), 5234–5239 (2005). 10.1364/OPEX.13.005234 [DOI] [PubMed] [Google Scholar]
- 12.Jonathan E., Enfield J., Leahy M. J., “Correlation mapping method for generating microcirculation morphology from optical coherence tomography (OCT) intensity images,” J. Biophotonics 4(5), 293–296 (2011). 10.1002/jbio.201000050 [DOI] [PubMed] [Google Scholar]
- 13.Jia Y., Tan O., Tokayer J., Potsaid B., Wang Y., Liu J. J., Kraus M. F., Subhash H., Fujimoto J. G., Hornegger J., Huang D., “Split-spectrum amplitude-decorrelation angiography with optical coherence tomography,” Opt. Express 20(4), 4710–4725 (2012). 10.1364/OE.20.004710 [DOI] [PMC free article] [PubMed] [Google Scholar]
- 14.Wang R. K., An L., Saunders S., Wilson D. J., “Optical microangiography provides depth-resolved images of directional ocular blood perfusion in posterior eye segment,” J. Biomed. Opt. 15(2), 020502 (2010). 10.1117/1.3353958 [DOI] [PMC free article] [PubMed] [Google Scholar]
- 15.Yousefi S., Zhi Z., Wang R. K., “Eigendecomposition-based clutter filtering technique for optical micro-angiography,” IEEE Trans. Biomed. Eng. 58(8), 2316–2323 (2011). 10.1109/TBME.2011.2152839 [DOI] [PMC free article] [PubMed] [Google Scholar]
- 16.Chen C., Shi W., Gao W., “Imaginary part-based correlation mapping optical coherence tomography for imaging of blood vessels in vivo,” J. Biomed. Opt. 20(11), 116009 (2015). 10.1117/1.JBO.20.11.116009 [DOI] [PubMed] [Google Scholar]
- 17.Liu G., Jia Y., Pechauer A. D., Chandwani R., Huang D., “Split-spectrum phase-gradient optical coherence tomography angiography,” Biomed. Opt. Express 7(8), 2943–2954 (2016). 10.1364/BOE.7.002943 [DOI] [PMC free article] [PubMed] [Google Scholar]
- 18.Agrawal A., Pfefer T. J., Gilani N., Drezek R., “Three-dimensional characterization of optical coherence tomography point spread functions with a nanoparticle-embedded phantom,” Opt. Lett. 35(13), 2269–2271 (2010). 10.1364/OL.35.002269 [DOI] [PubMed] [Google Scholar]
- 19.Agrawal A., Connors M., Beylin A., Liang C. P., Barton D., Chen Y., Drezek R. A., Pfefer T. J., “Characterizing the point spread function of retinal OCT devices with a model eye-based phantom,” Biomed. Opt. Express 3(5), 1116–1126 (2012). 10.1364/BOE.3.001116 [DOI] [PMC free article] [PubMed] [Google Scholar]
- 20.Woolliams P. D., Ferguson R. A., Hart C., Grimwood A., Tomlins P. H., “Spatially deconvolved optical coherence tomography,” Appl. Opt. 49(11), 2014–2021 (2010). 10.1364/AO.49.002014 [DOI] [PubMed] [Google Scholar]
- 21.de Bruin D. M., Bremmer R. H., Kodach V. M., de Kinkelder R., van Marle J., van Leeuwen T. G., Faber D. J., “Optical phantoms of varying geometry based on thin building blocks with controlled optical properties,” J. Biomed. Opt. 15(2), 025001 (2010). 10.1117/1.3369003 [DOI] [PubMed] [Google Scholar]
- 22.de Kinkelder R., de Bruin D. M., Verbraak F. D., van Leeuwen T. G., Faber D. J., “Comparison of retinal nerve fiber layer thickness measurements by spectral-domain optical coherence tomography systems using a phantom eye model,” J. Biophotonics 6(4), 314–320 (2013). 10.1002/jbio.201200018 [DOI] [PubMed] [Google Scholar]
- 23.Zawadzki R. J., Rowe T. S., Fuller A. R., Hamann B., Werner J. S., “Toward building an anatomically correct solid eye model with volumetric representation of retinal morphology,” Proc. SPIE 7550, 75502F (2010). 10.1117/12.842888 [DOI] [Google Scholar]
- 24.Rowe T. S., Zawadzki R. J., “New developments in eye models with retina tissue phantoms for ophthalmic optical coherence tomography,” Proc. SPIE 8229, 822913 (2012). 10.1117/12.905499 [DOI] [Google Scholar]
- 25.Baxi J., Calhoun W., Sepah Y. J., Hammer D. X., Ilev I., Pfefer T. J., Nguyen Q. D., Agrawal A., “Retina-simulating phantom for optical coherence tomography,” J. Biomed. Opt. 19(2), 021106 (2013). 10.1117/1.JBO.19.2.021106 [DOI] [PubMed] [Google Scholar]
- 26.Lee G. C. F., Smith G. T., Agrawal M., Leng T., Ellerbee A. K., “Fabrication of healthy and disease-mimicking retinal phantoms with tapered foveal pits for optical coherence tomography,” J. Biomed. Opt. 20(8), 085004 (2015). 10.1117/1.JBO.20.8.085004 [DOI] [PubMed] [Google Scholar]
- 27.ISO 16971 , “Ophthalmic instruments - Optical coherence tomography for the posterior segment of the human eye,” (2015).
- 28.Chen Z., Milner T. E., Dave D., Nelson J. S., “Optical Doppler tomographic imaging of fluid flow velocity in highly scattering media,” Opt. Lett. 22(1), 64–66 (1997). 10.1364/OL.22.000064 [DOI] [PubMed] [Google Scholar]
- 29.Yazdanfar S., Izatt J. A., “Self-referenced Doppler optical coherence tomography,” Opt. Lett. 27(23), 2085–2087 (2002). 10.1364/OL.27.002085 [DOI] [PubMed] [Google Scholar]
- 30.Jeong H., Cho N. H., Jung U., Lee C., Kim J. Y., Kim J., “Ultra-fast displaying Spectral Domain Optical Doppler Tomography system using a Graphics Processing Unit,” Sensors 12(6), 6920–6929 (2012). 10.3390/s120606920 [DOI] [PMC free article] [PubMed] [Google Scholar]
- 31.Tokayer J., Jia Y., Dhalla A. H., Huang D., “Blood flow velocity quantification using split-spectrum amplitude-decorrelation angiography with optical coherence tomography,” Biomed. Opt. Express 4(10), 1909–1924 (2013). 10.1364/BOE.4.001909 [DOI] [PMC free article] [PubMed] [Google Scholar]
- 32.Cheng Y., Guo L., Pan C., Lu T., Hong T., Ding Z., Li P., “Statistical analysis of motion contrast in optical coherence tomography angiography,” J. Biomed. Opt. 20(11), 116004 (2015). 10.1117/1.JBO.20.11.116004 [DOI] [PubMed] [Google Scholar]
- 33.Williams D. R., “Visual consequences of the foveal pit,” Invest. Ophthalmol. Visual Sci. 19(6), 653–667 (1980). [PubMed] [Google Scholar]
- 34.Koschwanez J. H., Carlson R. H., Meldrum D. R., “Thin PDMS films using long spin times or Tert-Butyl alcohol as a solvent,” PLoS One 4(2), e4572 (2009). 10.1371/journal.pone.0004572 [DOI] [PMC free article] [PubMed] [Google Scholar]
- 35.Duffy D. C., McDonald J. C., Schueller O. J., Whitesides G. M., “Rapid prototyping of microfluidic systems in poly(dimethylsiloxane),” Anal. Chem. 70(23), 4974–4984 (1998). 10.1021/ac980656z [DOI] [PubMed] [Google Scholar]
- 36.Lee S.-W., Kang H., Park J., Lee T., Lee E., Lee J., “Ultrahigh-resolution spectral domain optical coherence tomography based on a linear-wavenumber spectrometer,” J. Opt. Soc. Korea 19(1), 55–62 (2015). 10.3807/JOSK.2015.19.1.055 [DOI] [Google Scholar]
- 37.Demirkaya N., van Dijk H. W., van Schuppen S. M., Abramoff M. D., Garvin M. K., Sonka M., Schlingemann R. O., Verbraak F. D., “Effect of age on individual retinal layer thickness in normal eyes as measured with spectral-domain optical coherence tomography,” Invest. Ophthalmol. Visual Sci. 54(7), 4934–4940 (2013). 10.1167/iovs.13-11913 [DOI] [PMC free article] [PubMed] [Google Scholar]
- 38.den Haan J., Janssen S. F., van de Kreeke J. A., Scheltens P., Verbraak F. D., Bouwman F. H., “Retinal thickness correlates with parietal cortical atrophy in early-onset Alzheimer's disease and controls,” Alzheimers Dement (Amst) 10, 49–55 (2018). 10.1016/j.dadm.2017.10.005 [DOI] [PMC free article] [PubMed] [Google Scholar]
- 39.Zimmermann L., Weibel M., Caseri W., Suter U. W., Walther P., “Polymer nanocomposites with “Ultralow” refractive index,” Polym. Adv. Technol. 4(1), 1–7 (1993). 10.1002/pat.1993.220040101 [DOI] [Google Scholar]
- 40.Szabó D. V., Hanemann T., “Polymer nanocomposites for optical applications,” in Advances in Polymer Nanocomposites: Types and Applications, Gao F., ed. (Cambridge, 2012). [Google Scholar]
- 41.Dalod A. R. M., Grendal O. G., Blichfeld A. B., Furtula V., Pérez J., Henriksen L., Grande T., Einarsrud M., “Structure and optical properties of Titania-PDMS hybrid nanocomposites prepared by in situ non-aqueous synthesis,” Nanomaterials 7(12), 460 (2017). 10.3390/nano7120460 [DOI] [PMC free article] [PubMed] [Google Scholar]
- 42.Lozzi A., Agrawal A., Boretsky A., Welle C. G., Hammer D. X., “Image quality metrics for optical coherence angiography,” Biomed. Opt. Express 6(7), 2435–2447 (2015). 10.1364/BOE.6.002435 [DOI] [PMC free article] [PubMed] [Google Scholar]
- 43.Zhang A., Zhang Q., Chen C.-L., Wang R. K., “Methods and algorithms for optical coherence tomography-based angiography: a review and comparison,” J. Biomed. Opt. 20(10), 100901 (2015). 10.1117/1.JBO.20.10.100901 [DOI] [PMC free article] [PubMed] [Google Scholar]
- 44.Gorczynska I., Migacz J. V., Zawadzki R. J., Capps A. G., Werner J. S., “Comparison of amplitude-decorrelation, speckle-variation and phase-variance OCT angiography methods for imaging the human retina and choroid,” Biomed. Opt. Express 7(3), 911–942 (2016). 10.1364/BOE.7.000911 [DOI] [PMC free article] [PubMed] [Google Scholar]


