Abstract
Imaging parameters of photoacoustic breast imaging systems such as the spatial resolution and imaging depth are often characterized with phantoms. These objects usually contain simple structures in homogeneous media such as absorbing wires or spherical objects in scattering gels. While these kinds of basic phantoms are uncluttered and useful, they do not challenge the system as much as a breast does, and can thereby overestimate the system’s performance. The female breast is a complex collection of tissue types, and the acoustic and optical attenuation of these tissues limit the imaging depth, the resolution and the ability to extract quantitative information. For testing and challenging photoacoustic breast imaging systems to the full extent before moving to in vivo studies, a complex breast phantom which simulates the breast’s most prevalent tissues is required. In this work we present the first three dimensional multi-layered semi-anthropomorphic photoacoustic breast phantom. The phantom aims to simulate skin, fat, fibroglandular tissue and blood vessels. The latter three are made from custom polyvinyl chloride plastisol (PVCP) formulations and are appropriately doped with additives to obtain tissue realistic acoustic and optical properties. Two tumors are embedded, which are modeled as clusters of small blood vessels. The PVCP materials are surrounded by a silicon layer mimicking the skin. The tissue mimicking materials were cast into the shapes and sizes expected in the breast using 3D-printed moulds developed from a magnetic resonance imaging segmented numerical breast model. The various structures and layers were assembled to obtain a realistic breast morphology. We demonstrate the phantom’s appearance in both ultrasound imaging as photoacoustic tomography and make a comparison with a photoacoustic image of a real breast. A good correspondence is observed, which confirms the phantom’s usefulness.
1. Introduction
A combination of imaging techniques is nowadays used for breast cancer diagnosis. X-ray mammography (MMG) and/or ultrasound (US) imaging are almost always used and have been shown to decrease the breast cancer mortality [1]. Even though MMG is widely accepted, it has a relatively low sensitivity of 70-85%, caused by the loss of depth-vision by the projection of a 3D volume on a 2D plane [2]. The sensitivity is even lower in women with dense breasts (30-48%) due to the low radiographic contrast [1,3]. Multiple studies have shown that US does have a good performance in dense breasts and that the addition of this technique to MMG decreases the false positive (FP) and false negative (FN) rates. Nevertheless, US was also demonstrated to have a strong operator dependency and a limited detectability for microcalcifications and ductal carcinomas in situ (DCIS) [1]. The diagnostic work-up is extended with contrast enhanced magnetic resonance imaging (CE-MRI) when MMG and US do not lead to a decisive conclusion. CE-MRI has a higher sensitivity than MMG and is not affected by breast density, but has a limited specificity [4]. Besides, MRI is relatively expensive, has a limited accessibility and requires the injection of contrast agents [1]. As a result of these demerits, the search for non-invasive imaging techniques that may complement or substitute the current techniques is ongoing.
1.1. Photoacoustic imaging
Photoacoustic (PA) tomography is an up-and-coming hybrid imaging modality that is able to visualize blood vessels and tumor associated vascularization inside the breast without the need for exogenous imaging agents [5–9]. In PA imaging, the breast is illuminated with nanosecond pulses of near-infrared (NIR) laser light, which diffusely propagate through the tissue and primarily get absorbed by the chromophores hemoglobin (Hb) and oxyhemoglobin (HbO2) in the blood [10]. The locally absorbed optical energy is partially or completely converted into heat which causes the tissue to expand thermoelasticly. As a result, a heat-induced pressure wave in the US regime is released, which propagates through the tissue and can be detected with US transducers located around the breast [11,12]. A local initial pressure map, which is an indication of the absorbed energy, can be recovered with image reconstruction algorithms. High vessel densities, excessive cases of vessel branching and tortuous vessel shapes may signify the presence of cancer [13].
The combination of spatial resolutions equal to in US with the high-contrast and specificity of optical imaging, makes PA imaging a very promising technique for a variety of clinical applications [10]. Although it remains a challenge to image the whole breast volume, it is a technique with potential to complement the imaging modalities in the current breast cancer management procedure. As an additional potential diagnostic tool, endogenous chromophore concentrations can be estimated when PA is executed with multiple wavelengths on the same object [14]. This can provide functional and/or pathological information about the tissue [15]. The chromophores Hb and HbO2 are of high interest, since their concentrations can be used to derive blood oxygenation levels (SO2). The SO2 may relate to the pathological status of the tumor because tortuous and leaky vessels in the tumor region provide limited oxygen to the tissue, which decreases the saturation levels in the tumor region [16]. Besides, a low SO2 may also be an indication for high metabolic activities related to tumor growth [13,17].
1.2. Preparing a photoacoustic system for clinical studies
Several PA breast imaging systems have been developed over the last years, all designed differently and for varying applications [5–8,18–24]. Carefully controlled laboratory experiments with these systems can identify the most efficient and robust measurement protocols that will provide success in the clinics [25]. Measurements on elementary test-objects, such as homogeneous gels with liquid filled cavities, black hairs or other absorbing structures embedded [5,8,23,26,27], will provide valuable insights into the effects of measurement settings on the imaging parameters. However, they do not challenge the system as much as a real breast does and can thereby overestimate the system’s imaging performance [28]. Such experiments should therefore be succeeded by measurements on well characterized complex phantoms having tissue relevant acoustic and optical properties and a realistic morphology. Knowing the ground truth of the phantom, and having the possibility to try several measurement settings on the same object, is expected to be a valuable asset in optimizing the measurement protocol.
1.3. Photoacoustic phantoms
Quite some research has been performed on suitable tissue mimicking materials (TMMs) for PA imaging. Agarose and gelatin-based materials [29] are well known tissue substitutes and are straightforward to produce. But these materials are fragile and sound speeds lower than that of water cannot be obtained. Polyvinyl alcohol (PVA) is a well known TMM, with a good rigidity and longevity [30,31]. Drawbacks of this material are the long preparation times, limited tunability of the sound speed and inhomogeneities in the optical properties throughout the material [31–33]. Recently, gel wax was introduced as a new TMM for PA imaging. The optical material properties were shown to be well tunable and the material is rather stable [34,35]. The sound speed of gel wax can be changed with the addition of co-polymers, however these co-polymers coincidentally increase the acoustic attenuation [36]. The production of a TMM with a high sound speed and low acoustic attenuation may therefore be challenging. Polyvinyl chloride plastisol (PVCP) is another well known TMM [26,27,33,37,38]. It was shown to be an almost optically transparent and rigid material with many possibilities to vary the acoustic and optical material properties [27,33,38]. PVCP is commercially available in multiple stiffnesses, with softeners and hardeners available to alter the material’s stiffness even more. The addition of dyes and optical scatterers enables the regulation of the optical properties [33,37,39]. Vogt et al. [38] showed that soft tissues can be mimicked optically and acoustically with custom made PVCP formulations. Plasticizers were shown to dominate the material’s sound speed in a highly controlled way, at the same time keeping the acoustic attenuation low. The addition of ultrasound scatterers or a higher PVC resin concentration was shown to increase the acoustic attenuation [38]. Based on this work, Jia et al. [28] published the required formulations to mimic breast fat and somewhat denser fat-fibroglandular tissue, and used these formulations to develop a two-layer PA breast phantom with an anatomically relevant undulating tissue boundary. A comparison of the two-layer phantom with a homogeneous phantom showed that the reconstructed target size and depth are sensitive to the used reconstruction sound speed [28]. This work therefore emphasizes the need for anatomically relevant phantoms. While this work developed a 2.5D phantom for use in B-mode PA imaging, there is still a need for a 3D semi-anthropomorphic breast phantom for testing 3D PA tomography systems.
The introduction of multi-material 3D printing may ease the development of anatomically relevant phantoms, since the phantoms can be built up layer by layer allowing complex structures to be embedded. Inspiration may be taken from phantoms designed for x-ray imaging [40,41] and fluorescent brain imaging [42]. However, due to limited available 3D printing materials, it is not possible yet to print PA phantoms with both optical and acoustic properties matching the body’s soft tissues. Nevertheless, 3D printing of complex moulds opens up the possibility to build and assemble novel 3D PA phantoms, as has been shown recently for e.g. the heart, nerves, a placenta and blood vessels [34,43].
Recently, we introduced the use of 3D printing of moulds to make a breast phantom [44]. In this work, we build further upon this proof-of-concept to develop a definitive protocol, and demonstrate our method to layer by layer build a complex PVCP breast phantom containing skin, fat, fibroglandular tissue and blood vessels. Two clusters of small blood vessels are added to mimick highly vascularized tumors. All the materials’ optical and acoustic properties are measured and presented. We end with a demonstration of the phantom’s features in US imaging and PA tomography, and make a comparison with an in vivo PA image of a real breast. To encourage others to build this phantom, we provide the required files for 3D printing the moulds in the supplementary materials.
2. Materials and methods
2.1. Breast anatomy and phantom complexity
The adult breast consists of three major tissues: skin, subcutaneous fat and fibroglandular tissue with the latter comprising both glandular tissue and fibrous connective tissue [45]. The glandular tissue consists of 15 to 20 segments, which are radially arranged inside the breast and are separated from each other by fibrous connective tissue and fat. Each of these segments consist of 20 to 40 lobules which again consist of 10 to 100 alveoli that produce the milk when a woman is lactating [45]. The function of the fibrous tissue is to maintain the inner structure of the breast and attachment to the chest wall, while adipose tissue is connective tissue and determines the breast size [45]. The skin surrounding the breast has a thickness ranging from 0.6 to 2.7 mm [46] and the pigmentation differs per ethnicity. Furthermore, the breast contains a network of blood vessels and lymphatic vessels [45]. The ratio of subcutaneous fat and fibroglandular tissue differs from individual to individual and also with hormonal status (e.g. age, pregnancy) [47].
Ideally, the phantom to be developed should be as complex as a real breast. This is however not attainable with the current available techniques, and therefore only an approximation can be achieved. For this work, it was decided to build a phantom containing the breast’s three major tissues and blood vessels. Lou et al. [48] showed that realistic numerical breast models, containing all these four breast components, can be obtained by segmenting CE-MRI images. Moulds were made from these tissue volumes by making use of 3D printing, allowing the development of a realistic phantom morphology.
2.2. Protocol for PVCP production
Protocols for the production of fat, fibroglandular and blood TMMs from custom made PVCP were developed based on [28,38]. Since the largest part of the breast consists of the former two tissues, it is important that these TMMs are well characterized with high accuracy, both optically and acoustically. For blood TMM, it was decided to focus only on the optical absorption, since this will strongly influence the PA contrast. The optical scattering and acoustic properties of the blood TMM were not tuned, because this TMM comprises only a small volume of the breast. The TMMs were custom made from PVC resin (Geon 121A, Mexichem, USA) mixed with the plasticizers benzyl butyl phthalate (BBP) (Sigma-Aldrich, USA) and bis(2-ethylhexyl) adipate (DEHA) (Sigma-Aldrich, USA). The addition of glass beads (GB) (≤ 106 μm) (Sigma-Aldrich, USA), TiO2 (Sigma-Aldrich, USA, catalog number 248576) and black plastic coloring (BPC) (Lure Parts, The Netherlands) enabled the tuning of the acoustic and optical properties. The used compositions for fat, fibroglandular and blood TMM are listed in Table 1 . Blood TMM was made with the same protocol as fibroglandular TMM but glass beads were omitted to decrease the acoustic scattering. A volume percentage of 0.2% BPC was added for increased optical absorption.
Table 1. Compositions of the PVCP TMMs. TMM = tissue mimicking material, PVC = polyvinylchloride, HS = heat stabilizer, DEHA = Bis(2-ethylhexyl) adipate, BBP = Benzyl butyl phthalate, GB = glass beads, TiO2 = titaniumdioxide, BPC = black plastic coloring.
| TMM | PVC | HS | DEHA | BBP | GB | TiO2 | BPC |
|---|---|---|---|---|---|---|---|
| [m/m%] | [v/v%] | [v/v%] | [v/v%] | [mg/ml] | [mg/ml] | [v/v%] | |
| Fat | 15 | 1 | 58 | 42 | 25 | 6.4 | - |
| Fibroglandular | 15 | 1 | - | 99 | 105.5 | 3.5 | - |
| Blood | 15 | 1 | - | 99 | - | 3.7 | 0.2 |
The protocol used for PVCP fabrication was as follows: The desired quantities of plasticizer(s) and heat stabilizer (HS) (M-F Manufacturing, Texas, USA) were measured and mixed. PVC resin, which is a powder, was weighed and added to the plasticizer mixture under continuous stirring at 500 rpm. The mixture was then stirred for an extra 30 minutes to obtain a homogenous mixture. The solution was subsequently placed inside a desiccator to degas, until bubble formation stopped. The time this took depended on the volume of the mixture and the used plasticizers and ranged from 30-80 minutes. The required quantities of TiO2, glass beads and BPC were weighted, added to the solution and stirred for 15 minutes at 900 rpm. The mixture was heated au-bain-marie in an oil bath at 180 ∘C and was stirred regularly using a spatula. The mixture underwent two transitions, the first turned it in a gel-like suspension, and the second one in a viscous liquid. When the second transition was finished, the solution was placed back into the desiccator to degas for about 5-10 minutes. Finally, the PVCP was heated for another 5-10 minutes before pouring it into a mould.
2.2.1. 3D-printed moulds
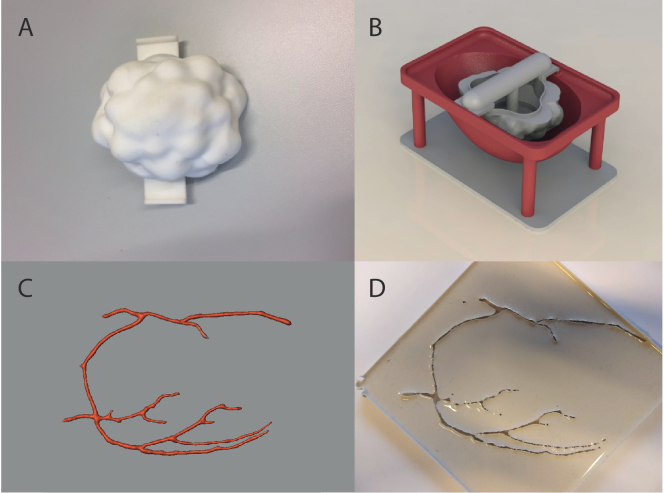
A negative of the contours of the numerical phantom referred to as Neg-35-Left [48] was printed as an outer mould to give the phantom a realistic breast shape (Dataset 1 (1.3MB, STL) [49]). The fibroglandular structure of the numerical phantom was found to be too complex to print. Therefore, a lobular shaped mould, having lobules ranging from 2 to 10 mm, was designed (see Fig. 1(a) and Dataset 2 (3.5MB, STL) [50]). These moulds were printed from Nylon (PA2200) with a Formiga P101 printer (EOS, Germany). This specific Nylon type has a melting temperature of 176 ∘C, which is just high enough to withstand the temperatures of the liquid PVCP mixtures at the moment of pouring. Precautions were taken to prevent deformation of the mould due to the heat, as described in section 2.2.2. Connection points were made on the two moulds to fixate them relative to each other (see Fig. 1(b)). The blood vessel structure from the numerical phantom was projected onto a 2D plane and was 3D printed from polylactic acid (PLA) (see Fig. 1(c) and Dataset 3 (2.7MB, stl) [51]). A negative of this model was subsequently made from Poly-Sil PS 81020 silicon rubber (Polyservice BV, The Netherlands) prepared according to the manufacturer’s instructions (see Fig. 1(d)). A fourth 3D printed mould consists of two hemispheres placed on top of each other, to together form a hollow sphere with a diameter of 20 mm (See Dataset 4 (1.9MB, STL) [52] & Dataset 5 (1.9MB, STL) [53]). This mould was used for the production of spherical tumors.
Fig. 1.
(A-C) Models of the 3D printed moulds. A) shows the lobular shaped mould, B) the outer mould with the lobular mould placed inside. C) shows the blood vessel model that was 3D printed and subsequently embedded in silicon rubber to create a negative mould (D).
2.2.2. Phantom fabrication
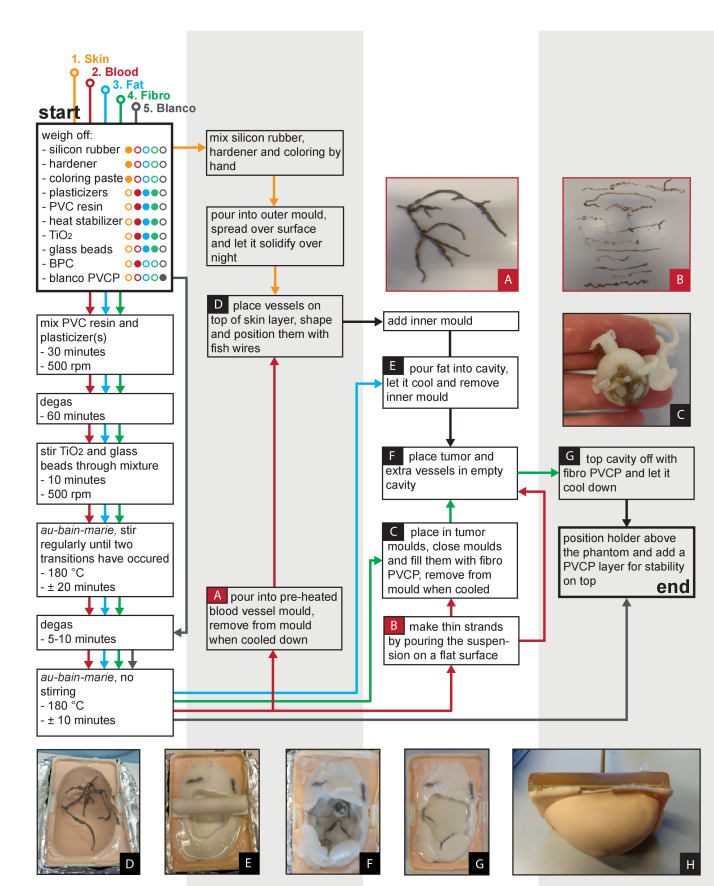
This section describes the entire process to build the phantom. The process is subdivided in four steps. Figure 2 summarizes this in a flow-scheme, where each TMM is represented by a different color.
-
1.
Skin
Skin TMM was made from Poly-Sil PS 81020 silicon rubber (Polyservice BV, The Netherlands), mixed with 7 m/m% hardener (Polyservice BV, The Netherlands) and 0.5 m/m% orange coloring paste (Polyestershoppen BV, The Netherlands). The mixture was poured into the outer mould and the mould was swiveled by hand to let the silicon rubber cover the entire surface of the mould, giving it a thickness of approximately 1 mm. This was performed until the silicon rubber’s viscosity was sufficiently high to keep it in place. The silicone rubber was kept overnight on the mould to solidify.
-
2.
Blood vessels
Blood mimicking PVCP was produced as described in section 2.2. During the blood TMM preparation, the silicon mould was placed in an oven at 60 ∘C. Upon pouring, the mould was slightly bent to widen the blood vessel channels to ease the entering PVCP suspension. After cooling down, the blood TMM was removed from the mould and excess PVCP was cut off to remain with the vessels (see Fig. 2(a)). The blood vessels were positioned inside the outer mould on top of the skin layer. Some of the blood vessel strands were attached to transparent fish wires to shape them in 3D (see Fig. 2(d)). Remaining blood TMM was poured on a plate while quickly moving the glass beaker to produce thin strands (see Fig. 2(b)). These were used later as thin blood vessels inside the tumor models.
-
3.
Tumor
A small volume of fibroglandular TMM was prepared. The thin blood vessels were placed inside the spherical tumor mould, and the mould was closed. The hole on the top of the mould allowed the injection of fibroglandular TMM to fill up the empty space inside the mould. After cooling the mould was opened, and the sphere representing the tumor was removed (see Fig. 2(c)). The tumor was placed in the outer mould on top of the skin layer. Subsequently, the lobular shaped mould was placed inside the outer mould.
-
4.
Fat and fibroglandular tissue
To prevent deformation of the outer mould in response to the hot PVCP, the moulds were placed in a container filled with moisturized loam, supporting the outer mould from the underside. One of the tumors was placed in between the skin layer and the inner mould. Fat TMM was subsequently prepared and was poured to fill the empty space between the skin layer (in the outer mould) and the inner mould (see Fig. 2(e)). It was kept overnight to cool down and solidify. Next day, the fish wires and the inner mould were removed from the phantom, and some extra blood vessels and a second tumor were placed inside the remaining cavity (see Fig. 2(f)). Fibroglandular TMM was prepared and poured into the cavity (see Fig. 2(g)). Finally the phantom was topped off with a layer of commercial PVCP (Lure Factors, United Kingdom), which we refer to as blanco in Fig. 2. No additives were used and it was prepared according to the manufacturer’s protocol. This blanco layer was added for extra stability and to attach a holder to the phantom (see Fig. 2(h)).
Fig. 2.
Flow scheme for the development of the phantom together with pictures taken during the process. Different colors indicate the different TMMs. The numbers indicate the order of production.
2.3. Characterization of the TMMs
2.3.1. Acoustic material properties
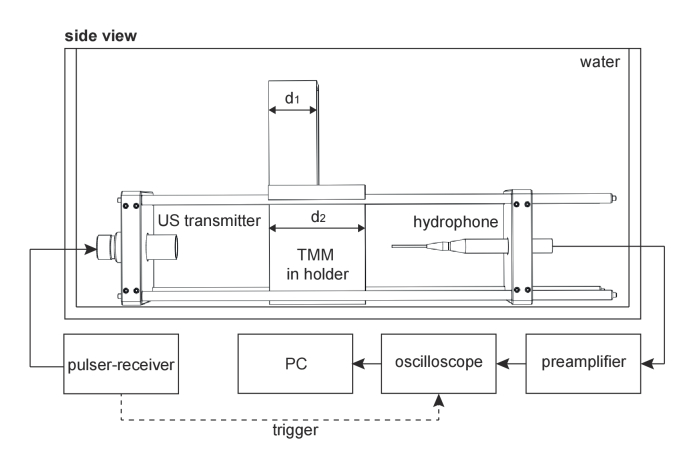
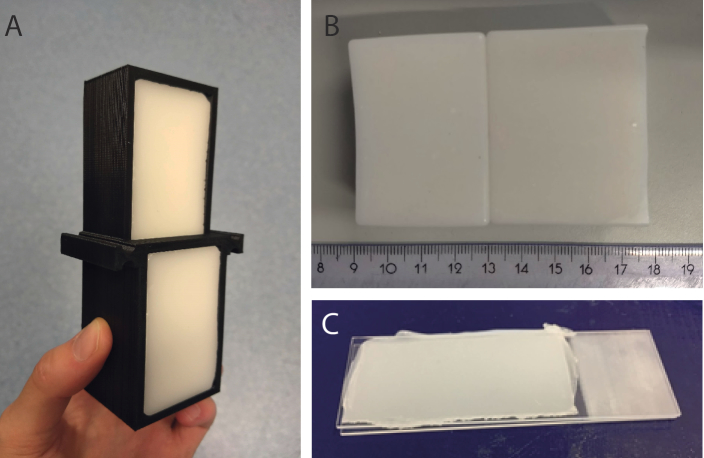
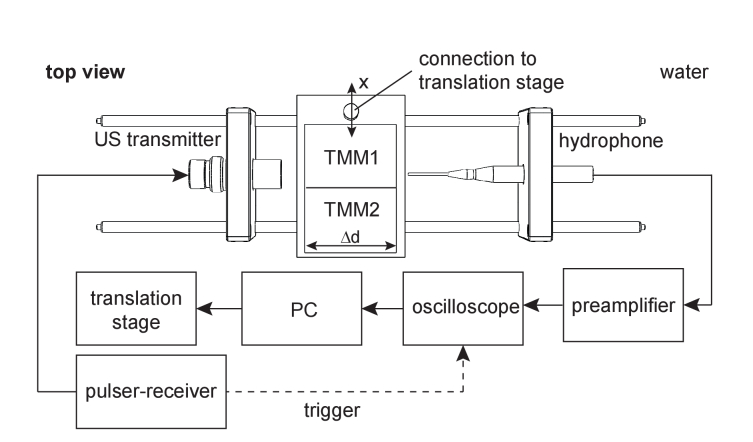
The acoustic properties were measured by making use of a modified insertion method [54]. The measurement set-up is schematically shown in Fig. 3 . TMM test blocks were prepared in an aluminum mould with a thinner upper half (d1) than bottom half (d2) (Dataset 6 (122.6KB, STL) [55]). Metal plates were glued to the open sides of this mould, which could be removed after the solidification of the PVCP, to allow removal of the test block from the mould. A holder for these test blocks was developed and printed from PLA (Dataset 7 (111.6KB, STL) [56]). It allowed to place the test block both upright and upside-down in the measurement set-up, such that measurements could be performed through both the thin as the thick part sequentially (Fig. 4(a) ). Transmission measurements were performed through the two material thicknesses d1 and d2, in succession. Utilizing these two scan lines has the advantage that reflections at the water-TMM interface cancel during data analysis, which improves the measurement accuracy. Knowing the temperature of the water and the the sound speed in water (), the sound speed of the sample () [m/s] was calculated with
| (1) |
where , is the difference in material thickness on the two scan lines and the difference in the pulse time of arrival of the two measurements.
Fig. 3.
Schematic of set-up used for acoustic characterization measurements. The TMM block in holder can be flipped upside-down to measure through the thinner part (d1) of the TMM.
Fig. 4.
Photographs of prepared samples for characterization. (A) the acoustic test block having a thin upper part and a thick bottom part, placed inside a holder. (B) adjacent fat and fibroglandular TMM blocks for plasticizer diffusion measurements. (C) a 1 mm thick TMM slab inclined between two microscope slides.
The frequency dependent acoustic attenuation [dB/cm] was obtained with
| (2) |
where and are the amplitude spectra of the transmission measurements through the thin and thick parts of the TMM block respectively. The acoustic attenuation in water was neglected. Measurements were performed with a set of transducers (Olympus NDT, USA) of 1, 2.25 and 5 MHz (V303-SU, V306-SU, V309-SU), covering the frequency range between 0.2 and 6.5 MHz. For each transducer, the frequency range with a sufficiently high signal-to-noise ratio (SNR) was selected from the data.
The density () of the materials at room temperature was determined by measuring the mass with an analytic balance (Santorius M-power, Germany) and the volume with the water displacement method. The acoustic impedance [MRayl] was thereafter calculated from the measured and :
| (3) |
Acoustic amplitude reflection coefficients at material interfaces can consequently be calculated with [57]
| (4) |
where and are the acoustic impedances of the first and second medium the wave encounters.
2.3.2. Optical material properties
Optical absorption and scattering were evaluated with the inverse adding-doubling (IAD) method [58]. PVCP samples with a 1 mm thickness were prepared between two microscope slides (Fig. 4(c)) making use of 1 mm spacers. A spectrophotometer with integrating sphere (Shimadzu UV2600, Japan) measured both transmittance and reflection of the samples.
2.4. Phantom stability
Since different PVCP TMMs contain different plasticizer types and concentrations, diffusion of these plasticizers may occur through the touching sides. The local will be influenced by the diffusion, since plasticizers are the determining factor of this acoustic material property [38]. A set-up (13 mm lateral resolution) was developed to display the diffusion based on measurements and the diffusion was followed over a period of a month.
Fat and fibroglandular TMM blocks were made and stored adjacent to each other (see Fig. 4(b)). US transmission measurements were performed along the longitudinal side of the PVCP block as shown in Fig. 5 . US pulses were emitted using a 1 MHz immersion transducer (V303-SU, Olympus NDT, USA) and the transmitted waves were recorded using a hydrophone needle (Precision Acoustics, UK). The PVCP blocks translated in steps of 1 mm along the x-axis, between the emitter and detector. Equation 1 was used to calculate the at every x-position. For this application, is equal the length of the block and is the difference between the pulse time of arrival of the measurement through the TMM, and the pulse time of arrival of a reference measurement through water. Measurements were performed on day 1, 10, 20 and 30 after production.
Fig. 5.
Schematic of measurement setup for monitoring diffusion of plasticizer between two adjacent TMM layers. A translation stage moves the TMM blocks between the transducer and the hydrophone needle along the x-axis in 1 mm steps. A transmission measurement is recorded at each location.
2.5. Imaging
The appearance of the phantom was tested for two different imaging modalities: US B-mode imaging and PA tomography. US B-scans were made with the Alpinion E-Cube12a research system (Alpinion Medical Systems, Korea) using the L3-12 linear probe operating at 6 MHz.
Three-dimensional PA images were acquired with the Twente Photoacoustic Mammoscope 2 (PAM2) system [8]. The PAM2 system is a tomographic set-up having 12 arc-shaped detector arrays, all placed around a central axis. Each detector arm contains 32 elements centered at 1 MHz. During a measurement these arrays rotate around this central axis to increase the density of detection points. Illumination with short 755 nm laser pulses comes from a large fiber at the bottom of the imaging tank combined with nine smaller optical fibers for side-illumination [8]. During the measurement, the imaging tank was rotated over a 60∘ angle in 45 steps. For each step 100 averages were taken. Finally, the images were reconstructed with a filtered back projection algorithm. The result was visualized as a color-coded local maximum intensity projection (LMIP) [59].
3. Results
3.1. Material properties
3.1.1. Acoustic properties
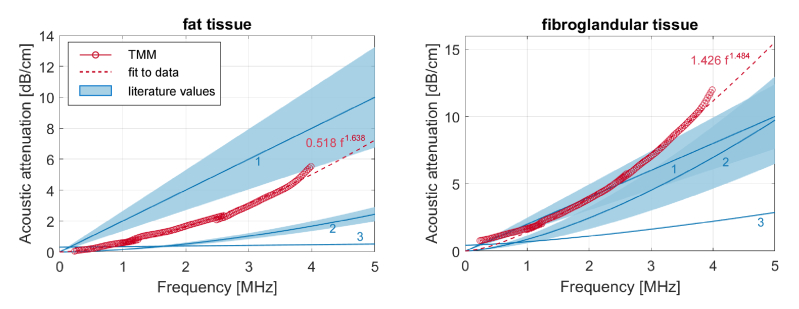
Figure 6 shows the acoustic attenuation as a function of frequency for fat and fibroglandular TMM. For both TMMs a comparison with attenuation values known from literature is made. A wide variability is found in literature, caused by different measurement methods and inter-tissue variability. The attenuation functions from literature [60–62] are shown as blue lines in the Figs. and the shaded areas are their respective error ranges. The power law fits to the measured data [dB/cm] are shown in dashed lines, and were found to be for fat TMM and for fibroglandular TMM, with f is the frequency in MHz. For both TMMs, a good agreement with the literature values can be observed.
Fig. 6.
Measured acoustic attenuation together with its power law fit (dashed line) against literature values with their error intervals as shaded areas. 1 = Edmonds et al. [60], 2 = d’Astous and Foster [61], 3 = Landini et al. [62].
Table 2 summarizes the measured , and together with tissue realistic values from literature. It shows that the of the fat and fibroglandular TMMs are tuned well and fall inside the literature error margins. The of blood TMM is too low to be realistic, but this is omitted since only a small volume fraction of the phantom consists of this material. The of all the TMMs is on the high side, which consequently also results in a too high for the fat and fibroglandular TMMs. The combination of the low of blood TMM together with the high results in a realistic . Despite the increased of fat and fibroglandular TMMs, the acoustic reflection coefficient of the fat-fibroglandular TMM interface was calculated to be 8.75%, which comes really close to the true reflection coefficient of 7.64% calculated from literature values.
Table 2. The measured sound speed (), density () and acoustic impedance () of the PVCP TMMs together with literature values [38,48,57,63–72]. The shown literature values are the average values from the different studies with corresponding error intervals.
| Type | [m/s] | [kg/m3] | [MRayl] | |
|---|---|---|---|---|
| Fat | measured | 1428 ± 2 | 1021 ± 25 | 1.46 ± 0.04 |
| literature | 1440 ± 20 | 928 | 1.33 ± 0.02 | |
| Fibroglandular | measured | 1516 ± 2 | 1149 ± 29 | 1.74 ± 0.05 |
| literature | 1524 ± 27 | 1020 | 1.55 ± 0.04 | |
| Blood | measured | 1505 ± 2 | 1123 ± 54 | 1.69 ± 0.08 |
| literature | 1582 ± 5 | 1060 | 1.68 ± 0.01 | |
3.1.2. Optical properties
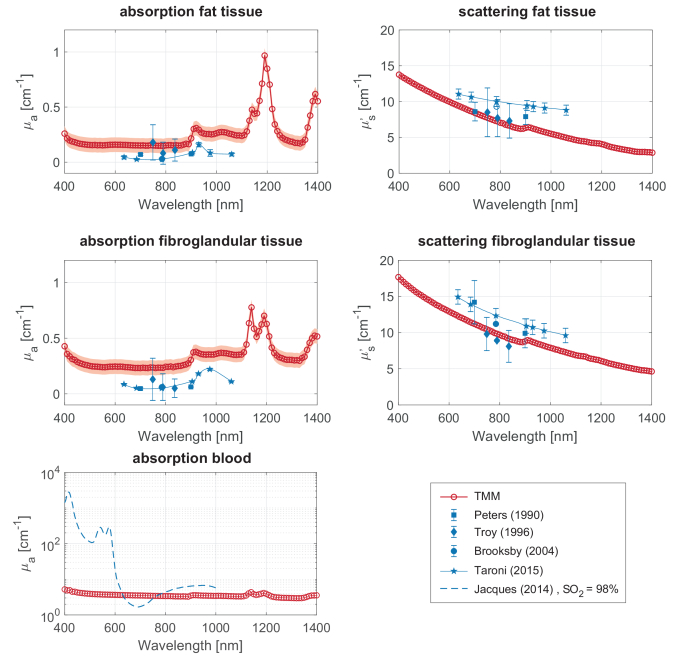
Figure 7 shows the absorption () and reduced scattering () coefficients for the different PVCP formulations. The measured data (open symbols) is shown together with tissue realistic values (solid symbols). The decays with wavelength, while the does not show a strong wavelength dependence. The measured for the fat and fibroglandular formulations match the literature values very well. Tuning the for the fibroglandular and fat formulations was not as straightforward. Absorption of the PVCP base materials and the added glass beads [38] result in values that are on average 0.2 cm-1 higher than the tissue relevant values. The absorption of fibroglandular TMM is a bit higher than for fat TMM, caused by the higher concentration of glass beads. The absorption values we measured are also higher than the values reported by Jia et al. [28] for their fat and fibroglandular-fat TMM formulations, which might be explained by the higher concentration of glass beads in our formulations, slight differences in the PVCP preparation protocols or limited accuracy of the optical characterization method.
Fig. 7.
Optical absorption coefficient and reduced scattering coefficient measured with the IAD method (open symbols), with expected error intervals (shaded in red) from calibration measurements on samples with known optical properties. A comparison is made with values from literature [73,75–78].
Due to the addition of black plastic coloring, the absorption coefficient of the blood TMM is an order of magnitude higher than for the other TMMs. A comparison with the absorption spectrum of blood with an SO2 of 98% [73] shows that the blood TMM is suitable for PA measurements with illumination wavelengths close to 630 or 765 nm.
The optical properties of the skin mimicking layer were not tuned to tissue relevant values, but were measured to be 0.28 cm-1 () and 176.5 cm-1 ( ) at 755 nm. Comparing this with [74] tells that the skin TMM has a that is on average 0.17 cm-1 lower than in light skinned humans and that the is significantly higher than that of average human skin.
3.2. Phantom stability
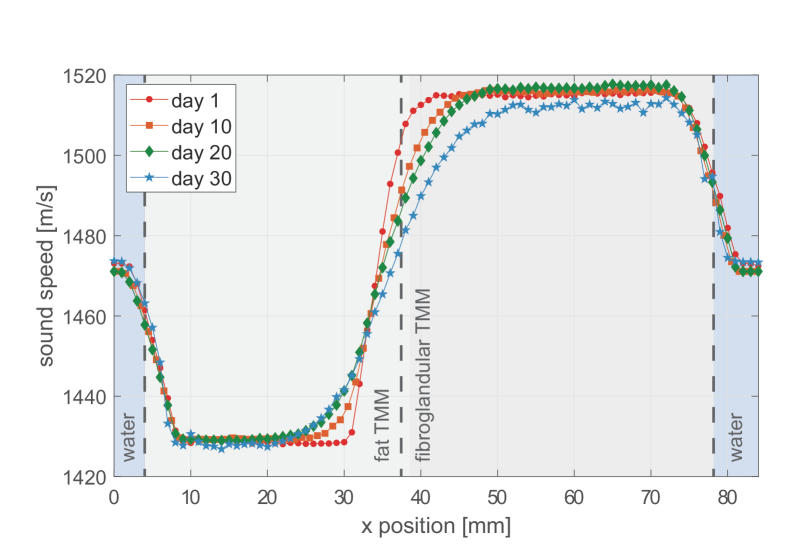
Figure 8 shows the profile along the length of two adjacent fat and fibroglandular TMM blocks in water on day 1, 10, 20 and 30 after production. The locations of the material interfaces are depicted as dashed lines. Gradual increments in can be observed around the material interfaces. A discrete step would be expected at the water-TMM interfaces, but the wide opening angle of the receiving hydrophone needle reduces the steepness. The slope around the fat-fibroglandular TMM interface decreases over time, which illustrates that plasticizers diffuse from one material into the other. The diffusion does not seem to have stabilized after a period of a month, indicating that the equilibrium has not been reached yet and that diffusion of plasticizers will continue.
Fig. 8.
Sound speed in adjacent fat and fibroglandular TMM blocks monitored over a period of a month. The material boundaries are shown as dashed lines in the background.
3.3. Imaging performance
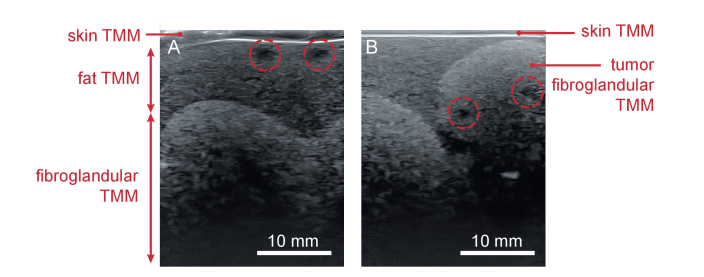
Figure 9(a) shows that the layered architecture of the phantom can be visualized with US imaging. All four tissue types can be observed, due to differences in speckle contrast. The skin shows as a bright region in the top part of the image. The fibroglandular layer contains more scatterers than the fat layer, which makes it brighter and makes the undulating fibroglandular-fat interface visible. Blood vessels do not contain glass beads and do therefore show up as dark areas. One of the two tumors was inclined between the skin and fibroglandular layer, contains two blood vessels and can be observed in Fig. 9(b).
Fig. 9.
B-mode US images of the phantom acquired at two different positions. A) shows the phantom’s layered architecture and the undulating fat-fibroglandular boundary. B) shows the tumor model (made from fibroglandular TMM) embedded in the fat TMM layer, on top of fibroglandular TMM. Blood vessels are encircled.
US B-mode scans were made again at 30 days after phantom production and did not show significant changes, indicating that the acoustic scatterers are stable over this time period.
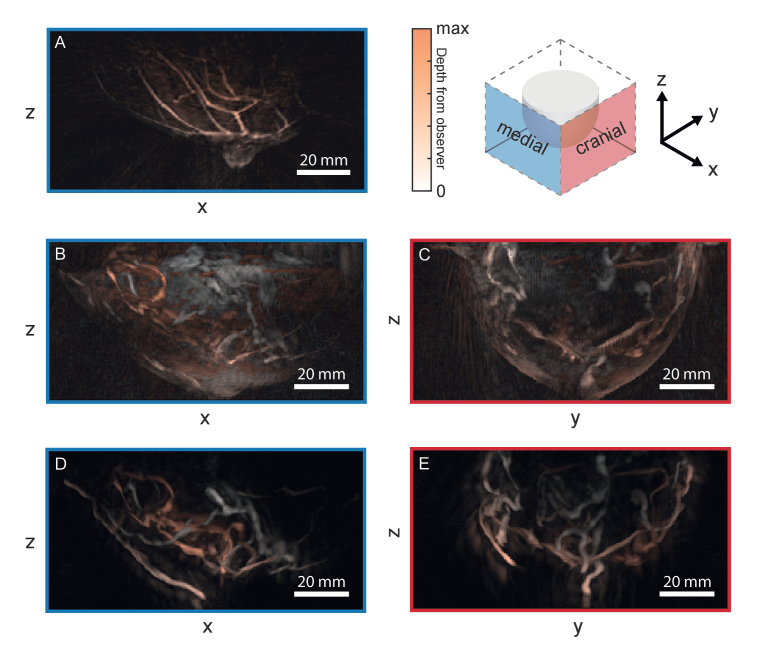
Fig. 10 shows the obtained LMIP of the PA images of the phantom (B t/m E) together with a healthy volunteer measurement (A) as a reference. B and C show the medial and cranial views of the phantom. The contours of the phantom are visible in these images due to the PA signal generation by the skin. Since the skin TMM was not tuned to have realistic optical and acoustic properties, a second measurement where the skin was removed from the phantom was performed, resulting in crisp blood vessel structures and the absence of a breast contour (D,E).
Fig. 10.
Local maximum intensity projections of the PA tomography measurements with the PAM2 system. A) is a medial view of a healthy volunteer measurement as presented in [79] (Reproduced with permission of the authors. Publisher permission sought, in progress). B-E are the medial and cranal views of the phantom measurements, where B) and C) are the results of the measurement on the phantom with skin and D) and E) of the measurement without the skin. The color-coding indicates the depth from the observer, where white is superficial and red is deep.
The in vivo measurement was performed with the same measurement protocol and post-processing as our phantom measurements. The healthy volunteer is a 29 year-old woman, having a light skin tone. Schoustra et al. logged an imaging depth of 20 mm for this healthy volunteer measurement [79] and a depth of 22 mm for a measurement on a 25 year old healthy volunteer [8]. These values were obtained by tracing one of the blood vessels up to the deepest depth where it was still visible. Using the same method we also determined the imaging depth in our phantom measurements. For both measurements the same vessel was followed and in both cases this resulted in an imaging depth of 27 mm. For both the healthy volunteer measurement as the phantom measurement, signals only seem to come from the skin, nipple and blood vessels making the appearance comparable.
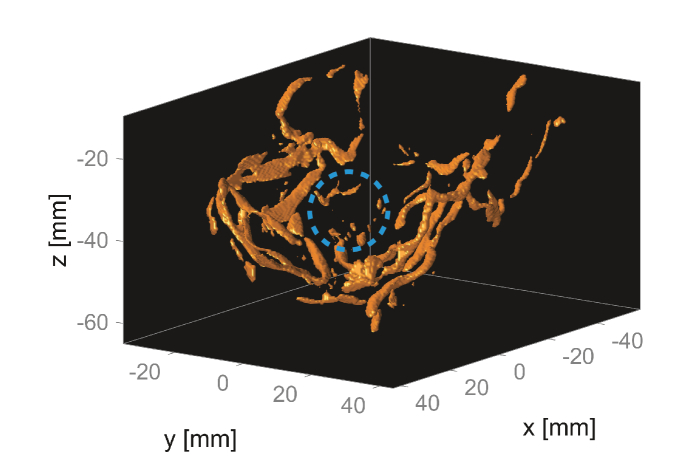
The tumor that was embedded in the phantom’s fat layer falls outside of the field of view (FOV) of the device as the phantom has been mounted, and can therefore not be observed in the images. The second tumor, located in the fibroglandular layer at a depth of 10-30 mm from the skin, does fall inside the the FOV. Figure 11 shows a 3D model of the segmented vasculature inside the phantom, which was obtained by thresholding the reconstruction of the measurement without skin. A vessel and several speckles originating from the tumor’s vasculature can be observed and are encircled.
Fig. 11.
Thresholded reconstruction of the measurement without the skin. The location of the tumor in the fibroglandular layer in encircled, and contains a small vessel and several speckles.
4. Discussion and outlook
We have shown a method to build a PVCP semi-anthropomorphic breast phantom that is suitable for use in PA and US imaging. The phantom’s anatomic complexity, robustness and the well characterized material properties make it widely applicable.
The phantom has been demonstrated to have a good appearance in both US as PA tomography; all the four different tissue types can be observed in US imaging and the PA images have a similar appearance as images from in vivo measurements. In the PA measurements, the skin and the blood vessels are visible, while no signals seem to arise from the fibroglandular and fat tissue (Fig. 10(b&c)). This is generally similar to observations in vivo (Fig. 10(a)). The PA imaging depth in the phantom was found to be 27 mm, while the imaging depth in healthy volunteer measurements was logged to be 20-22 mm [8,79]. The breast tissue properties of these specific volunteers are unknown, which makes it impossible to make a fair comparison.
Two tumor models containing thin blood vessels were embedded in the phantom and could be observed with US imaging. PA imaging detected signals coming from the vessels of the tumor embedded in the fibroglandular layer at a depth of 10-30 mm from the skin. The second tumor was not observed with PA imaging, because it was located just outside the FOV of the device. Comparisons between the PA appearance of this model and the PA appearance of real lesions should point out whether this tumor model properly imitates a real tumor.
The fat and fibroglandular TMMs have been well characterized both optically as acoustically. The , and are tuned very well to tissue relevant values. The of these TMMs are on the high side, consequently resulting in a too high . The of both TMMs are however still relevant for soft tissues, and the reflection coefficient on the fat-fibroglandular interface (8.75%) closely approximates the reflection coefficient calculated from the tissues’ literature values (7.64%). For both TMMs, the is on average 0.2 too high. Knowing that glass beads increase the [38], acoustical scatterers with a higher optical transparency should be sought for future studies.
The optical absorption of the blood vessels is of high importance for PA imaging, and has a realistic for wavelengths close to 630 and 765 nm. The BPC concentration must be adjusted when wanting to measure with other wavelengths.
The skin TMM was not characterized since it only comprises a small volume fraction of this phantom. The global variability in skin tones makes it important to have a fine control of the optical properties of the skin layer. This will be investigated further in future studies together with methods to carefully control the skin thickness.
Measurements on two adjacent TMM blocks showed that plasticizers diffuse from one TMM layer into the other and thereby change the material’s . The occurrence of diffusion may indicate inadequate fusion of the plasticizers, possibly caused by insufficient heating during the production process. The diffusion of plasticizers is however a well-known problem in industry and several methods are known to counteract it for specific types of plasticizers. Initial experiments based on this knowledge were carried out. Exposure of the TMMs to UV radiation for several hours or addition of a thin silicone layer between the two TMM blocks did not show any improvements. Polytetrafluoroethylene (PTFE) oil did seem to slow down the diffusion, which may be a hint to continue looking into hydrophobic materials.
For using the phantom in quantitative PA, a more advanced blood TMM should be developed. Multiple dyes are required to have correct absorption coefficients at two or more wavelengths. Another option is to embed hollow channels inside the phantom where blood or blood mimicking liquids can be flushed through. The latter enables the simulation of different SO2 levels by mixing two or multiple fluids or by oxygenating them.
A lingering question is what complexity we want to achieve in these kind of phantoms. A reason why simplistic test objects underestimate the system’s imaging performance is the lack of irregular tissue boundaries, which cause ultrasonic reflections and refraction and thereby increase the difficulty of reconstructing the image. Therefore, complexities must be such that ultrasound and light propagate through the phantom in a comparable way as in a real breast. However, the required extent of complexity is unknown and can also differ per imaging system. In silico studies on numerical breast phantoms should be performed to uncover the needed phantom complexity.
Acknowledgements
The authors like to thank Sjoukje Schoustra for performing the photoacoustic measurements and Tim op ’t Root (PA Imaging, The Netherlands) for making the reconstructions. They also like to thank Johan van Hespen and Wilma Petersen for all their help in the lab, Christian Wiest (iThera Medical, GmbH) for providing us a first batch of PVC resin, and Francoise Siepel and Vincent Groenhuis for the fruitful discussions about phantom designs. This work was part of the European Horizon 2020 PAMMOTH project under grant agreement No 732411, an initiative of the Photonics Public Private Partnership.
Funding
Horizon 2020 Framework Programme10.13039/100010661 (732411).
Disclosures
The authors declare that there are no conflicts of interest related to this article.
References
- 1.Hooley R. J., Andrejeva L., Scoutt L. M., “Breast cancer screening and problem solving using mammography, ultrasound, and magnetic resonance imaging,” Ultrasound Q. 27(1), 23–47 (2011). 10.1097/RUQ.0b013e31820e15ac [DOI] [PubMed] [Google Scholar]
- 2.Tingberg A., “X-ray tomosynthesis: a review of its use for breast and chest imaging,” Radiat. Prot. Dosim. 139(1-3), 100–107 (2010). 10.1093/rpd/ncq099 [DOI] [PubMed] [Google Scholar]
- 3.Berg W. A., “Supplemental screening sonography in dense breasts,” Radiol. Clin. 42(5), 845–851 (2004). 10.1016/j.rcl.2004.04.003 [DOI] [PubMed] [Google Scholar]
- 4.Morrow M., Waters J., Morris E., “Mri for breast cancer screening, diagnosis, and treatment,” Lancet 378(9805), 1804–1811 (2011). 10.1016/S0140-6736(11)61350-0 [DOI] [PubMed] [Google Scholar]
- 5.Kruger R. A., Kuzmiak C. M., Lam R. B., Reinecke D. R., Del Rio S. P., Steed D., “Dedicated 3d photoacoustic breast imaging,” Med. Phys. 40(11), 113301 (2013). 10.1118/1.4824317 [DOI] [PMC free article] [PubMed] [Google Scholar]
- 6.Toi M., Asao Y., Matsumoto Y., Sekiguchi H., Yoshikawa A., Takada M., Kataoka M., Endo T., Kawaguchi-Sakita N., Kawashima M., Fakhrejahani E., Kanao S., Yamaga I., Nakayama M., Tokiwa M., Torii M., Yagi T., Sakurai T., Togashi K., Shiina T., “Visualization of tumor-related blood vessels in human breast by photoacoustic imaging system with a hemispherical detector array,” Sci. Rep. 7(1), 41970 (2017). 10.1038/srep41970 [DOI] [PMC free article] [PubMed] [Google Scholar]
- 7.Lin L., Hu P., Shi J., Appleton C. M., Maslov K., Li L., Zhang R., Wang L. V., “Single-breath-hold photoacoustic computed tomography of the breast,” Nat. Commun. 9(1), 2352 (2018). 10.1038/s41467-018-04576-z [DOI] [PMC free article] [PubMed] [Google Scholar]
- 8.Schoustra S. M., Piras D., Huijink R., op’t Root Tim J. P. M., Alink L., Muller Kobold W. F., Steenbergen W., Manohar S., “Twente photoacoustic mammoscope 2: system overview and three-dimensional vascular network images in healthy breasts,” print (2019). [DOI] [PMC free article] [PubMed]
- 9.Heijblom M., Piras D., Xia W., van Hespen J., Klaase J., van den Engh F., van Leeuwen T., Steenbergen W., Manohar S., “Visualizing breast cancer using the twente photoacoustic mammoscope: What do we learn from twelve new patient measurements?” Opt. Express 20(11), 11582–11597 (2012). 10.1364/OE.20.011582 [DOI] [PubMed] [Google Scholar]
- 10.Beard P., “Biomedical photoacoustic imaging,” Interface Focus 1(4), 602–631 (2011). 10.1098/rsfs.2011.0028 [DOI] [PMC free article] [PubMed] [Google Scholar]
- 11.Wang L. V., Yao J., “A practical guide to photoacoustic tomography in the life sciences,” Nat. Methods 13(8), 627–638 (2016). 10.1038/nmeth.3925 [DOI] [PMC free article] [PubMed] [Google Scholar]
- 12.Manohar S., Razansky D., “Photoacoustics: a historical review,” Adv. Opt. Photonics 8(4), 586–617 (2016). 10.1364/AOP.8.000586 [DOI] [Google Scholar]
- 13.Hanahan D., Weinberg R. A., “Hallmarks of cancer: the next generation,” Cell 144(5), 646–674 (2011). 10.1016/j.cell.2011.02.013 [DOI] [PubMed] [Google Scholar]
- 14.Li M., Tang Y., Yao J., “Photoacoustic tomography of blood oxygenation: A mini review,” Photoacoustics (2018). [DOI] [PMC free article] [PubMed]
- 15.Cox B. T., Laufer J. G., Beard P. C., Arridge S. R., “Quantitative spectroscopic photoacoustic imaging: a review,” J. Biomed. Opt. 17(6), 061202 (2012). 10.1117/1.JBO.17.6.061202 [DOI] [PubMed] [Google Scholar]
- 16.Carmeliet P., Jain R. K., “Angiogenesis in cancer and other diseases,” Nature 407(6801), 249–257 (2000). 10.1038/35025220 [DOI] [PubMed] [Google Scholar]
- 17.Carmeliet P., Jain R. K., “Molecular mechanisms and clinical applications of angiogenesis,” Nature 473(7347), 298–307 (2011). 10.1038/nature10144 [DOI] [PMC free article] [PubMed] [Google Scholar]
- 18.Menezes G. L., Pijnappel R. M., Meeuwis C., Bisschops R., Veltman J., Lavin P. T., van de Vijver M. J., Mann R. M., “Downgrading of breast masses suspicious for cancer by using optoacoustic breast imaging,” Radiology 288(2), 355–365 (2018). 10.1148/radiol.2018170500 [DOI] [PubMed] [Google Scholar]
- 19.Neuschler E. I., Butler R., Young C. A., Barke L. D., Bertrand M. L., Böhm-Vélez M., Destounis S., Donlan P., Grobmyer S. R., Katzen J., Kist K. A., Lavin P. T., Makariou E. V., Parris T. M., Schilling K. J., Tucker F. L., Dogan B. E., “A pivotal study of optoacoustic imaging to diagnose benign and malignant breast masses: a new evaluation tool for radiologists,” Radiology 287(2), 398–412 (2018). 10.1148/radiol.2017172228 [DOI] [PubMed] [Google Scholar]
- 20.Diot G., Metz S., Noske A., Liapis E., Schroeder B., Ovsepian S. V., Meier R., Rummeny E., Ntziachristos V., “Multispectral optoacoustic tomography (msot) of human breast cancer,” Clin. Cancer Res. 23(22), 6912–6922 (2017). 10.1158/1078-0432.CCR-16-3200 [DOI] [PubMed] [Google Scholar]
- 21.Becker A., Masthoff M., Claussen J., Ford S. J., Roll W., Burg M., Barth P. J., Heindel W., Schäfers M., Eisenblätter M., Wildgruber M., “Multispectral optoacoustic tomography of the human breast: characterisation of healthy tissue and malignant lesions using a hybrid ultrasound-optoacoustic approach,” Eur. Radiol. 28(2), 602–609 (2018). 10.1007/s00330-017-5002-x [DOI] [PubMed] [Google Scholar]
- 22.Heijblom M., Steenbergen W., Manohar S., “Clinical photoacoustic breast imaging: the Twente experience,” IEEE Pulse 6(3), 42–46 (2015). 10.1109/MPUL.2015.2409102 [DOI] [PubMed] [Google Scholar]
- 23.Asao Y., Hashizume Y., Suita T., Nagae K.-I., Fukutani K., Sudo Y., Matsushita T., Kobayashi S., Tokiwa M., Yamaga I., Fakhrejahani E., Masae T., Kawashima M., Takada M., Kanao S., Kataoka M., Shiina T., Toi M., “Photoacoustic mammography capable of simultaneously acquiring photoacoustic and ultrasound images,” J. Biomed. Opt. 21(11), 116009 (2016). 10.1117/1.JBO.21.11.116009 [DOI] [PubMed] [Google Scholar]
- 24.Oraevsky A., Su R., Nguyen H., Moore J., Lou Y., Bhadra S., Forte L., Anastasio M., Yang W., “Full-view 3d imaging system for functional and anatomical screening of the breast,” in Photons Plus Ultrasound: Imaging and Sensing 2018, vol. 10494 (International Society for Optics and Photonics, 2018), pp.104942Y-1–104943Y-10. [Google Scholar]
- 25.Manohar S., Dantuma M., “Current and future trends in photoacoustic breast imaging,” Photoacoustics (2019). 10.1016/j.pacs.2019.04.004 [DOI] [PMC free article] [PubMed]
- 26.Vogt W. C., Zhou X., Andriani R., Wear K. A., Pfefer T. J., Garra B. S., “Photoacoustic oximetry imaging performance evaluation using dynamic blood flow phantoms with tunable oxygen saturation,” Biomed. Opt. Express 10(2), 449–464 (2019). 10.1364/BOE.10.000449 [DOI] [PMC free article] [PubMed] [Google Scholar]
- 27.Jeong E.-J., Song H.-W., Lee Y.-J., Park S. J., Yim M. J., Lee S. S., Kim B. K., “Fabrication and characterization of pvcp human breast tissue-mimicking phantom for photoacoustic imaging,” BioChip J. 11(1), 67–75 (2017). 10.1007/s13206-016-1109-4 [DOI] [Google Scholar]
- 28.Jia C., Vogt W. C., Wear K. A., Pfefer T. J., Garra B. S., “Two-layer heterogeneous breast phantom for photoacoustic imaging,” J. Biomed. Opt. 22(10), 1–14 (2017). 10.1117/1.JBO.22.10.106011 [DOI] [PubMed] [Google Scholar]
- 29.Cook J. R., Bouchard R. R., Emelianov S. Y., “Tissue-mimicking phantoms for photoacoustic and ultrasonic imaging,” Biomed. Opt. Express 2(11), 3193–3206 (2011). 10.1364/BOE.2.003193 [DOI] [PMC free article] [PubMed] [Google Scholar]
- 30.Kharine A., Manohar S., Seeton R., Kolkman R. G., Bolt R. A., Steenbergen W., de Mul F. F., “Poly (vinyl alcohol) gels for use as tissue phantoms in photoacoustic mammography,” Phys. Med. Biol. 48(3), 357–370 (2003). 10.1088/0031-9155/48/3/306 [DOI] [PubMed] [Google Scholar]
- 31.Xia W., Piras D., Heijblom M., Steenbergen W., Van Leeuwen T. G., Manohar S., “Poly (vinyl alcohol) gels as photoacoustic breast phantoms revisited,” J. Biomed. Opt. 16(7), 075002 (2011). 10.1117/1.3597616 [DOI] [PubMed] [Google Scholar]
- 32.Zell K., Sperl J., Vogel M., Niessner R., Haisch C., “Acoustical properties of selected tissue phantom materials for ultrasound imaging,” Phys. Med. Biol. 52(20), N475–N484 (2007). 10.1088/0031-9155/52/20/N02 [DOI] [PubMed] [Google Scholar]
- 33.Fonseca M., Zeqiri B., Beard P., Cox B., “Characterisation of a phantom for multiwavelength quantitative photoacoustic imaging,” Phys. Med. Biol. 61(13), 4950–4973 (2016). 10.1088/0031-9155/61/13/4950 [DOI] [PubMed] [Google Scholar]
- 34.Maneas E., Xia W., Nikitichev D. I., Daher B., Manimaran M., Wong R. Y. J., Chang C.-W., Rahmani B., Capelli C., Schievano S., Burriesci G., Ourselin S., David A. L., Finlay M. C., West S. J., Vercauteren T., Desjardins A. E., “Anatomically realistic ultrasound phantoms using gel wax with 3d printed moulds,” Phys. Med. Biol. 63(1), 015033 (2018). 10.1088/1361-6560/aa9e2c [DOI] [PMC free article] [PubMed] [Google Scholar]
- 35.Maneas E., Xia W., Ogunlade O., Fonseca M., Nikitichev D. I., David A. L., West S. J., Ourselin S., Hebden J. C., Vercauteren T., Desjardins A. E., “Gel wax-based tissue-mimicking phantoms for multispectral photoacoustic imaging,” Biomed. Opt. Express 9(3), 1151–1163 (2018). 10.1364/BOE.9.001151 [DOI] [PMC free article] [PubMed] [Google Scholar]
- 36.Oudry J., Bastard C., Miette V., Willinger R., Sandrin L., “Copolymer-in-oil phantom materials for elastography,” Ultrasound Medicine & Biol. 35(7), 1185–1197 (2009). 10.1016/j.ultrasmedbio.2009.01.012 [DOI] [PubMed] [Google Scholar]
- 37.Spirou G. M., Oraevsky A. A., Vitkin I. A., Whelan W. M., “Optical and acoustic properties at 1064 nm of polyvinyl chloride-plastisol for use as a tissue phantom in biomedical optoacoustics,” Phys. Med. Biol. 50(14), N141–N153 (2005). 10.1088/0031-9155/50/14/N01 [DOI] [PubMed] [Google Scholar]
- 38.Vogt W. C., Jia C., Wear K. A., Garra B. S., Pfefer T. J., “Biologically relevant photoacoustic imaging phantoms with tunable optical and acoustic properties,” J. Biomed. Opt. 21(10), 101405 (2016). 10.1117/1.JBO.21.10.101405 [DOI] [PMC free article] [PubMed] [Google Scholar]
- 39.Hungr N., Long J.-A., Beix V., Troccaz J., “A realistic deformable prostate phantom for multimodal imaging and needle-insertion procedures,” Med. Phys. 39(4), 2031–2041 (2012). 10.1118/1.3692179 [DOI] [PubMed] [Google Scholar]
- 40.Carton A., Bakic P., Ullberg C., Derand H., Maidment A. D., “Development of a physical 3d anthropomorphic breast phantom,” Med. Phys. 38(2), 891–896 (2011). 10.1118/1.3533896 [DOI] [PMC free article] [PubMed] [Google Scholar]
- 41.Rossman A. H., Catenacci M., Zhao C., Sikaria D., Knudsen J. E., Dawes D., Gehm M. E., Samei E., Wiley B. J., Lo J. Y., “Three-dimensionally-printed anthropomorphic physical phantom for mammography and digital breast tomosynthesis with custom materials, lesions, and uniform quality control region,” J. Med. Imaging 6(2), 021604 (2019). 10.1117/1.JMI.6.2.021604 [DOI] [PMC free article] [PubMed] [Google Scholar]
- 42.Liu Y., Ghassemi P., Depkon A., Iacono M. I., Lin J., Mendoza G., Wang J., Tang Q., Chen Y., Pfefer T. J., “Biomimetic 3d-printed neurovascular phantoms for near-infrared fluorescence imaging,” Biomed. Opt. Express 9(6), 2810–2824 (2018). 10.1364/BOE.9.002810 [DOI] [PMC free article] [PubMed] [Google Scholar]
- 43.Mackle E. C., Maneas E., Little C., Carr E., Xia W., Nikitichev D., Rakhit R. D., Finlay M. C., Desjardins A. E., “Wall-less vascular poly (vinyl) alcohol gel ultrasound imaging phantoms using 3d printed vessels,” in Design and Quality for Biomedical Technologies XII, vol. 10870 (International Society for Optics and Photonics, 2019), p. 108700P. [Google Scholar]
- 44.Dantuma M., van Dommelen R. C., Manohar S., “A 3d semi-anthropomorphic photoacoustic breast phantom,” in Photons Plus Ultrasound: Imaging and Sensing 2019, vol. 10878 (International Society for Optics and Photonics, 2019), p. 108781P. [DOI] [PMC free article] [PubMed] [Google Scholar]
- 45.Harris J. R., Lippman M. E., Osborne C. K., Morrow M., Diseases of the Breast (Lippincott Williams & Wilkins, 2012). [Google Scholar]
- 46.Pope J. T. L., Read M. E., Medsker T., Buschi A. J., Brenbridge A., “Breast skin thickness: normal range and causes of thickening shown on film-screen mammography,” J. Can. Assoc. Radiol. 35, 365–368 (1984). [PubMed] [Google Scholar]
- 47.Bontrager K. L., Lampignano J., Textbook of Radiographic Positioning and Related Anatomy-e-Book (Elsevier Health Sciences, 2013). [Google Scholar]
- 48.Lou Y., Zhou W., Matthews T. P., Appleton C. M., Anastasio M. A., “Generation of anatomically realistic numerical phantoms for photoacoustic and ultrasonic breast imaging,” J. Biomed. Opt. 22(4), 041015 (2017). 10.1117/1.JBO.22.4.041015 [DOI] [PMC free article] [PubMed] [Google Scholar]
- 49.Dantuma M., “Three-dimensional model for the breast contour mould,” figshare (2019). [retrieved 27 September 2019] 10.6084/m9.figshare.9911747. [DOI]
- 50.Dantuma M., “Three-dimensional model for the fibroglandular-fat interface mould,” figshare (2019). [retrieved 27 September 2019] 10.6084/m9.figshare.9911750. [DOI]
- 51.Dantuma M., “Three-dimensional blood vessel model,” figshare (2019). [retrieved 27 September 2019] 10.6084/m9.figshare.9911753. [DOI]
- 52.Dantuma M., “Top part of a three-dimensional tumor mould model,” figshare (2019). [retrieved 27 September 2019] 10.6084/m9.figshare.9911756. [DOI]
- 53.Dantuma M., “Bottom part of a three-dimensional tumor mould model,” figshare (2019). [retrieved 27 September 2019] 10.6084/m9.figshare.9911759. [DOI]
- 54.Xia W., Piras D., van Hespen J. C., Steenbergen W., Manohar S., “A new acoustic lens material for large area detectors in photoacoustic breast tomography,” Photoacoustics 1(2), 9–18 (2013). 10.1016/j.pacs.2013.05.001 [DOI] [PMC free article] [PubMed] [Google Scholar]
- 55.Dantuma M., “Three-dimensional model of an acoustic characterization block mould,” figshare (2019). [retrieved 27 September 2019] 10.6084/m9.figshare.9911762. [DOI]
- 56.Dantuma M., “Three-dimensional model of an acoustic characterization block holder,” figshare (2019). [retrieved 27 September 2019] 10.6084/m9.figshare.9911765. [DOI]
- 57.Szabo T. L., in Diagnostic Ultrasound Imaging: Inside Out (Academic Press, 2004), pp. 785–786. [Google Scholar]
- 58.Prahl S., “Optical property measurements using the inverse adding-doubling program,” Oregon Medical Laser Center, St. Vincent Hospital 9205 (1999). [Google Scholar]
- 59.Sato Y., Shiraga N., Nakajima S., Tamura S., Kikinis R., “Local maximum intensity projection (lmip): A new rendering method for vascular visualization,” J. Comput. Assist. Tomogr. 22(6), 912–917 (1998). [DOI] [PubMed] [Google Scholar]
- 60.Edmonds P., Mortensen C., Hill J., Holland S., Jensen J., Schattner P., Valdes A., Lee R., Marzoni F., “Ultrasound tissue characterization of breast biopsy specimens,” Ultrason. Imaging 13(2), 162–185 (1991). 10.1177/016173469101300204 [DOI] [PubMed] [Google Scholar]
- 61.d’Astous F. T., Foster F. S., “Frequency dependence of ultrasound attenuation and backscatter in breast tissue,” Ultrasound Medicine & Biol. 12(10), 795–808 (1986). 10.1016/0301-5629(86)90077-3 [DOI] [PubMed] [Google Scholar]
- 62.Landini L., Sarnelli R., “Evaluation of the attenuation coefficients in normal and pathological breast tissue,” Med. Biol. Eng. Comput. 24(3), 243–247 (1986). 10.1007/BF02441619 [DOI] [PubMed] [Google Scholar]
- 63.Duck F. A., Physical Properties of Tissues: A Comprehensive Reference Book (Academic press, 2013). [Google Scholar]
- 64.Yongchen S., Yanwu D., Jie T., Zhensheng T., “Ultrasonic propagation parameters in human tissues,” in IEEE 1986 Ultrasonics Symposium (IEEE, 1986), pp. 905–908. [Google Scholar]
- 65.Greenleaf J. F., Bahn R. C., “Clinical imaging with transmissive ultrasonic computerized tomography,” IEEE Trans. Biomed. Eng. BME-28(2), 177–185 (1981). 10.1109/TBME.1981.324789 [DOI] [PubMed] [Google Scholar]
- 66.Li C., Duric N., Littrup P., Huang L., “In vivo breast sound-speed imaging with ultrasound tomography,” Ultrasound Medicine & Biol. 35(10), 1615–1628 (2009). 10.1016/j.ultrasmedbio.2009.05.011 [DOI] [PMC free article] [PubMed] [Google Scholar]
- 67.Nasief H. G., Rosado-Mendez I. M., Zagzebski J. A., Hall T. J., “Acoustic properties of breast fat,” J. Ultrasound Medicine 34(11), 2007–2016 (2015). 10.7863/ultra.14.07039 [DOI] [PMC free article] [PubMed] [Google Scholar]
- 68.Rajagopalan B., Greenleaf J., Thomas P., Johnson S., Bahn R., “Variation of acoustic speed with temperature in various excised human tissues studied by ultrasound computerized tomography,” Ultrasonic tissue characterization II 525, 227–233 (1979). [Google Scholar]
- 69.Scherzinger A. L., Belgam R. A., Carson P. L., Meyer C. R., Sutherland J. V., Bookstein F. L., Silver T. M., “Assessment of ultrasonic computed tomography in symptomatic breast patients by discriminant analysis,” Ultrasound in Medicine & Biology 15(1), 21–28 (1989). 10.1016/0301-5629(89)90128-2 [DOI] [PubMed] [Google Scholar]
- 70.Wiskin J., Borup D., Johnson S., Berggren M., “Non-linear inverse scattering: High resolution quantitative breast tissue tomography,” J. Acoust. Soc. Am. 131(5), 3802–3813 (2012). 10.1121/1.3699240 [DOI] [PMC free article] [PubMed] [Google Scholar]
- 71.Azhari H., Basics of Biomedical Ultrasound for Engineers (John Wiley & Sons, 2010). [Google Scholar]
- 72.Shung K. K., Diagnostic Ultrasound: Imaging and Blood Flow Measurements (CRC press, 2015). [Google Scholar]
- 73.Jacques S. L., “Coupling 3D Monte Carlo light transport in optically heterogeneous tissues to photoacoustic signal generation,” Photoacoustics 2(4), 137–142 (2014). 10.1016/j.pacs.2014.09.001 [DOI] [PMC free article] [PubMed] [Google Scholar]
- 74.Bashkatov A. N., Genina E. A., Tuchin V. V., “Optical properties of skin, subcutaneous, and muscle tissues: a review,” J. Innovative Opt. Health Sci. 04(01), 9–38 (2011). 10.1142/S1793545811001319 [DOI] [Google Scholar]
- 75.Brooksby B., Jiang S., Dehghani H., Pogue B. W., Paulsen K. D., Kogel C., Doyley M., Weaver J. B., Poplack S. P., “Magnetic resonance-guided near-infrared tomography of the breast,” Rev. Sci. Instrum. 75(12), 5262–5270 (2004). 10.1063/1.1819634 [DOI] [Google Scholar]
- 76.Troy T. L., Page D. L., Sevick-Muraca E. M., “Optical properties of normal and diseased breast tissues: prognosis for optical mammography,” J. Biomed. Opt. 1(3), 342–356 (1996). 10.1117/12.239905 [DOI] [PubMed] [Google Scholar]
- 77.Peters V. G., Wyman D., Patterson M., Frank G., “Optical properties of normal and diseased human breast tissues in the visible and near infrared,” Phys. Med. Biol. 35(9), 1317–1334 (1990). 10.1088/0031-9155/35/9/010 [DOI] [PubMed] [Google Scholar]
- 78.Taroni P., Quarto G., Pifferi A., Abbate F., Balestreri N., Menna S., Cassano E., Cubeddu R., “Breast tissue composition and its dependence on demographic risk factors for breast cancer: non-invasive assessment by time domain diffuse optical spectroscopy,” PLoS One 10(6), e0128941 (2015). 10.1371/journal.pone.0128941 [DOI] [PMC free article] [PubMed] [Google Scholar]
- 79.Schoustra S. M., Huijink R., Alink L., op’t Root T. J., Sprünken D., Piras D., Kobold W. F. M., Klazen C. A., van der Schaaf M. C., van den Engh F. M., Steenbergen W., Manohar S., “The Twente Photoacoustic Mammoscope 2: 3D vascular network visualization,” in Photons Plus Ultrasound: Imaging and Sensing 2019, vol. 10878 (International Society for Optics and Photonics, 2019), p.1087813. [Google Scholar]


