Abstract
Fluorescence lifetime imaging microscopy (FLIM) is a powerful imaging tool used to study the molecular environment of flurophores. In time domain FLIM, extracting lifetime from fluorophores signals entails fitting data to a decaying exponential distribution function. However, most existing techniques for this purpose need large amounts of photons at each pixel and a long computation time, thus making it difficult to obtain reliable inference in applications requiring either short acquisition or minimal computation time. In this work, we introduce a new nonparametric empirical Bayesian framework for FLIM data analysis (NEB-FLIM), leading to both improved pixel-wise lifetime estimation and a more robust and computationally efficient integral property inference. This framework is developed based on a newly proposed hierarchical statistical model for FLIM data and adopts a novel nonparametric maximum likelihood estimator to estimate the prior distribution. To demonstrate the merit of the proposed framework, we applied it on both simulated and real biological datasets and compared it with previous classical methods on these datasets.
1. Introduction
Fluorescence lifetime imaging microscopy (FLIM) is a widely used technique to reveal the changes in fluorophores’ local environments by measuring fluorophores’ lifetime [1,2]. The application of FLIM includes, but is not limited to, measuring local environmental parameters within cells such as pH or oxygenation state, studying protein interactions by quantifying Förster resonance energy transfer (FRET), and investigating the metabolic state of cells [2]. In particular, due to noninvasiveness and high-resolution, FLIM has been used to monitor the dynamic change in metabolic state of living cells by measuring lifetime of auto-fluorescent properties of reduced nicotinamide adenine dinucleotide (NADH) and flavin adenine dinucleotide (FAD) in cancer research [2–4].
To investigate and compare different types of cells/tissues, the typical analysis workflow for FLIM data follows a two-step procedure [3–5]: 1) pixel-wise lifetime recovery at each pixel: the lifetime of each component and component contribution are extracted from fluorescence signal by fitting data to a single/double decaying exponential distribution function [6–9]; 2) integral property inference: one or several summary statistics of each sample are calculated from all pixel-wise estimations of the previous step, e.g. the mean or standard deviation of lifetime or component contribution. The pixel-wise fitted lifetime and these summary statistics are then used to investigate the spatial change within each sample and the difference across groups of samples, respectively.
To infer pixel-wise lifetime, numerous exponential curve fitting approaches have been proposed [6–18]. Due to easy implementation, pixel-wise analysis has been arguably the most widely used strategy for pixel-wise lifetime recovery, including least-squares fitting and maximum likelihood estimation (MLE) approaches [8–10]. One main obstacle for pixel-wise analysis is that it requires a large number of photons per pixel [19], resulting in long photon collection time, usually more than tens of seconds for the whole image. This time requirement for photon collection prohibits FLIM to be used for acquisition at higher speeds [20]. Despite the recent improvement in fast detector [21], one of the most commonly used computation strategies to alleviate this issue is global analysis, which estimates global fluorescence lifetime by using photons across all pixels and then calculates pixel-wise component contribution [7,12,13]. Although global analysis might provide more robust estimation in low-photon regime, it brings irreversible bias for pixel-wise lifetime estimation due to neglect of spatial change in fluorescence lifetime. Therefore, there is a need for more robust pixel-wise lifetime fitting algorithms that work for low-photon regimes.
On the other hand, the goal of integral property inference in the classical workflow is different from pixel-wise lifetime recovery because only summary information is needed in this step. As described above, the most common way is direct calculation from pixel-wise recovered lifetime. However, this way requires reliable estimation of pixel-wise lifetime, which usually needs many photons at each pixel as we previously discussed. Moreover, it usually takes long computation time, which brings difficulty to analysis in real time monitoring [4] and large scale experiments, especially when there are thousands of datasets to compare in high-throughput screenings [7,22]. The main difficulty lies in the pixel-wise fitting step, as pixel-wise lifetime recovery needs a large number of photons per pixel and thousands of iterative instrumental response function deconvolutions. Therefore, a natural question arises: can we just conduct integral property inference directly and bypass the pixel-wise lifetime recovery step? In this paper, we show this is feasible.
Motivated by these two needs, we introduce a new Nonparametric Empirical Bayesian framework for analyzing FLIM data, referred as NEB-FLIM, to improve both pixel-wise lifetime recovery and integral property inference in the classical workflow. Specifically, we introduce a hierarchical statistical model for FLIM data by assuming that the fluorescence lifetime at each pixel is drawn from some prior distribution. Under this hierarchical model, NEB-FLIM first adopts a non-parametric maximum likelihood estimator (NPMLE) to estimate the prior distribution by using all photons of the image. This estimated prior distribution is then incorporated into subsequent bayesian analysis for pixel-wise lifetime recovery. Through this, NEB-FLIM provides a more accurate and pixel-dependent estimation of fluorescence lifetime. NEB-FLIM uses a plugin estimator of previously estimated prior distribution to conduct integral property inference directly, instead of summarizing from pixel-wise recovered lifetime. In doing so, summary statistics can be computed in a much more computationally efficient and more robust fashion. Thus, it allows its use in applications when low acquisition or computation time is required.
2. Methods
In this section, we introduce a hierarchical statistical model for FLIM data in Section 2.1, the nonparametrical estimator of prior distribution in Section 2.2, the pixel-wise bayesian estimator in Section 2.3, and the method for integral property inference in Section 2.4.
2.1. Statistical model for photon-counting FLIM data
In this section, we introduce a statistical model for photon-counting time-domain FLIM data, which is collected by a time-correlated single photon counting system (TCSPC) [1,2]. The form of this statistical model is different from commonly-used physical exponential decay models for fluorophores [1,2], but they are equivalent in terms of data analysis. We adopt this model because it is more convenient for statistical analysis. In the end of this section, we compare these two equivalent models and point out their connections.
In light of fluorophores’ properties [1,2], the decay of the fluorescence intensity follows an exponential decay law , where is fluorescence intensity at time , is fluorescence intensity at time , and is defined as lifetime of fluorescence, the main parameter of interest in this article. Thus, our statistical model assumes each photon emitted by fluorophores obeys the following exponential distribution when . To measure by TCSPC, a pulsed laser is used to excite the sample repeatedly with time period , and only the first photon within every period is recorded. Thus, if the photons emitted from previous periods are taken into account, the probability distribution can be expressed as
Due to instrumental responding delay and dispersion of the laser, we need to consider the extra error brought on by the instruments themselves, i.e the distribution of observed fluorescence lifetime is expressed as the circular convolution form , when , where can be seen as a periodic function with period , and is instrumental response function (IRF), which can be assumed known in advance or estimated accurately in separate experiment. Besides the error brought by IRF, another corruption comes from the background light. Suppose the ratio of background photons is , then the distribution function of arriving photon times can be written as
| (1) |
The design of the TCSPC technique only allows us to know a rough interval of each arriving photon. More specifically, suppose the detection range is divided into bins equally , . When the fluorescence lifetime is , the probability of a photon arriving at bin is
| (2) |
Write as the probability of mono-exponential model defined in (2) when fluorescence lifetime is . The observational data read from TCSPC are the numbers of photons in each bin, , , which can be assumed to be drawn from multinomial distribution . The goal of fluorescence lifetime analysis is to estimate based on histogram .
In the above statistical model, we focus on the situation where all fluorescence distribution have the same lifetime, i.e. mono-exponential component model. In a lot of applications, the fluorescence distribution shows the status of the fluorophore, its confirmations and interactions with its local micro-environment [2]. For example, NADH has different fluorescence lifetime when it is bound and unbound to proteins [23]. In such situations, the decay of the fluorescence intensity follows a double exponential decay law , where is the fraction of the th component, also called component contribution, such that and is lifetime of the th component. For convenience of statistical analysis, our statistical model assumes each photon follows a mixture of exponential distributions, i.e.
This representation is a bit different from multiple exponential decay law, and we have different interpretations for and and . To distinguish them, we call the statistical component contribution and and the physical component contribution. This representation is actually equivalent to multiple exponential decay law, so estimation of and estimation of and can naturally lead to one another. In most of this article, we adopt the mixture model representation (i.e. adopting ) for convenience of statistical analysis and discuss how the estimation of can be transformed to the estimation of and in later sections.
Following the same conduction in setting of a single type of fluorescence, the distribution function of arriving photon times is thus a mixture distribution , where has the same form of distribution in Eq. (1). Besides , the contribution of each component is of more interest in many applications. Hence, the lifetime analysis of double exponential components model aims to recover and from observations , which is drawn from .
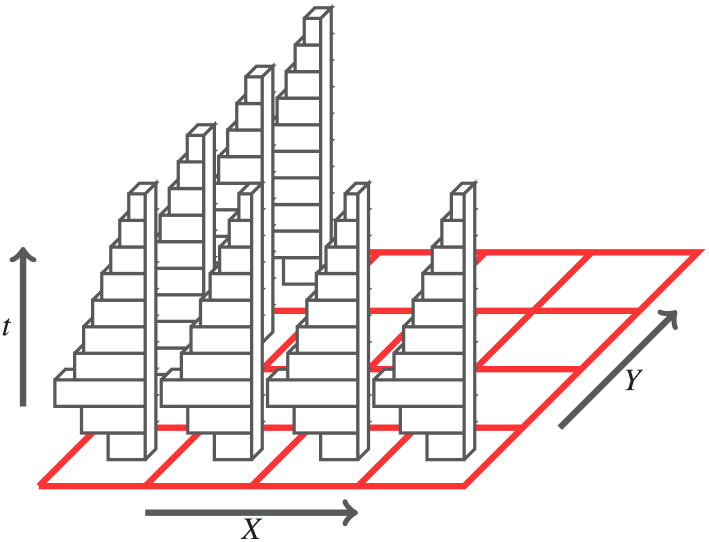
To reflect the spatial trend of fluorescence lifetime, the arrival time of photons are recorded at each pixel through microscopy scanning techniques. More specifically, the observed data at each pixel is a histogram of photon counts , and the goal is to study the pixel-wise fluorescence lifetime and pixel-wise statistical component contribution of each pixel from the pixel-wise observations s. In other words, the FLIM data can be seen generated from thousands of parallel double exponential models. Figure 1 illustrates the data structure of fluorescence-lifetime imaging microscopy (FLIM). In order to analyze data from all pixels jointly, we further assume and are independently drawn from two prior distributions: and . The prior distribution and can be also seen as empirical distribution of
where is delta function at , and is the number of pixels in FLIM image. By the definition of prior distributions, the FLIM data can be seen generated from the following hierarchical model
where is the number of photons observed at pixel . Based on this model, we propose our nonparametric empirical bayesian framework for FLIM data.
Fig. 1.
The data structure of fluorescence-lifetime imaging microscopy photon counting data.
2.2. Estimation of prior distribution
In most traditional bayesian FLIM analysis methods, the prior distribution of lifetime is usually a predetermined distribution, which is either manually input or uninformative prior [14,15,17,18]. These subjective prior distribution leads to unavoidable bias when misspecified. Thus, we opt to estimate prior distributions by maximizing marginal likelihood distribution.
The model of FLIM data defined in Section 2.1 suggests that, if we pool all photons across pixels of images together, these photons can be seen drawn from a single mixture model
| (3) |
Here, represents the th bin from bins, is total number of photons of all pixel of the FLIM image, and can be written as
One main advantage of FLIM is that fluorescence lifetime is not dependent on intensity values, which is defined as the number of photons at each pixel [1,2]. Thus, it is natural to assume the number of photons at each pixel, the statistical component contribution, and lifetime are independent from each other
| (4) |
for any measurable function , , and , and or . With this independence assumption (4), the combined prior distribution can be rewritten as a linear combination of prior distributions and
where . This motivates us to firstly estimate by pooling all photons together and then segment estimated into and .
The model in (3) can be written in its equivalent form
| (5) |
where is the total number of photons in bin across the pixels of image, i.e. . The form in (5) suggests that recovering from count data is a deconvolution problem. To solve this deconvolution problem, we consider nonparametric maximum likelihood estimator (NPMLE), as we do not put any shape or parametric form assumptions for the distribution . NPMLE for mixture model is firstly introduced in [24] and then developed by [25–27] and so on.
To be specific, we assume the support of distribution belongs to some known interval and divide into equal-spaced interval with points . This bounded support assumption is suitable in most applications, as the knowledge of an roughly lifetime is available in advance. With this grid , we can discretize the distribution as a dimension discrete distribution
where . To recover , it is sufficient to recover . After discretization, the likelihood function of marginal distribution of can be written as
where is the probability defined in (2). The maximum likelihood estimator (MLE) is thus defined as a solution of the following convex optimization problem
| (6) |
As suggested in [27], this convex optimization problem can be solved efficiently by modern interior point methods. The estimated prior distribution thus can be written as
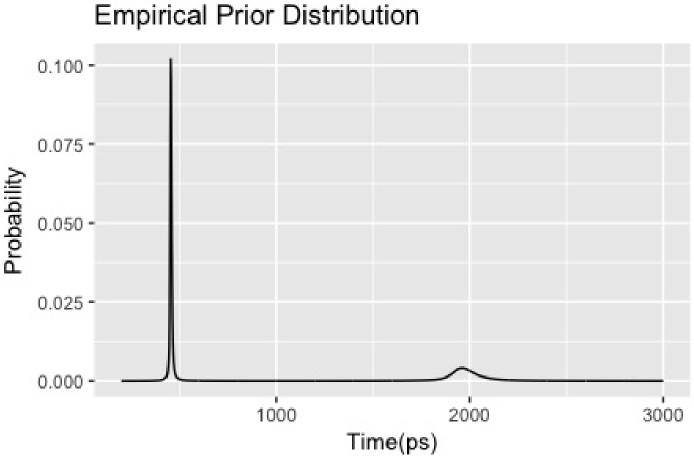
A typical example of prior distribution estimated by the above procedure is shown in Fig. 2.
Fig. 2.
A typical example of empirical prior distribution estimated from data.
After estimating , we now segment this distribution to recover and . Generally, it is impossible to recover and by alone because they are not identifiable if there is overlapping area between them. To address this issue, we appeal to the observation that the two prior distributions can be separated very well in many FLIM applications. For example, the two components of NADH, bound and unbound, have lifetimes of roughly to picosecond(ps) and to ps, respectively [3]. Another example in FRET quantification is NowGFP, an improved version of green fluorescent protein. Its two components, close to and far away from acceptor such as mRuby2 or tdTomato, have lifetimes of roughly to ps and ps [28]. Thus, we shall assume from are identifiable in the following sense
| (7) |
Motivated by this identification assumption (7), we segment by minimizing intra-component variance, equivalently maximizing inter-component variance.
To be specific, the segmentation threshold can be seen as the solution of the below optimization problem
| (8) |
where
Here, is the contribution of the first component, and are the average lifetimes of the first and second component if we choose the segmentation threshold at . With segmentation threshold , the estimated , , and can be defined as
and
Clearly, this segmentation procedure relies on the separation assumption (7). When the distance between two components is larger, the prior distributions and can be separated more easily. Due to the fact that the prior distributions are estimated by pooling all photons together, we could expect very accurate estimations and are therefore able to separate two component in a more accurate way than conventional single-pixel fitting procedure. With , , and , we are in position to conduct pixel-wise lifetime recovery and integral property inference.
2.3. Pixel-wise Bayesian analysis
In this section, we show the pixel-wise lifetime recovery benefits from accurate estimated prior distribution as well. To incorporate the estimated prior distribution, we opt to adopt the empirical bayesian framework [26,29–31] to analyze FLIM photon counting data. Under the hierarchical model defined in Section 2.1, the posterior distribution of can be written as
This posterior distribution can be seen as a mixture of local information (likelihood function) and global information (the prior distribution estimated from data across the pixels). The estimation at each pixel could be expectation or mode of the above posterior distribution. It is also worth noting that the expectation and mode of posterior should be similar because Bernstein-von Mises theorem suggests the posterior distribution converges to normal distribution when sample size at each pixel goes to infinity [32].
Here, we consider the maximum of posterior distribution as our estimator after plugging in the prior distribution we estimated in Section 2.2. To be specific, the maximum of posterior distribution can be obtained by optimizing the following function
| (9) |
To solve the above optimization problem, any optimization algorithm could be employed. In particular, we adopt the expectation-maximization (EM) algorithm [33] to solve the above optimization problem because it can provide a relatively stable estimation. At pixel , a random variable is assigned to indicate which component the th photon comes from, i.e.
where is a random variable indicating into which bin the th photon falls. EM algorithm consists of two main steps: expectation (E-step) and maximization (M-step). In the E-step, the posterior probability of is evaluated given the estimation in the last step
Then, the function in EM algorithm can be written as
In the M-step, we can then maximize , , and in separately
and
These E-step and M-step are repeated until the estimation converges.
One challenge of EM algorithm in practice is the choice of initial values, , , and , as different initial values might lead to different local optimum points. Fortunately, the estimated prior distribution could provide a good guidance for good choices of initial values because the support of and can allow us to narrow the search region down. More specifically, we choose as lower quantile of , as upper quantile of , and as the estimation . When the support of prior distribution lies in a small region, the EM algorithm can be accelerated a lot based on the above choices of initial values. Another challenge of the EM algorithm is slow convergence speed in practice. To accelerate the EM algorithm, we also adopt the acceleration scheme in [34].
2.4. Integral property inference
Different from pixel-wise lifetime recovery, integral property inference aims to estimate/test a functional of pixel-wise parameters. Under the hierarchical model in Section 2.1, a functional of pixel-wise parameters can be written as a functional of prior distribution. Thus, we consider the estimation of linear functional of prior distribution in this section. To be specific, for any given function defined on , the goal is to estimate the following linear functional
| (10) |
Most summarized statistics of interest in FLIM studies can be written in the combination form of linear functional. For example, the mean and variance of lifetime of the th component and can be written as
| (11) |
Another example is the mean of physical contributions of the first and second components
Therefore, we mainly focus on estimation of functional in (10).
To summarize the pixel-wise information, the most commonly used estimator in practice for is plugin estimator of pixel-wise fitted lifetime in the last section
If we write the empirical distribution of as , then the above estimator can be rewritten as . This suggests that is a plugin estimator of empirical distribution of . Motivated by this observation, we consider a plugin estimator of estimated prior distribution in Section 2.2
As we mentioned in the introduction, is a much more accurate and computationally efficient estimator for because NPMLE is more precise and easy to compute. Later, we discuss its performance in more details in Section 3.
To illustrate the idea of NPMLE plug-in estimator, we show the explicit expression of five commonly used summarized statistics: mean of lifetime and , mean of physical contributions and , and mean of average lifetime
By plugging in and , the estimator for these summarized statistics are defined as
and
All above estimators are transformed from prior distribution estimation directly, so they are easy to compute.
2.5. Practical considerations
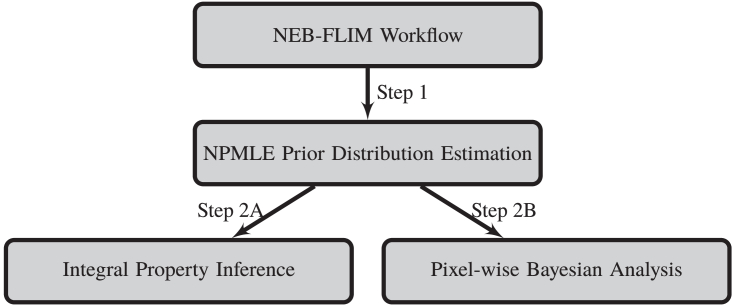
After we combine all components introduced in the previous sections, the new non-parametric empirical bayesian framework for FLIM data (NEB-FLIM) is summarized in Fig. 3. In the step of prior distribution estimation, the core component is the optimization problem in (6). After obtaining data for each bin, the optimization problem in (6) is ready to be solved by ‘REBayes’ R package [35]. To segment the estimated prior distribution, we calculate the object function (8) at each , and take achieving the maximum of them as the cutting threshold .
Fig. 3.
Flow chart of the non-parametric empirical bayesian framework for FLIM data (NEB-FLIM).
After estimating the prior distribution, the estimated prior distribution can be then used to conduct integral property inference or pixel-wise Bayesian analysis. The integral property inference can be completed by common used numerical integration algorithms. For simplicity, we just take as for any function and . Here, is the probability mass of at th bin between and . The pixel-wise Bayesian analysis is implemented by EM algorithm as we described in previous section. We adopt scheme of [34] to accelerate the EM algorithm and stop the iteration when the object function is increased less than (or any small number) in one iteration or number of iteration reaches some maximum number.
In this NEB-FLIM framework, there are mainly three tuning parameters: the lower bound of lifetime , the upper bound of lifetime and the number of intervals . and are chosen according to the specific application. The choice of is very important, as larger usually implies more accurate estimation of prior distribution, but more computation time as well. We discuss the choice of in more details in the later section.
3. Results
We now conduct numerical experiments to demonstrate the merits of our nonparametric empirical bayesian FLIM analysis framework (NEB-FLIM) in this section.
3.1. Simulation
The first simulation experiment we consider here is to assess the performance of prior distribution estimation. To this end, we simulated FLIM images on a square lattice according to the model described in Section 2.1. We assumed the period of laser excitation, , was 10000 ps (or 10 ns), ratio of background photons, , was , and was divided into bins. The IRF we use in this experiment is gaussian distribution function with mean ps and standard deviation ps. At each pixel , we assumed there were two types of fluorescence, and was randomly generated from the following bi-exponential model
The pixel-wise lifetime of both components and the contribution of the first component are shown in Fig. 4. For simplicity, the number of photons at each pixel is assumed to be equal, i.e. .
Fig. 4.
Ground truth of , , and in simulation. All lifetimes in the figures are shown in picosecond(ps).
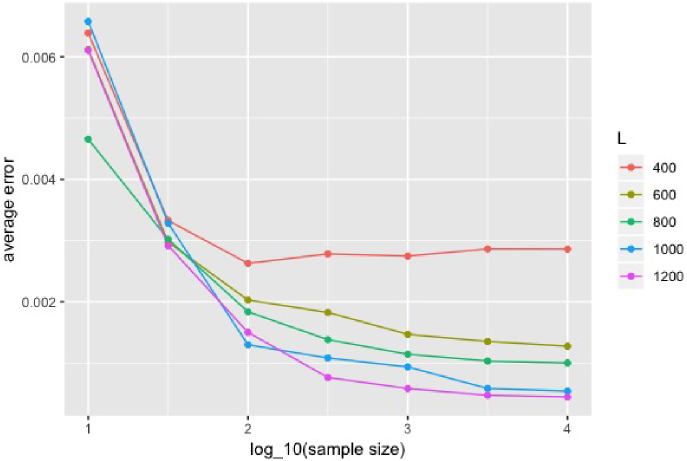
In this simulation experiment, we compare the performance of prior distribution estimation at different numbers of photons per pixel and different numbers of intervals in NPMLE. To assess the performance, we calculate the distance between cumulative distribution of the true prior distribution and our estimator
where
We chose ps and ps in this experiment and assumed they are known. We conducted the experiment when number of photons at each pixel was , , , , , , and and number of intervals in NPMLE was , , , , and . The experiment was repeated times at each combination of and . We summarized the mean error of in 100 experiments in Fig. 5. The Fig. 5 suggests that the prior distribution in general is well estimated, even in a low photon regime, e.g. . Through the results in Fig. 5, we can also conclude that increasing could help reduce the bias when the number of photons is large and small is relatively robust when there are not many photons at each pixel.
Fig. 5.
Performance of lifetime prior distribution estimation at different and : the average error against logarithm of number of photons per pixel . Different colors represent different numbers of intervals .
We designed the next two simulation experiments to compare NEB-FLIM and previous methods. In particular, we mainly focus on two of the most popular methods: pixel-wise analysis and global analysis. As mentioned before, pixel-wise analysis methods fit the exponential curve only by photons at each pixel [8–10]. In this simulation experiment, we only focus on likelihood based pixel-wise analysis, as it has been shown more efficient than other popular pixel-wise analysis methods [9]. The global analysis estimates lifetime of two components globally and then estimates the components’ contribution at each pixel [7,12,13]. The two experiments are designed to compare the performance in terms of pixel-wise lifetime recovery and integral property inference, respectively.
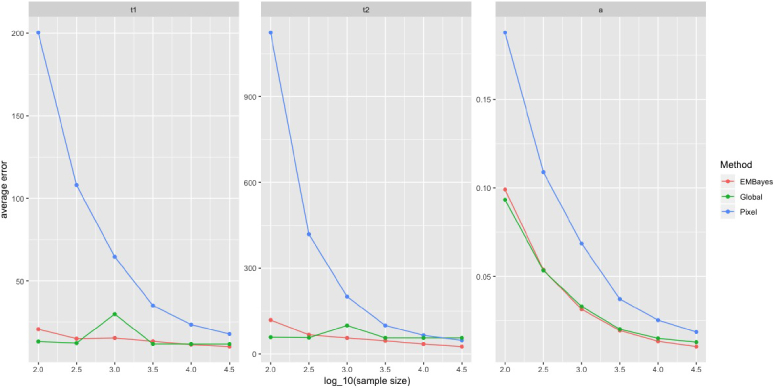
We now compare performance of pixel-wise lifetime recovery. To this end, we still followed the bi-exponential model and chose the same setting with the previous experiment. was chosen at . The performance of each method is assessed by the mean square error
where can be any function of and . In particular, we chose , and in this simulation experiment. We conducted the experiment when the number of photons at each pixel was , and . The results are summarized in Fig. 6. As suggested by Fig. 6, pixel-wise analysis is more reliable than global analysis when there are enough available photons at each pixel, while the latter can provide relatively robust estimations in the low-photon regime. Figure 6 also shows that NEB-FLIM is always able to achieve better performance due to the fact that empirical Bayesian analysis combines both local and global information.
Fig. 6.
Pixel-wise recovery performance comparisons between pixel-wise analysis, global analysis, and NEB-FLIM: the plots are of mean square error across the image against the number of photons per pixel. All results of lifetimes in the figures are shown in . Left is plot of ; middle is plot of and right is plot of .
We design the next experiment to assess performance of integral property inference. To be specific, we compare four different methods to estimate the mean of lifetime and defined in (11). The four methods we would like to compare are: direct integral property inference in NEB-FLIM(PI-NEB), mean of pixel-wise lifetime estimated by NEB-FLIM(PBA-NEB), mean of pixel-wise lifetime estimated by pixel-wise analysis(PA), and mean of pixel-wise lifetime estimated by global analysis(GA). To compare these methods, we follow the same settings of previous experiments, but consider different sample sizes per pixel: , , and . For each , the experiment was repeated 100 times, and for each time, we applied these four methods on the generated FLIM image. We assessed the performance of estimating and by evaluating square root of mean square error
where is total number of simulation experiments and is the estimation at the th simulation experiment. The results are summarized in Table 1. As shown in Table 1, it is clear that direct integral property inference in NEB-FLIM(PI-NEB) has better performance than the other methods.
Table 1. Accuracy comparisons between different integral property inference methods: PI-NEB=direct integral property inference in NEB-FLIM, PBA-NEB=mean of pixel-wise lifetime estimated by NEB-FLIM, PA=mean of pixel-wise lifetime estimated by pixel-wise analysis, and GA=mean of pixel-wise lifetime estimated by global analysis. The error criteria is square root of mean square error for . All results in the table are shown in ps.
|
|
|
|
||||
|---|---|---|---|---|---|---|
| PI-NEB | ||||||
| PBA-NEB | ||||||
| PA | ||||||
| GA | ||||||
In the last experiment, we evaluate different methods for integral property inference from computation efficiency angle. In particular, we followed the same bi-exponential model in previous experiments and simulated image on , and square lattice. The number of photons at each pixel is chosen as . We compare the computation time of 4 different methods to estimate the mean of lifetime and : direct integral property inference in NEB-FLIM with and (NEB-400 and NEB-800), plugin estimator of pixel-wise lifetime estimated by pixel-wise analysis(PA), and plugin estimator of pixel-wise lifetime estimated by global analysis(GA). To make comparison fair, all the algorithms are implemented in R and evaluated in the same desktop (Intel Core i5 @3.4 GHz/16GB). The computing times of all algorithms are reported in Table 2, which is based on 10 runs for each image size. It is clear from Table 2 that direct integral property inference in NEB-FLIM is faster than the other two methods. Moreover, the speed of NEB-FLIM mainly relies on the choice of , but not the image size. It is also worth noting that the computation speed may depend on choice the programming language, computing environment and specific implementation, so all these algorithms might be accelerated under other programming languages or implementation.
Table 2. Computation speed comparisons between different integral property inference methods: NEB-400, NEB-800=direct integral property inference in NEB-FLIM with and 800, PA=plugin estimator of pixel-wise lifetime estimated by pixel-wise analysis, and GA=plugin estimator of pixel-wise lifetime estimated by global analysis. The computation time in the table is shown in seconds.
| Image Size | NEB-400 | NEB-800 | PA | GA |
|---|---|---|---|---|
3.2. Real data example
Finally, we consider a specific biological dataset examining the metabolic state of cancer/normal living cells by measuring lifetime of reduced nicotinamide adenine dinucleotide (NADH). FLIM has been shown to be able to distinguish between free and protein bound state of NADH, as the two states of NADH have different fluorescence lifetimes [3,36]. The first component refers to free NADH, and the second component refers to the protein-bound NADH. Higher contribution of free NADH and hence lower average lifetime value, , has been found to correlate with higher glycolytic metabolism. Apart from NADH lifetime imaging, FLIM can also be used to visualize flavin adenine dinucleotide (FAD) lifetime for early detection of cancer and for other micro-environment measurement of viscosity, pH and others [4].
This FLIM data set includes NADH FLIM data of MDA-MB-231 breast cancer cells and MCF10A normal cells. The excitation source was a Ti:Sapphire laser (Spectra Physics; Maitai) tuned to wavelength of 740 nm. The excitation and emission were coupled through an inverted microscope (Nikon; Eclipse TE300) with a 20x objective (Nikon, Plan Fluor, N.A. 0.75). A 450/70-nm band-pass emission filter (Semrock, Rochester. NY) was also used to selectively collect the NADH fluorescence emission signal. For each type of cell, FLIM images were collected at 256x256 resolution at 4 different durations(, , , and seconds) using SPC-150 Photon Counting Electronics (Becker & Hickl GmbH, Berlin, Germany) and Hamamatsu H7422P-40 GaAsP photomultiplier tube (Hamamatsu Photonics, Bridgewater, NJ). Urea crystals were used to measure the Instrumental Response Function (IRF) with a 370/10 bandpass emission filter (Semrock, Rochester. NY). Emission intensity was checked by the photon counts after each imaging session to make sure there was no photobleaching or photodamage of the sample. For each duration and sample, the average numbers of photons per pixel, , are summarized in Table 3.
Table 3. Summarized information of the biological data set estimated by direct integral property inference of NEB-FLIM: the average number of photons per pixel , the mean of statistical component contribution , mean of lifetime of the first component , mean of lifetime of the second component , mean of physical component contribution (after normalization) , and mean of weighted averaged lifetime All results of lifetime in the table are shown in picosecond.
| Time | ||||||||
|---|---|---|---|---|---|---|---|---|
| MDA-MB-231 | 20s | 32.1 | 0.212 | 324.2 | 2516.7 | 0.683 | 0.317 | 1018.3 |
| 60s | 96.4 | 0.208 | 321.7 | 2506.5 | 0.675 | 0.325 | 1032.4 | |
| 120s | 200.0 | 0.207 | 331.1 | 2514.4 | 0.668 | 0.332 | 1055.2 | |
| 240s | 411.4 | 0.204 | 337.7 | 2526.1 | 0.661 | 0.339 | 1078.6 | |
| MCF10A | 20s | 27.1 | 0.162 | 567.5 | 2627.1 | 0.475 | 0.525 | 1648.8 |
| 60s | 79.0 | 0.168 | 567.4 | 2625.1 | 0.486 | 0.514 | 1625.3 | |
| 120s | 155.7 | 0.158 | 573.4 | 2639.6 | 0.466 | 0.534 | 1676.0 | |
| 240s | 401.6 | 0.155 | 493.1 | 2670.1 | 0.499 | 0.501 | 1583.4 | |
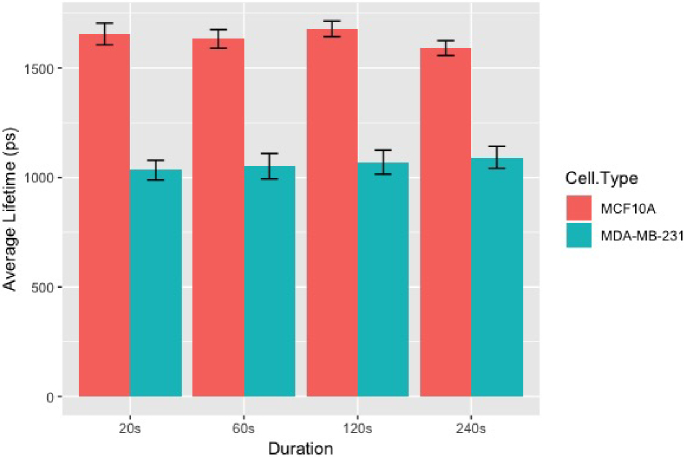
We estimated the prior distribution of lifetime by setting , , and . We applied NEB-FLIM to extract summarized information directly from prior distributions estimated by these 8 FLIM images. In particular, we estimated the mean of statistical component contribution , mean of lifetime of the first component , mean of lifetime of the second component , mean of physical component contribution (after normalization) , and mean of weighted averaged lifetime . All these results are summarized in Table 3. To assess the potential uncertain brought by different field-of-views, we randomly chose regions of size from the original image and applied intergal property inference of NEB-FLIM to estimate mean of weighted averaged lifetime on each chosen region. The estimated weighted averaged lifetime and corresponding standard deviation are reported in Fig. 7, which are based on 100 runs for each combination of duration and cell type. Through Table 3 and Fig. 7, we can conclude that the integral property inference of NEB-FLIM is relatively stable with respect to the imaging time. In other words, NEB-FLIM provides a robust estimation even in low-photon regime. If we compare these two samples, the results suggest cancer cells MDA-MB-231 have a larger mean of physical component contribution and smaller weighted averaged lifetime than normal cell MCF10A cells. This discovery is consistent with results of previous experiments in [4]. The difference between NADH lifetime/cell metabolic state can be easily captured by our new method when the imaging time is 20s (30 photons per pixel). It is also worth noting that the processing time of integral property inference of NEB-FLIM on each image is less than 1 second on a common desktop (Intel Core i5 @3.4 GHz/16GB).
Fig. 7.
Average estimated mean of weighted averaged lifetime with error bar of double standard deviation for each imaging duration and cell type. The plot is summarized from results of intergal property inference of NEB-FLIM on 100 randomly chosen regions.
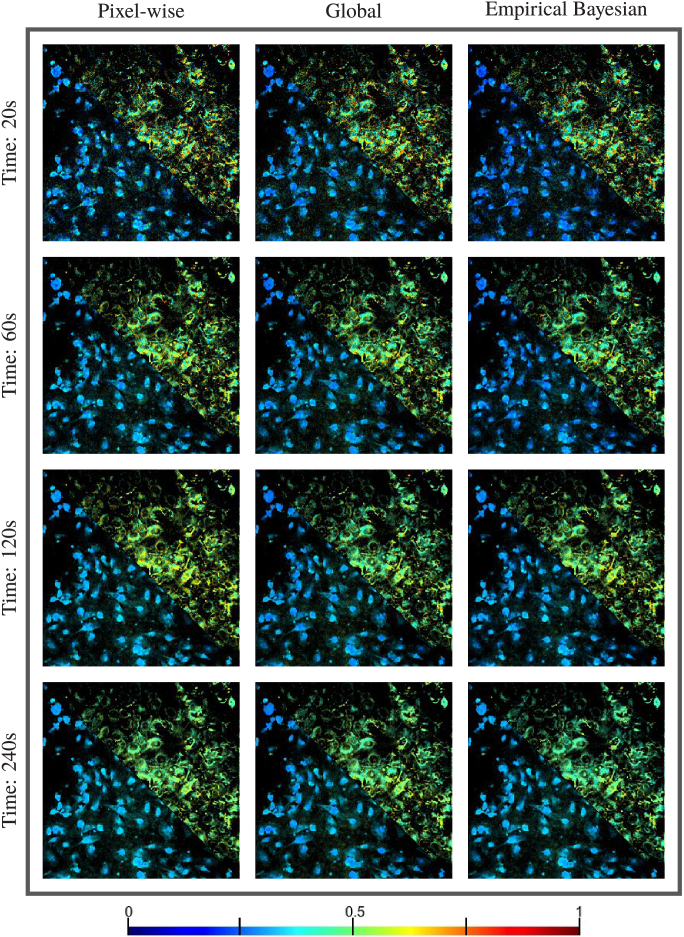
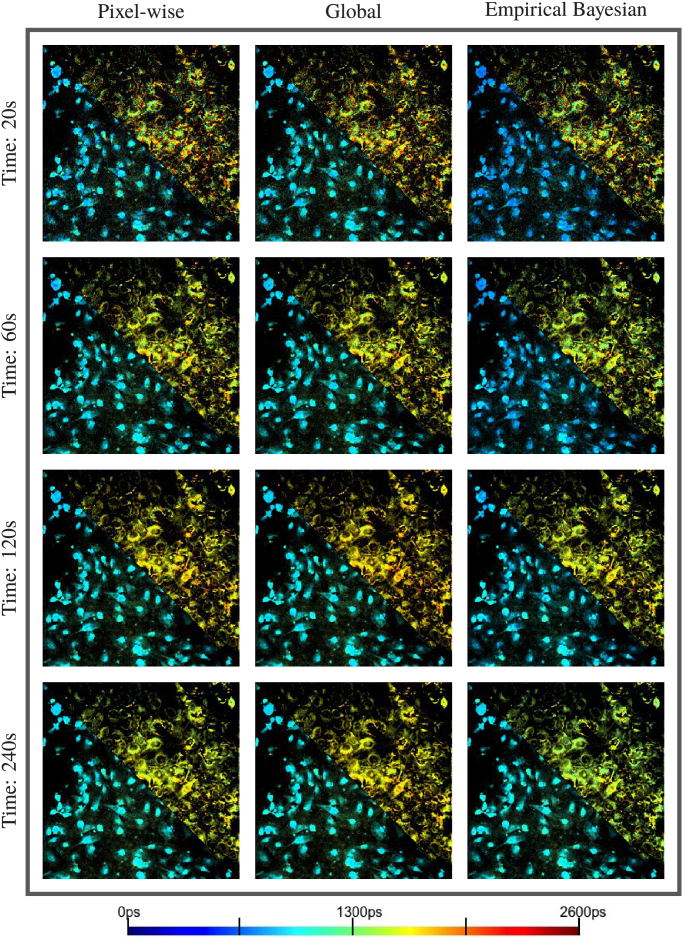
To compare performance of pixel-wise curve fitting, we applied NEB-FLIM, pixel-wise analysis (maximum likelihood estimation based), and global analysis on these 8 FLIM images. In particular, we did binning at each pixel to accumulate more photons. To make the comparisons fair, the initial values of pixel-wise analysis and global analysis were also guided by the prior distribution as NEB-FLIM, although this way might improve the accuracy of pixel-wise analysis and global analysis. Due to space limits, we only showed the physical component contribution and weighted average lifetime , which are shown in Fig. 8 and Fig. 9 (top right corresponds to MCF10A cells and bottom left corresponds to MDA-MB-231 cells). To summarize the fitting result of estimated lifetime, we also made density plot of pixel-wise estimated lifetime of MCF10A Cell in Fig. 10. Through Fig. 8, Fig. 9 and Fig. 10, our proposed NEB-FLIM framework behaves almost the same with pixel-wise analysis when the number of photons is large (imaging time 240s). Furthermore, if we regard the result of imaging time 240s as a benchmark, we could see that the performance of our NEB-FLIM framework is better than the other two methods when the imaging time is short (e.g. 60s).
Fig. 8.
Comparisons of pixel-wise recovery result by pixel analysis, global analysis, and empirical bayesian analysis on real datasets: pixel-wise physical component contribution . Top right is MCF10A cells and bottom left is MDA-MB-231 cells. The imaging time from top to bottom is 20s, 60s, 120s and 240s.
Fig. 9.
Comparisons of pixel-wise recovery result by pixel analysis, global analysis, and empirical bayesian analysis on real dataset: pixel-wise weighted average lifetime in ps. Top right is MCF10A cells and bottom left is MDA-MB-231 cells. The imaging time from top to bottom is 20s, 60s, 120s and 240s.
Fig. 10.
Density plot of estimated weighted averaged lifetime of MCF10A cell for different pixel-wise lifetime recovery methods and imaging time: NEB=pixel-wise lifetime estimated by NEB-FLIM, PA=pixel-wise lifetime estimated by pixel-wise analysis, and GA=pixel-wise lifetime estimated by global analysis.
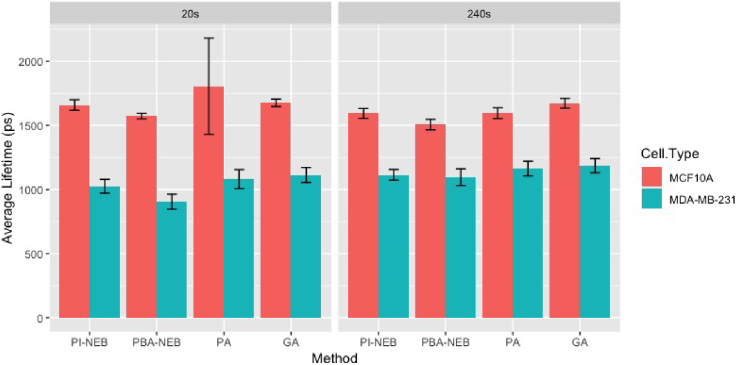
Finally, we compare the results of property inference (just as in the third simulation experiment). The lifetimes of images with imaging time 20s and 240s are summarized in Table 4. We followed the same procedure in Fig. 7 to evaluate the potential uncertain arose from choices of field-of-views, which is summarized in Fig. 11. It is clear that all methods can detect the difference of NADH lifetime between two types of cells. However, if we regard the recovery results of pixel-wise analysis (PA) when the imaging time is 240s as the benchmark, the performance of PI-NEB is better than the other methods when the imaging time is 20s (see e.g. MCF10A cell), especially better than pixel-wise analysis, the most popular method. This suggests that NEB-FLIM proposed in this article is able to recover more accurately summarized information and tell subtle differences between cells in both high and low photon regimes.
Table 4. Comparisons between different property inference methods on real data: PI-NEB=direct integral property inference in NEB-FLIM, PBA-NEB=mean of pixel-wise lifetime estimated by NEB-FLIM, PA=mean of pixel-wise lifetime estimated by pixel-wise analysis, and GA=mean of pixel-wise lifetime estimated by global analysis. All results of lifetime in the table are shown in picosecond.
| Method | |||||||
|---|---|---|---|---|---|---|---|
| MDA-MB-231, 20s | PI-NEB | 0.212 | 324.2 | 2516.7 | 0.683 | 0.317 | 1018.3 |
| PBA-NEB | 0.142 | 187.4 | 2492.7 | 0.688 | 0.312 | 907.5 | |
| PA | 0.197 | 326.6 | 2585.3 | 0.666 | 0.334 | 1081.5 | |
| GA | 0.196 | 312.6 | 2534.6 | 0.639 | 0.361 | 1115.4 | |
| MDA-MB-231, 240s | PI-NEB | 0.204 | 337.7 | 2526.1 | 0.661 | 0.339 | 1078.6 |
| PBA-NEB | 0.170 | 274.2 | 2517.9 | 0.648 | 0.352 | 1064.9 | |
| PA | 0.183 | 322.3 | 2551.5 | 0.636 | 0.364 | 1132.9 | |
| GA | 0.185 | 329.5 | 2547 | 0.628 | 0.372 | 1154.8 | |
| MCF10A, 20s | PI-NEB | 0.162 | 567.5 | 2627.1 | 0.475 | 0.525 | 1648.8 |
| PBA-NEB | 0.121 | 458.7 | 2637.4 | 0.496 | 0.504 | 1556.3 | |
| PA | 0.153 | 589.8 | 2646.5 | 0.391 | 0.609 | 1841.4 | |
| GA | 0.173 | 557.7 | 2629 | 0.466 | 0.534 | 1664.4 | |
| MCF10A, 240s | PI-NEB | 0.155 | 493.1 | 2670.1 | 0.499 | 0.501 | 1583.4 |
| PBA-NEB | 0.138 | 394.6 | 2668.6 | 0.516 | 0.484 | 1495.8 | |
| PA | 0.152 | 485.4 | 2662.1 | 0.495 | 0.505 | 1584.6 | |
| GA | 0.177 | 586.9 | 2718.1 | 0.496 | 0.504 | 1661.9 | |
Fig. 11.
Average estimated mean of weighted averaged lifetime with error bar of standard deviation for different methods, imaging time and cell types. The results are summarized from estimation results of NEB-FLIM on 100 randomly chosen regions for each combination of method, imaging time and cell type.
4. Discussion and conclusion
In this paper, we propose a new empirical bayesian framework for fluorescence lifetime imaging microscopy data (NEB-FLIM). Different from previous analysis workflows, our new NEB-FLIM framework first estimates the prior distribution of lifetime non-parametrically by using all photons across the whole image. This empirical prior distribution can either be used to conduct integral property inference directly or be incorporated into bayesian analysis to fit an exponential curve at each pixel. Through this method, the summarized information can be estimated very accurately and efficiently computationally. This leads to its potential usage in applications of FLIM requiring either short acquisition or computation times, such as when previewing the lifetime status of cells/tissues before formal analysis and real-time fluorescence lifetime tracking. Due to incorporation of this empirical distribution, the pixel-wise lifetime recovered by NEB-FLIM combines both global and local information, allowing more robust quantification of lifetime at each pixel.
In this presented paper, we only focus on NEB-FLIM framework within the context of a pixel-wise double exponential lifetime model. However, NEB-FLIM, as a generalized framework, can be extend to multiple exponential lifetime models at each pixel. If we assume there is a large gap between different components of lifetime, we can still apply NEB-FLIM to estimate prior distributions by replacing the binary segmentation method with some clustering method which segments the prior distribution into multiple pieces.
The key component to estimate the prior distribution in NEB-FLIM framework is the deconvolution problem in (5). In NEB-FLIM, we adopt linear programming to solve it after data collection. On the other hand, when data becomes available in a sequential order, this deconvolution problem is still solvable if we adopt some online learning algorithm. In other words, we can estimate the prior distribution at the same time as data acquisition. The prior distribution estimation and integral property inference can be completed just after data collection.
Acknowledgments
We thank Dr. Ellen T. Arena of the University of Wisconsin-Madison for careful reading of an earlier draft that has led to improved presentation.
Funding
U.S. Department of Energy10.13039/100000015 (DE-SC0019013, Morgridge Institute for Research).
Disclosures
The authors declare that there are no conflicts of interest related to this article.
References
- 1.Becker W., Advanced Time-correlated Single Photon Counting Techniques, vol. 81 (Springer, 2005). [Google Scholar]
- 2.Becker W., Advanced Time-correlated Single Photon Counting Applications, vol. 111 (Springer, 2015). [Google Scholar]
- 3.Bird D. K., Yan L., Vrotsos K. M., Eliceiri K. W., Vaughan E. M., Keely P. J., White J. G., Ramanujam N., “Metabolic mapping of MCF10A human breast cells via multiphoton fluorescence lifetime imaging of the coenzyme NADH,” Cancer Res. 65(19), 8766–8773 (2005). 10.1158/0008-5472.CAN-04-3922 [DOI] [PubMed] [Google Scholar]
- 4.Walsh A. J., Cook R. S., Manning H. C., Hicks D. J., Lafontant A., Arteaga C. L., Skala M. C., “Optical metabolic imaging identifies glycolytic levels, subtypes, and early-treatment response in breast cancer,” Cancer Res. 73(20), 6164–6174 (2013). 10.1158/0008-5472.CAN-13-0527 [DOI] [PMC free article] [PubMed] [Google Scholar]
- 5.Skala M. C., Riching K. M., Bird D. K., Gendron-Fitzpatrick A., Eickhoff J., Eliceiri K. W., Keely P. J., Ramanujam N., “In vivo multiphoton fluorescence lifetime imaging of protein-bound and free nicotinamide adenine dinucleotide in normal and precancerous epithelia,” J. Biomed. Opt. 12(2), 024014 (2007). 10.1117/1.2717503 [DOI] [PMC free article] [PubMed] [Google Scholar]
- 6.Pelet S., Previte M., Laiho L., So P., “A fast global fitting algorithm for fluorescence lifetime imaging microscopy based on image segmentation,” Biophys. J. 87(4), 2807–2817 (2004). 10.1529/biophysj.104.045492 [DOI] [PMC free article] [PubMed] [Google Scholar]
- 7.Warren S. C., Margineanu A., Alibhai D., Kelly D. J., Talbot C., Alexandrov Y., Munro I., Katan M., Dunsby C., French P., “Rapid global fitting of large fluorescence lifetime imaging microscopy datasets,” PLoS One 8(8), e70687 (2013). 10.1371/journal.pone.0070687 [DOI] [PMC free article] [PubMed] [Google Scholar]
- 8.Santra K., Smith E. A., Petrich J. W., Song X., “Photon counting data analysis: Application of the maximum likelihood and related methods for the determination of lifetimes in mixtures of rose bengal and rhodamine b,” J. Phys. Chem. A 121(1), 122–132 (2017). 10.1021/acs.jpca.6b10728 [DOI] [PubMed] [Google Scholar]
- 9.Santra K., Zhan J., Song X., Smith E. A., Vaswani N., Petrich J. W., “What is the best method to fit time-resolved data? a comparison of the residual minimization and the maximum likelihood techniques as applied to experimental time-correlated, single-photon counting data,” J. Phys. Chem. B 120(9), 2484–2490 (2016). 10.1021/acs.jpcb.6b00154 [DOI] [PubMed] [Google Scholar]
- 10.Maus M., Cotlet M., Hofkens J., Gensch T., De Schryver F. C., Schaffer J., Seidel C., “An experimental comparison of the maximum likelihood estimation and nonlinear least-squares fluorescence lifetime analysis of single molecules,” Anal. Chem. 73(9), 2078–2086 (2001). 10.1021/ac000877g [DOI] [PubMed] [Google Scholar]
- 11.Turton D. A., Reid G. D., Beddard G. S., “Accurate analysis of fluorescence decays from single molecules in photon counting experiments,” Anal. Chem. 75(16), 4182–4187 (2003). 10.1021/ac034325k [DOI] [PubMed] [Google Scholar]
- 12.Verveer P. J., Bastiaens P., “Evaluation of global analysis algorithms for single frequency fluorescence lifetime imaging microscopy data,” J. Microsc. 209(1), 1–7 (2003). 10.1046/j.1365-2818.2003.01093.x [DOI] [PubMed] [Google Scholar]
- 13.Barber P. R., Ameer-Beg S. M., Gilbey J. D., Edens R. J., Ezike I., Vojnovic B., “Global and pixel kinetic data analysis for FRET detection by multi-photon time-domain FLIM,” Proc. SPIE 5700, 171–181 (2005). 10.1117/12.590510 [DOI] [Google Scholar]
- 14.Barber P., Ameer-Beg S., Pathmananthan S., Rowley M., Coolen A., “A bayesian method for single molecule, fluorescence burst analysis,” Biomed. Opt. Express 1(4), 1148–1158 (2010). 10.1364/BOE.1.001148 [DOI] [PMC free article] [PubMed] [Google Scholar]
- 15.Rowley M. I., Barber P. R., Coolen A. C., Vojnovic B., “Bayesian analysis of fluorescence lifetime imaging data,” Proc. SPIE 7903, 790325 (2011). 10.1117/12.873890 [DOI] [Google Scholar]
- 16.Kim J., Seok J., Lee H., Lee M., “Penalized maximum likelihood estimation of lifetime and amplitude images from multi-exponentially decaying fluorescence signals,” Opt. Express 21(17), 20240–20253 (2013). 10.1364/OE.21.020240 [DOI] [PubMed] [Google Scholar]
- 17.Rowley M. I., Coolen A., Vojnovic B., Barber P. R., “Robust bayesian fluorescence lifetime estimation, decay model selection and instrument response determination for low-intensity FLIM imaging,” PLoS One 11(6), e0158404 (2016). 10.1371/journal.pone.0158404 [DOI] [PMC free article] [PubMed] [Google Scholar]
- 18.Kaye B., Foster P. J., Yoo T., Needleman D. J., “Developing and testing a bayesian analysis of fluorescence lifetime measurements,” PLoS One 12(1), e0169337 (2017). 10.1371/journal.pone.0169337 [DOI] [PMC free article] [PubMed] [Google Scholar]
- 19.Köllner M., Wolfrum J., “How many photons are necessary for fluorescence-lifetime measurements?” Chem. Phys. Lett. 200(1-2), 199–204 (1992). 10.1016/0009-2614(92)87068-Z [DOI] [Google Scholar]
- 20.Raspe M., Kedziora K. M., van den Broek B., Zhao Q., de Jong S., Herz J., Mastop M., Goedhart J., Gadella T. W., Young I. T., Jalink K., “siFLIM: single-image frequency-domain FLIM provides fast and photon-efficient lifetime data,” Nat. Methods 13(6), 501–504 (2016). 10.1038/nmeth.3836 [DOI] [PubMed] [Google Scholar]
- 21.Krstajić N., Poland S., Levitt J., Walker R., Erdogan A., Ameer-Beg S., Henderson R. K., “0.5 billion events per second time correlated single photon counting using cmos spad arrays,” Opt. Lett. 40(18), 4305–4308 (2015). 10.1364/OL.40.004305 [DOI] [PubMed] [Google Scholar]
- 22.Guzmán C., Oetken-Lindholm C., Abankwa D., “Automated high-throughput fluorescence lifetime imaging microscopy to detect protein–protein interactions,” J. Lab. Autom. 21(2), 238–245 (2016). 10.1177/2211068215606048 [DOI] [PubMed] [Google Scholar]
- 23.Lakowicz J. R., Principles of Fluorescence Spectroscopy (Springer, 2006). [Google Scholar]
- 24.Kiefer J., Wolfowitz J., “Consistency of the maximum likelihood estimator in the presence of infinitely many incidental parameters,” Ann. Math. Stat. 27(4), 887–906 (1956). 10.1214/aoms/1177728066 [DOI] [Google Scholar]
- 25.Lindsay B. G., “The geometry of mixture likelihoods: a general theory,” Ann. Statist. 11(1), 86–94 (1983). 10.1214/aos/1176346059 [DOI] [Google Scholar]
- 26.Jiang W., Zhang C., “General maximum likelihood empirical bayes estimation of normal means,” Ann. Statist. 37(4), 1647–1684 (2009). 10.1214/08-AOS638 [DOI] [Google Scholar]
- 27.Koenker R., Mizera I., “Convex optimization, shape constraints, compound decisions, and empirical bayes rules,” J. Am. Stat. Assoc. 109(506), 674–685 (2014). 10.1080/01621459.2013.869224 [DOI] [Google Scholar]
- 28.Abraham B. G., Sarkisyan K. S., Mishin A. S., Santala V., Tkachenko N. V., Karp M., “Fluorescent protein based fret pairs with improved dynamic range for fluorescence lifetime measurements,” PLoS One 10(8), e0134436 (2015). 10.1371/journal.pone.0134436 [DOI] [PMC free article] [PubMed] [Google Scholar]
- 29.Robinns H., “Asymptotically subminimax solutions of compound decision problems,” in Proceedings of the Second Berkeley Symposium on Mathematical Statistics and Probability, vol. 1950, (1951), pp. 131–148. [Google Scholar]
- 30.Zhang C., “Compound decision theory and empirical bayes methods,” Ann. Statist. 31(2), 379–390 (2003). 10.1214/aos/1051027872 [DOI] [Google Scholar]
- 31.Efron B., “Two modeling strategies for empirical bayes estimation,” Statist. Sci. 29(2), 285–301 (2014). 10.1214/13-STS455 [DOI] [PMC free article] [PubMed] [Google Scholar]
- 32.Kleijn B., Van der Vaart A., “The bernstein-von-mises theorem under misspecification,” Electron. J. Stat. 6, 354–381 (2012). 10.1214/12-EJS675 [DOI] [Google Scholar]
- 33.Dempster A. P., Laird N. M., Rubin D. B., “Maximum likelihood from incomplete data via the EM algorithm,” J. Royal Stat. Soc. Ser. B (methodological) 39(1), 1–22 (1977). 10.1111/j.2517-6161.1977.tb01600.x [DOI] [Google Scholar]
- 34.Varadhan R., Roland C., “Simple and globally convergent methods for accelerating the convergence of any EM algorithm,” Scand. J. Stat. 35(2), 335–353 (2008). 10.1111/j.1467-9469.2007.00585.x [DOI] [Google Scholar]
- 35.Koenker R., Gu J., “Rebayes: an r package for empirical bayes mixture methods,” Tech. Rep., Journal of Statistical Software 82(8), 1–30 (2017). 10.18637/jss.v082.i08 [DOI] [Google Scholar]
- 36.Chacko J. V., Eliceiri K. W., “Autofluorescence lifetime imaging of cellular metabolism: Sensitivity toward cell density, ph, intracellular, and intercellular heterogeneity,” Cytometry, Part A 95(1), 56–69 (2019). 10.1002/cyto.a.23603 [DOI] [PMC free article] [PubMed] [Google Scholar]


