Abstract
Pedicle screw placement accuracy during spinal fixation surgery varies greatly and severe misplacement has been reported in 1-6.5% of screws. Diffuse reflectance (DR) spectroscopy has previously been shown to reliably discriminate between tissues in the human body. We postulate that it could be used to discriminate between cancellous and cortical bone. Therefore, the purpose of this study is to validate DR spectroscopy as a warning system to detect impending pedicle screw breach in a cadaveric surgical setting using typical clinical breach scenarios. DR spectroscopy was incorporated at the tip of an integrated pedicle screw and screw driver used for tissue probing during pedicle screw insertions on six cadavers. Measurements were collected in the wavelength range of 400-1600 nm and each insertion was planned to result in a breach. Measurements were labelled as cancellous, cortical or representing a pre-cortical zone (PCZ) in between, based on information from cone beam computed tomographies at corresponding positions. In addition, DR spectroscopy data was recorded after breach. Four typical pedicle breach types were performed, and a total of 45 pedicle breaches were recorded. For each breach direction, the technology was able to detect the transition of the screw tip from the cancellous bone to the PCZ (P < 0.001), to cortical bone (P < 0.001), and to a subsequent breach (P < 0.001). Using support vector machine (SVM) classification, breach could reliably be detected with a sensitivity of 98.3 % [94.3-100 %] and a specificity of 97.7 % [91.0-100 %]. We conclude that DR spectroscopy reliably identifies the area of transition from cancellous to cortical bone in typical breach scenarios and can warn the surgeon of impending pedicle breach, thereby resulting in safer spinal fixation surgeries.
1. Introduction
Spinal fusion is the standard treatment for a variety of spine-related diseases. With more than 450.000 surgeries annually, it accounts for the highest share of aggregate hospital costs for stays with OR procedures in the US [1]. The procedure is routinely performed using a free-hand technique with or without fluoroscopic guidance. A crucial step involves placing screws in the pedicles of vertebrae to provide fixation points to fuse neighboring vertebrae. The accuracy of pedicle screw placement in published studies varies greatly. Recent reviews and meta-analyses indicate breaches >4 mm in 1-6,5 % of pedicle screws placed using the free-hand technique [2–4]. Misplaced screws may result in complications ranging from inadequate fixation to serious vascular and neurological injury. In turn, this may result in repeat surgery, new complications and extended hospital stay [5].
Improved surgical accuracy could increase patient safety and reduce complications. Several technological aids have been investigated in order to detect an impending pedicle breach. Electrical conductivity has been used in order to allow detection of the cortical bone at the edge of vertebrae [6,7]. It has the drawback that it does not allow for feedback regarding in what direction the cortical bone is detected. Optical technologies have the potential to allow for a directed optical measurement to be performed. Raman spectroscopy, typically based on laser illumination of tissues, has been used to asses bone quality both invasively and transcutaneously [8,9]. However, Raman spectroscopy has yet to be applied surgically, possibly due to acquisition times being one to two orders of magnitude higher than those typically used in other optical methods [10,11].
Diffuse reflectance (DR) spectroscopy is a spectral sensing technique that has been investigated and adapted to discriminate between cancellous and cortical bone through Monte Carlo simulations, but not yet statistically validated in tissues nor in a surgical setting [12]. Using this optical spectroscopy-based technique, tissue is illuminated by sending white light from a broad-spectrum light source through an optical fiber. After hitting the tissue, the light is reflected, scattered, or absorbed. The net effect is a diffuse reflectance pattern, which is collected through a second optical fiber and analyzed for spectral changes [13]. These changes originate from highly specific reflection, scattering, and absorption and scattering characteristics of individual tissue types [14]. Thus, by analyzing the reflected light, different tissue types can be distinguished [15]. It has previously been demonstrated that the estimated fraction of blood, lipids, and collagen as well as specific optical properties such as scattering parameters can be used to discriminate between tissues during breast, liver, esophagus, maxillofacial, and colon surgery as well as needle insertions during lumbar punctures [16–22]. In spinal fixation surgery, DR spectroscopy technology at the tip of a surgical instrument could provide real time feedback to the surgeon regarding the tissue type that the instrument passes through. We postulate that such a smart instrument could warn the surgeon before breaching through the cortical bone, to reduce the number and severity of complications.
In this study, we examine the utility of DR spectroscopy in a surgical setting, while performing pedicle screw placements in human cadavers. The study was designed to illustrate typical pedicle screw breaches and the corresponding DR spectroscopy data to provide a basis for future research, elucidating if the technology can be used to detect clinically relevant breaches in the lateral, medial, inferior and anterior direction. The area where cancellous bone shifts into cortical bone is given special interest, as its recognition could be used to warn the surgeon of impending breach. We define this area as the pre-cortical zone (PCZ). Based on the findings of this study, the technology could be used to design a “smart” and clinically valuable surgical instrument.
2. Materials and methods
2.1. Surgical setup
Surgeries were performed on six human cadavers, 4 females and 2 males with an age range of 53-92 years. The study was conducted in compliance with ethical guidelines for human cadaver studies. All cadavers were donated for scientific research. Informed consent had been signed before death by the donors or after death by relatives, according to local guidelines.
The cadavers were placed in the prone position on an operating table and midline incisions were made along the thoracic and lumbar spine. Soft tissue was dissected with standard surgical technique to gain access to the posterior aspects of the spine, including spinous processes, lamina, facet joints and transverse processes. Pedicle screw paths were planned using an augmented reality surgical navigation (ARSN) system, as previously described in the literature [23]. Accordingly, a cone beam computed tomography (CBCT) acquisition was performed and used for automatic spine segmentation and creation of a 3D-model of the spine [24]. Based on this 3D-model, using the system’s surgical navigation software, pedicle screws were purposefully planned to result in either lateral, inferior, anterior, or medial breach. Subsequently, an integrated pedicle screw and screwdriver equipped with optical fibers at the tip was used to place pedicle screws according to the planned trajectories. DR spectra were recorded systematically throughout the procedure and matching navigation data was recorded for every DR-spectra measurement to provide positional data. CBCT acquisitions were performed at key positions close to, or at, tissue borders to verify exact position of the device. Tissue labelling was later performed based on anatomical position according to the CBCT imaging by a trained physician blinded to the DR-spectral readings.
2.2. Diffuse reflectance spectroscopy system
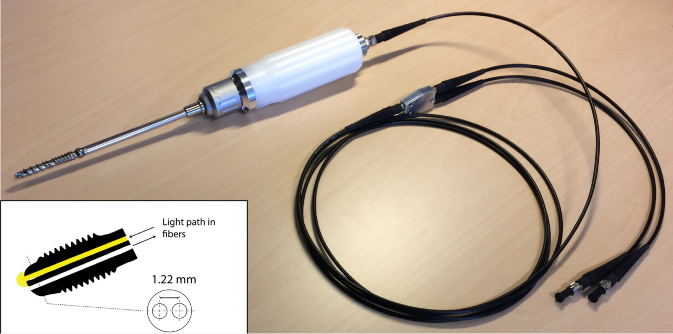
DR spectroscopy measurements were performed using a semi-portable spectroscopic system. The general principles of DR spectroscopy, calibration procedure and instrumentation have been previously described [25]. Tissue was probed using an integrated pedicle screw and screwdriver equipped with two optical fibers at the tip of the screw. The fiber-to-fiber distance between the optical fibers was 1.22 mm (Fig. 1 ). This inter-fiber distance was chosen based on previous studies and is based on a trade-off between wanting to maximize the separation for good DR readings while keeping a mechanical strength needed for bone sampling [12,26]. The tool consists of an inner stylet containing the optical fibers, leading up to the tip of the screw, that allows for turning the tool without twisting the optical fibers. An in-depth description of the tool setup has been published previously [12]. One fiber was connected to a broad-spectrum halogen light source (Avantes AvaLight-Hal-S) to transmit light into the tissue, while the other was used to receive reflected light. To resolve light between 400 and 1600 nm, the receiving fiber was connected to two spectrometers resolving light in the visible (Maya2000 Pro, Ocean Optics) and near-infrared regions (NirQuest 512, Ocean Optics). The acquisition time of each measurement was set to 50-150 ms. An in-house developed LabVIEW software (National Instruments, USA) was used to control the spectrometers and acquire the spectral data.
Fig. 1.
A depiction of the integrated pedicle screw and screwdriver used in the study. Inside, a freely rotating stylet carries two optical fibers running to the tip of the screw, ensuring that the optical fibers do not rotate with the screw and screwdriver. The fiber-to-fiber distance at the tip is 1.22 mm.
2.3. Diffuse reflectance spectral data analysis
Spectral analysis was performed with custom developed software using Matlab (MathWorks Inc., Natick, MA). DR spectra acquired from the pedicle screw insertions were analyzed in the wavelength range of 400 to 1600 nm. A fitting algorithm was used in which the measured spectra could be translated into meaningful physiological or chemical parameters, as has been described previously [18,27,28]. To do this, a light propagation computational model was first used to generate spectra based on chromophore volume fractions and light-scattering [18,28,29]. The fraction of each parameter within the tissues was then estimated by fitting chromophore spectra generated by the computational model to the spectra collected from tissues. The fitting algorithm worked by iteratively minimizing the difference between spectra generated by the computational model and the spectrum acquired from the tissue. The computational model included chromophore simulations of hemoglobin, beta-carotene, methemoglobin, lipids, water, and collagen [16,28]. It also included light-scattering simulations including Mie-to-Rayleigh scattering fraction, Mie scattering slope, and scattering amplitude at a wavelength of 800nm, as has been described previously [27]. As output for the lipid content, a normalized ratio was used; lipid content divided by the sum of total lipid and water content. For collagen volume fraction, a non-normalized reading denoted by arbitrary units (a.u.) was used, as previously described [30]. In our study, the use of hemoglobin and methemoglobin were considered of less value since all insertions were done on cadavers. Thus, these tissue constituents were part of the fitting algorithm to provide a reliable output but were not included in the final data analysis.
2.4. Imaging data analysis
Each pedicle insertion and breach were classified as either an anterior, inferior, medial or lateral pedicle breach. All labelling of tissue type based on anatomical positions was done using CBCT verification scans and carried out by an experienced physician in a blinded fashion, i.e. without knowledge of the corresponding DR-spectral readings. Anatomical regions of interest were defined as cancellous bone, cortical bone, a pre-cortical zone (PCZ), i.e. the zone of transition between the cancellous and cortical bone, and extravertebral tissue, i.e. breach. Based on previous experience, the PCZ was defined as the distance within 3 mm from the cortical bone [12]. Breach was defined as the first 3 mm after breaking through the cortical bone.
2.5. Support vector machine
To investigate the performance of the technology in detecting impending breach using multiple tissue constituents, support vector machine (SVM) classification [31] was used. Before training the SVMs, all features were scaled to a mean of 0 and a standard deviation of 1. For training the SVMs, RStudio (RStudio Team. RStudio: Integrated Development for R. RStudio, Inc., Boston) and the e1071 package (Probability Theory Group, 2019), based on LIBSVM [32], was used with a radial kernel and standard parameters (cost: 1, and gamma: 1/no. of data dimensions). First, a 1:2 ratio split was used to train a model on 66 % of the data. The remaining 33 % was used as validation data to calculate accuracy, sensitivity and specificity for the model based on the confusion matrix of the validation data. Second, a leave-one-specimen-out cross-validation approach was used where the classification models were trained on all but one cadaver, and the validation was performed on the remaining cadaver. Validation was only performed on cadavers with >5 tissue readings in both cancellous and cortical bone, to ensure enough validation data. This approach was repeated until all included cadavers had been left out once, with the confusion matrices being added up. This was to show how the classification algorithms work on truly independent data.
2.6. Statistical analysis
A P-value less than 0.01 was considered significant. Data was normally distributed except DRS readings for collagen in the PCZ and all breached data, both with bimodal distributions on a group level. Given that most tissues on a group level, as well as specific insertion data, were normally distributed, DR spectroscopy readings were reported as means (standard deviations). SVM results were reported as means [min-max]. For analyzing “DRS profiles of typical breaches”, DRS data from single insertions were categorized according to tissue type and a Mann-Whitney-Wilcoxon test was used to evaluate differences between tissues. For analyzing “aggregated data for detecting the cortical border”, DRS data from all insertions were grouped according to tissue type and a Mann-Whitney-Wilcoxon test was used to evaluate differences. Statistical analysis was performed using RStudio (RStudio Team. RStudio: Integrated Development for R. RStudio, Inc., Boston).
3. Results
3.1. DRS profiles of typical breaches
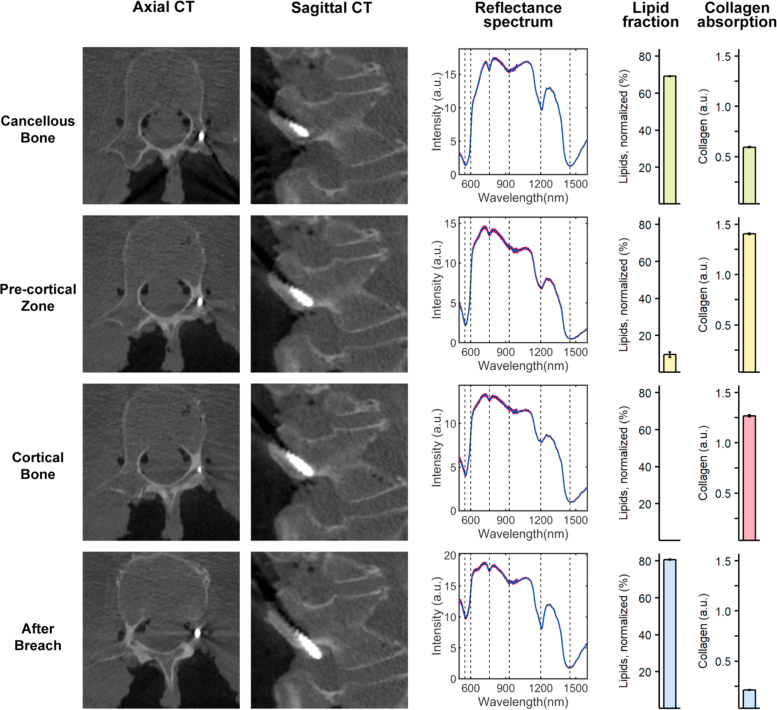
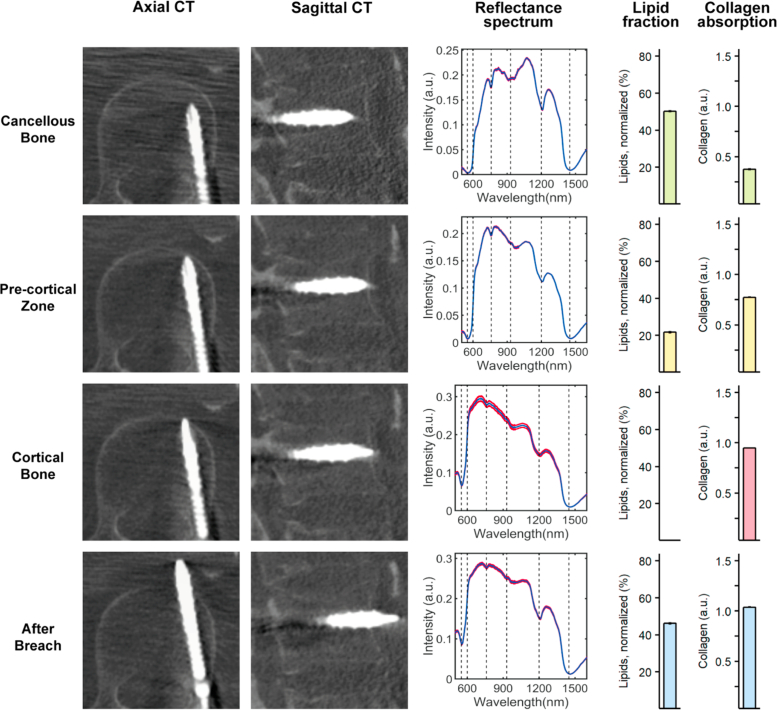
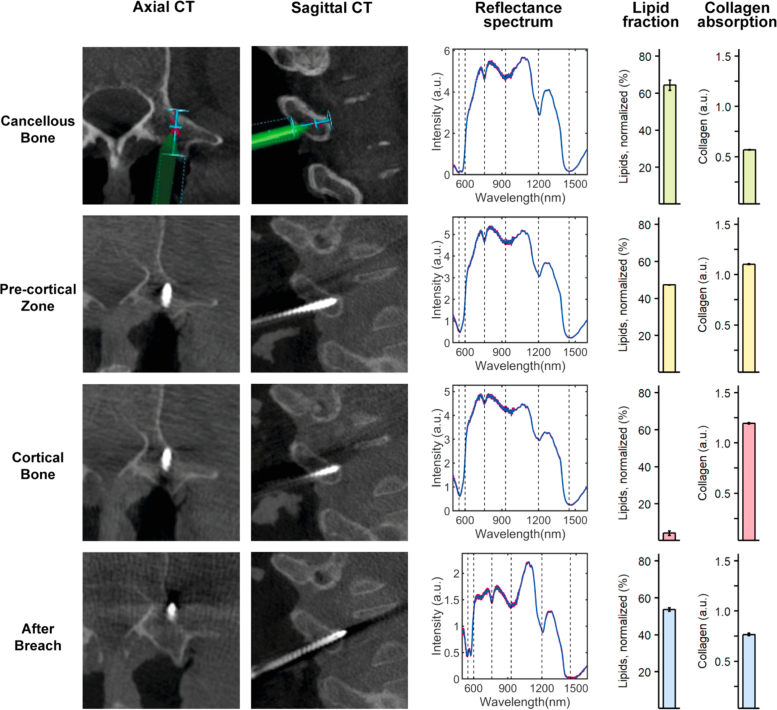
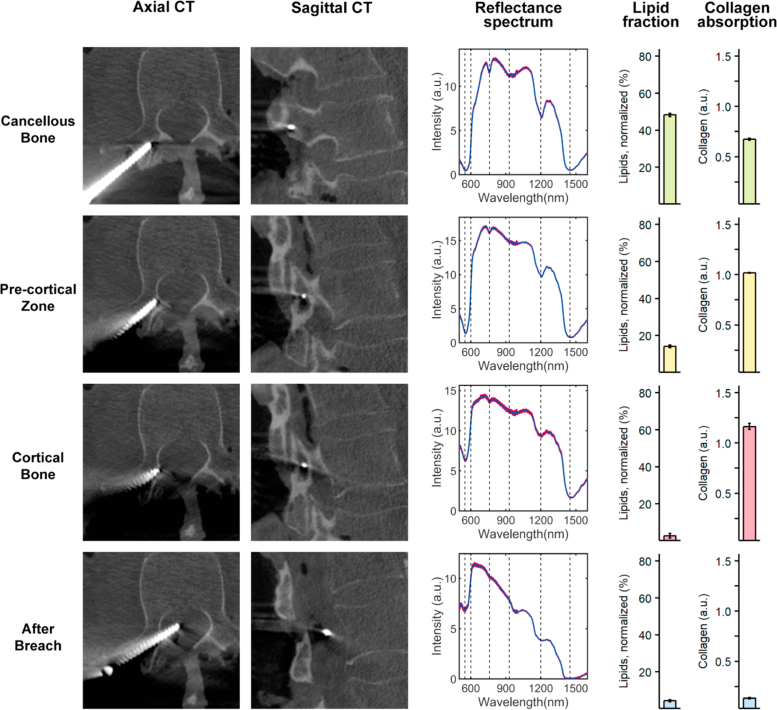
The four types of breach studied are presented below. In Figs. 2 to 5 they are illustrated in axial and sagittal CBCT images with corresponding DRS analysis results presented in conjunction.
Fig. 2.
DR spectroscopy readings and associated imaging of an inferior pedicle screw breach. The first and second column shows axial and sagittal computed tomographies of each position, respectively. The third column shows acquired spectra at each position in red and the fitted spectrum in blue. The fourth and fifth column shows the measured lipid and collagen fractions, respectively.
Fig. 5.
DR spectroscopy readings and associated imaging of an anterior pedicle screw breach. The first and second column shows axial and sagittal computed tomographies of each position, respectively. The third column shows acquired spectra at each position in red and the fitted spectrum in blue. The fourth and fifth column shows the measured lipid and collagen fractions, respectively.
An illustration of an inferior breach is presented in Fig. 2. The initial position of the screw tip in the cancellous bone at the superficial entry into the pedicle saw a high lipid fraction (69.11 ± 0.47 %) and medium collagen fraction (0.60 ± 0.01 a.u.). The transition of the screw tip from cancellous bone to the PCZ saw a drop in lipid fraction and an increase in collagen fraction (9.71 ± 3.21 % and 1.41 ± 0.02 a.u., respectively). When progressed into the cortical bone a further decline in lipid fraction (<0.01 ± 0.00 %) and continued high collagen fraction (1.27 ± 0.05 a.u.) was observed. Finally, when the screw tip was breached outside the vertebra a sharp increase in lipid fraction (80.71 ± 0.52 %) and a steep drop in collagen fraction (0.21 ± 0.01 a.u.) occurred. CBCT imaging confirmed a likely position in the spinal nerve root canal, in accordance with the very high lipid content.
As seen in Fig. 3 , a typical lateral breach was associated with cancellous bone readings similar to those of the inferior breach insertion. However, due to the shallow depth of the screw into the bone, it could not hold and support the weight of the probe. Thus, performing a CBCT to document probe position was not possible in cancellous bone in any of the lateral breach cases. Instead, navigational data is presented. The transition of the screw tip from cancellous bone to the pre-cortical transition zone (PCZ) was associated with a steep drop in the lipid fraction (64.32 ± 8.78 to 47.33 ± 0.28 %) and an increase in collagen fraction (0.57 ± 0.01 to 1.10 ± 0.01 a.u.) and as the tip advanced into cortical bone a gradual decline in lipid fraction (to 4.15 ± 2.65 %) and continued high collagen fraction (1.19 ± 0.01 a.u.) was seen. As the screw protruded outside of the vertebra, a sharp increase in lipid fraction (to 53.67 ± 2.14 %) and a drop in collagen fraction (to 0.77 ± 0.03 a.u.) was seen, in accordance with reading more lipid-rich tissues just outside the bone.
Fig. 3.
DR spectroscopy readings and associated imaging of a lateral pedicle screw breach. The first and second column shows axial and sagittal computed tomographies (CT) of each position, respectively. For cancellous bone, imaging from the navigation software is shown, since pedicle screw depth was not enough to allow for a CT. The screw is represented in green and the planned trajectory in blue. The third column shows acquired spectra at each position in red and the fitted spectrum in blue. The fourth and fifth column shows the measured lipid and collagen fractions, respectively.
A medial breach is presented in Fig. 4 . In accordance with previous insertions, cancellous bone had a high lipid fraction (48.28 ± 1.95 %) and relatively low collagen fraction (0.68 ± 0.02 a.u.). As the screw tip was slowly progressed into the PCZ and subsequently the cortical bone, a decline in lipid fraction (14.13 ± 1.83 to 2.78 ± 6.03 %) and corresponding increase in collagen fraction (1.02 ± 0.01 to 1.16 ± 0.15 a.u.) was seen. When breaching medially, consecutive readings in the spinal canal was met with low lipid values (4.35 ± 1.28 %) and low collagen values (0.13 ± 0.01 a.u.).
Fig. 4.
DR spectroscopy readings and associated imaging of a medial pedicle screw breach. The first and second column shows axial and sagittal computed tomographies of each position, respectively. The third column shows acquired spectra at each position in red and the fitted spectrum in blue. The fourth and fifth column shows the measured lipid and collagen fractions, respectively.
An illustration of a typical anterior breach is presented in Fig. 5 . The transition of the screw tip from cancellous bone in the vertebral body to the pre-cortical transition zone (PCZ) was associated with a steep drop in the lipid fraction (from 50.19 ± 0.59 to 21.74 ± 0.73 %) and an increase in collagen fraction (from 0.37 ± 0.01 to 0.77 ± 0.01 a.u.). As the screw tip was slowly progressed into the cortical bone a further gradual decline in lipid fraction (to <0.01 ± 0.00 %) and corresponding increase in collagen fraction (to 0.95 ± 0.01 a.u.) was noticed. Finally, the transition from cortical bone to a clear breach of the screw tip outside of the vertebra was met with an increase in lipid fraction (to 46.22 ± 0.85 %) while the collagen fraction continued to stay high (1.04 ± 0.01 a.u.). CBCT imaging confirmed a likely position in the aortic wall, in accordance with the high presence of collagen.
3.2. Aggregated data for detecting the cortical border
A total of 45 pedicle screw breaches were performed in thoracic (21) and lumbar (24) vertebrae of the six cadavers. The complete dataset included 1615 DR spectroscopy measurements with verified tissue positions. The mean lipid fraction was 49.19 ± 16.28 %, 25.06 ± 14.76 %, 0.42 ± 2.12 %, and 42.79 ± 32.28 % for cancellous bone, PCZ, cortical bone, and after breach, respectively (Fig. 6A ). There were statistically significant changes in mean lipid fraction between all consecutive tissues (P < 0.001 for all). For collagen, there were statistically significant changes as well between all consecutive tissues (P < 0.001 for all), with mean collagen readings of 0.60 ± 0.26 a.u., 0.84 ± 0.25 a.u., 1.03 ± 0.19 a.u., and 0.60 ± 0.37 a.u. for cancellous bone, PCZ, cortical bone, and after breach, respectively (Fig. 6B).
Fig. 6.
Mean lipid fraction (A) and collagen volume fraction (B) for each tissue type during 45 pedicle screw breaches (n = 1615) of varying types (anterior, lateral, medial, and inferior). Each step-wise change is associated with a statistically significant change as indicated by asterisks (*** = P < 0.001) Abbreviations: PCZ = Pre-cortical zone
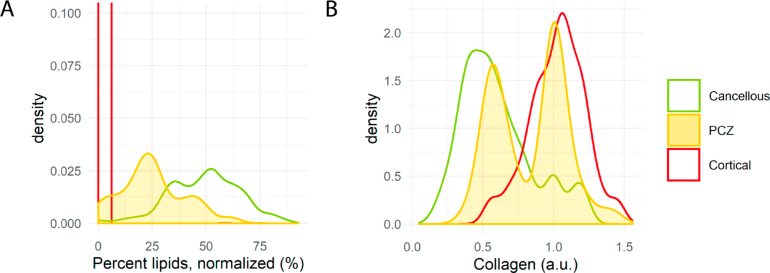
The PCZ was found to correlate to a binomial distribution of lipid fraction readings indicating a step-wise decrease in lipid content as the probe moved closer to the cortical bone (Fig. 7A ). However, the spread of collagen readings in the PCZ indicated a dichotomous behavior (Fig. 7B) with binomially distributed peaks well correlated to either cancellous or cortical bone.
Fig. 7.
Density plots of lipid fraction (A) and collagen volume fraction (B) for all 45 pedicle screw breaches for cancellous bone, cortical bone, and the pre-cortical zone. In (A), the lipid content of the pre-cortical zone follows a binomial distribution in between the two bone types whereas in (B) collagen exhibits a dichotomous behavior in the pre-cortical zone. Abbreviations: PCZ = Pre-cortical zone
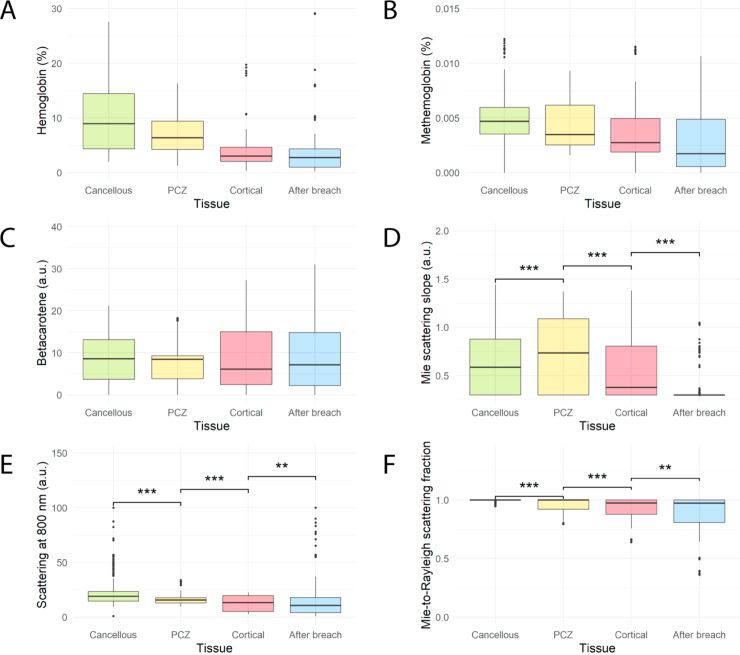
For parameters indicating scattering, there were also statistically significant changes in the means between each tissue type and parameter (Appendix, Fig. 8, D-F, P < 0.01 for all). However, the spread and overlap of data was greater than for lipids and collagen, indicating that the discriminatory power was lower. Although not included in the final analysis (as stated in the Materials & Methods), data for hemoglobin, methemoglobin and beta-carotene can be found in Appendix, Fig. 8, A-C.
3.3. Tissue classification using support vector machines
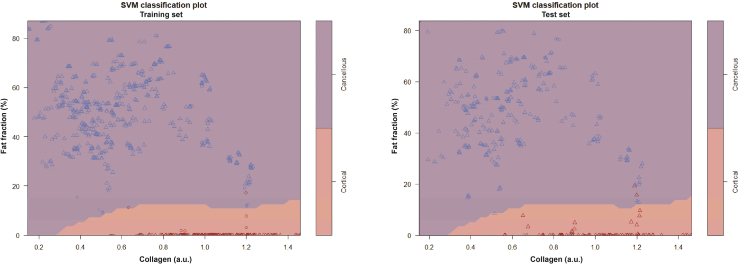
By training the model on 66 % of the data and validating on the remaining 33 %, the model achieved a sensitivity of 98.1 %, specificity of 98.9 %, and an accuracy of 98.7 % when using only fat fraction and collagen content as input (for SVM classification plots, see Appendix, Fig. 9). For the LOO method, 4 cadavers met the criteria for acting as a validation set, meaning 4 cross-over validations were performed. The LOO method resulted in a mean sensitivity of 98.3 % [94.3-100 %], a mean specificity of 97.7 % [91.0-100 %], and a mean accuracy of 97.6 % [93.0 %-100 %] when using fat fraction and collagen as input to the model. When basing the LOO-models on fat fraction, collagen, and scattering parameters (Mie scattering slope and Mie-to-Rayleigh fraction) the mean sensitivity was 99.4 % [97.8-100 %], the mean specificity was 97.6 % [90.2-100 %], and the mean accuracy was 97.9 % [92.5-100 %].
4. Discussion
In this study, we examined the use of DR spectroscopy for cortical breach detection in spinal fixation surgery. The method accurately and reproducibly detected impending breach defined as entry into the pre-cortical zone (PCZ) and subsequently the cortical bone, for various types of breaches. The most robust spectral change was seen in measurements of lipid fraction. In each type of pedicle breach, a sharp drop in DR spectroscopy levels representing lipid fraction was seen with the transition from fatty cancellous bone to the PCZ and cortical bone with a very low lipid fraction (Fig. 2–5). On an aggregate level, lipid fraction also showed a narrow spread of the data for each tissue type. The limited overlap of lipid fraction readings between cancellous and cortical bone meant that the tissue type could, in many cases, be reliably determined from analysis of lipid fraction only. The use of lipid fraction is also supported by a strong correlation between lipid fraction levels according to DRS and MRI, meaning that the generalizability of lipid values is facilitated when extending the technology to different patient groups [33]. However, the inclusion of collagen and scattering parameters would increase reliability for safe clinical use.
Previously, the same technology was investigated using Monte-Carlo simulations and tested during a single vertebral insertion [12]. It was found that water did not significantly contribute to discriminatory power. Blood (hemoglobin) did contribute, but in a cadaveric setting makes little sense to study when the use-case would be in the living. Meanwhile, collagen content was not studied. In this manuscript our purpose was to validate the technology in a cadaveric setting and in actual surgical use-cases with statistical rigor. As part of this, we also added collagen as a discriminatory factor because of the well-known difference in collagen content between cancellous and cortical bone [34].
When applying SVMs to distinguish between cancellous and cortical bone, a sensitivity of 98-99 % and a specificity of 98-99 % was achieved. Although this indicates that clinically relevant reliability is possible, it should be further validated in larger study. The same approach can be applied to separate cancellous bone from the PCZ, but would require a significantly larger dataset to test reliably on. Still, having a high accuracy for distinguishing cancellous and cortical bone ensures that breaches are very rarely missed while giving few false alarms.
4.1. Possible future components of tissue labelling algorithms
While collagen and scattering parameters were significantly different between tissue types, the spread of data was large enough that one-parameter readings would not be sufficient for determining the tissue type. However, by using the parameters selectively in conjunction to the lipid fraction the overall reliability could be increased, as was done with the SVMs. A practical example of this is demonstrated in Fig. 3, where a comparatively high lipid content was present in all tissue types when compared to other insertions. If relying only on lipid fraction, and in absence of knowing the previous cancellous readings, both the PCZ and cortical reading could have been misinterpreted as cancellous bone due to the high lipid content. However, from the aggregated data (Fig. 6) we found that while a low collagen fraction has a low sensitivity and specificity for tissue identification, high values are almost exclusively encountered in the PCZ and cortical bone. Thus, the high collagen fraction seen in the case of Fig. 3 would clearly indicate that the tissue belongs to either the PCZ or cortical bone. In a similar fashion, scattering parameters could be structured for increasing the discriminatory power of DR spectroscopy for tissue labelling in future studies. This has previously been demonstrated by Liu et al, using only scattering parameters to detect the cortical border in a lab setup [35]. They reached a similar conclusion, that more parameters would be needed to increase the reliability in detecting the cortical border. Thus, we suggest that these parameters be used in combination with lipid fraction to increase sensitivity and specificity in future breach prevention algorithms.
An interesting finding was the dissimilar behavior of the lipid and collagen fractions in the PCZ. The lipid fraction was seen to predictably decrease during the transition from cancellous bone, to the PCZ, and to cortical bone. On the other hand, the collagen fraction showed a clear bimodal distribution indicating a dichotomous behavior (Fig. 7B) where the distribution peaks correlated well with the distributions of the cancellous and cortical bone, respectively. This indicates that collagen might be used as a distinct indicator of impending breach while lipid content could provide a progressive scale indicating distance to the border. However, this hypothesis could not fully be proven in this study because of the small distances in question (0-3 mm) in relation to the distance between the optical fibers in the probe (1.22 mm), meaning that the uncertainty of fiber position (which could not be visualized on CBCT) was large enough not to enable investigation of a direct linear relationship between distance and DRS readings in the PCZ.
Another way of increasing the precision of the technology for determining tissue types is implementing a temporal component in the analysis. During an insertion, while continuously providing values on lipid fraction, collagen fraction, scattering etc., a considerable relative change in the right direction, e.g. a drop in lipid fraction when approaching the cortex, could be as valuable as the absolute DR spectroscopy values. This relative change-model could thus be beneficial in situations where an atypical bone constitution leads to unreliable absolute values, which could be the case in bone altering diseases such as osteoporosis or osteoarthritis. This is one of the natural next steps in future studies in the research area.
4.2. Risk of misclassification of tissues
In our analysis of spectral data, we primarily relied on fitted parameters for determining tissue constituents, and specific physical parameters such as scattering. The data included both visible light and the near-infrared spectrum. This has the advantage of being less sensitive to aberrant readings at certain specified wavelengths, as was the case for early DR spectroscopy studies in human tissues [36,37]. Conversely, there is still a risk of misclassification either due to aberrant tissue composition or due to an abundancy of chromophores making readings of other tissue constituents harder. This was one of the limitations of our study, as hemoglobin is one such chromophore and our experiments were done on cadavers where, although hemoglobin was present, perfusion was absent. However, studies on other parts of the body using the same type of DR spectroscopy technology have shown good reliability for determining tissue types despite this fact [16,38].
One way to reduce the likelihood of a tissue misclassification having a clinical impact, would be to introduce a warning system for ‘bad fits’ of the spectral curve. Aberrant spectral readings or light inferences would most likely lead to spectral curves that are not immediately recognizable by the fitting algorithms, therefore, such interference can be detected by above-normal discrepancies between the actual spectral curve and the fitted curve. Such a warning system was already part of the research software used in this study and provided an indication on when the spectral output and the resultant fitted curve contained deviations beyond a pre-determined threshold. In such a circumstance, the surgeon would receive an indication that the DR spectroscopy readings were of limited quality.
4.3. Similar technologies and uses
Current widely used breach detection methods involves simple tactile feedback using pedicle feelers as well as neurophysiological monitoring involving electrical stimulation at the pedicle screws after placement to detect any direct contact with nerve roots [39]. These methods may help to identify pedicle breach but have not sufficed in reducing pedicle screw misplacements rates to acceptable levels [2].
There have been other forays into the field of surgical instruments aiming to warn surgeons of impending breach in spinal surgery. One of the alternative technologies relies on electrical conductivity at the tip of a probe used during surgery [6,7]. This technology provides a validated warning system for impending pedicle breach in real-time, in a similar fashion to what this study investigates by applying DR spectroscopy to the tip of a probe. One of the draw-backs of relying on electrical conductivity, however, is that such technology does not provide feedback on the direction of the impending breach, including if the cortical border is simply close but in parallel to the instrument [6]. Instead, it is left to the surgeon to figure out what went wrong and how to correct it. This shortcoming could potentially be corrected using DR spectroscopy instead of electrical conductivity, as the light cone has a specific direction. By using one forward-looking light cone, as was done in this study, the system will give a warning only if the cortical border is in front of the instrument and at risk of breach. A DR spectroscopy probe with multiple light cones in different directions could even provide directional feedback to the surgeon, i.e. how to correct the screw path in order to avoid breach.
In summary, the addition of an optical sensing technology to the tip of a surgical instrument used in spine surgery for pedicle screw placement, can potentially improve surgical outcomes and reduce complication rates by preventing cortical breaches. This, in turn, may also prevent repeat surgeries and thereby lower overall medical costs related to spine surgery. This initial cadaveric study serves as a proof-of-concept that the technology reliably identifies differences between cancellous bone, cortical bone, and an in-between transition zone we call the pre-cortical zone.
5. Conclusions
DR spectroscopy technology reliably identifies the area of transition from cancellous to cortical bone in typical breach scenarios. DRS technology in the tip of a surgical instrument has the potential to help the surgeon avoid pedicle screw breach in spinal fixation surgery.
Acknowledgments
The authors would like to thank John Racadio and Nicole Hilvert at the radiology department of CCHMC for their contributions and support in enabling the experiments.
Appendix
Fig. 8.
Boxplots of (A) hemoglobin, (B) methemoglobin, (C) betacarotene, (D) mie scattering slope, (E) scattering at 800 nm, and (F) mie-to-rayleigh scattering fraction for each tissue type during 45 pedicle screw breaches (n = 1615). For scattering parameters, *** indicates P < 0.001 and ** indicates P < 0.01. Other parameters were not tested statistically, as indicated in the Materials and Methods section. Abbreviations: PCZ = Pre-cortical zone
Fig. 9.
SVM classification plots depicting the fat fraction and collagen content of all cancellous (blue) and cortical (red) readings. To the left, a plot of the training set (n = 746). To the right, a similar plot on the test set (n = 384). Purple areas highlight everything classified as cancellous bone by the SVM, while red areas are classified as cortical. Data points used as support vectors for the SVM are depicted as circles, the rest are depicted as triangles. For this SVM, only the fat fraction and collagen parameters were used.
Disclosures
None of the authors who are affiliated with clinical institutions (G.B., H.S., O.P., A.E.-T., and E.E.) have financial interests in the subject matter, materials, or equipment or with any competing materials and did not receive any payments from Philips. Karolinska University hospital and Philips Healthcare have a major collaboration agreement. A.S. is affiliated to Philips Research but not an employee and has no direct financial interest in the contents of this work. The other authors affiliated with Philips Research (J.W.S., C.R., D.B., and B.H.W.H.) have financial interests in the subject matter, materials, and equipment, in the sense that they are employees of Philips. The extent of influence on the data, manuscript structure and manuscript conclusions by these authors and/or Philips Research was limited to technical knowledge and input as well as performing biochemical fits of the raw spectral data. Authors without conflicts of interest had full control of all data labelling, data analysis and information submitted for publication and over all conclusions drawn in the manuscript. The prototype system described in this article is currently a research prototype and is not for commercial use.
References
- 1.Weiss A. J., Elixhauser A., Andrews R. M., Characteristics of Operating Room Procedures in U.S. Hospitals, 2011: Statistical Brief #170 (Agency for Healthcare Research and Quality (US), Rockville (MD), 2014). [PubMed] [Google Scholar]
- 2.Kosmopoulos V., Schizas C., “Pedicle screw placement accuracy: a meta-analysis,” Spine (Philadelphia) 32(3), E111–E120 (2007). 10.1097/01.brs.0000254048.79024.8b [DOI] [PubMed] [Google Scholar]
- 3.Tian N. F., Huang Q. S., Zhou P., Zhou Y., Wu R. K., Lou Y., Xu H. Z., “Pedicle screw insertion accuracy with different assisted methods: a systematic review and meta-analysis of comparative studies,” Eur. Spine J 20(6), 846–859 (2011). 10.1007/s00586-010-1577-5 [DOI] [PMC free article] [PubMed] [Google Scholar]
- 4.Gelalis I. D., Paschos N. K., Pakos E. E., Politis A. N., Arnaoutoglou C. M., Karageorgos A. C., Ploumis A., Xenakis T. A., “Accuracy of pedicle screw placement: a systematic review of prospective in vivo studies comparing free hand, fluoroscopy guidance and navigation techniques,” Eur. Spine J. 21(2), 247–255 (2012). 10.1007/s00586-011-2011-3 [DOI] [PMC free article] [PubMed] [Google Scholar]
- 5.Helm P. A., Teichman R., Hartmann S. L., Simon D., “Spinal Navigation and Imaging: History, Trends, and Future,” IEEE Trans. Med. Imaging 34(8), 1738–1746 (2015). 10.1109/TMI.2015.2391200 [DOI] [PubMed] [Google Scholar]
- 6.Guillen P. T., Knopper R. G., Kroger J., Wycliffe N. D., Danisa O. A., Cheng W. K., “Independent assessment of a new pedicle probe and its ability to detect pedicle breach: a cadaveric study,” J. Neurosurg. 21(5), 821–825 (2014). 10.3171/2014.6.SPINE131028 [DOI] [PubMed] [Google Scholar]
- 7.Bolger C., Kelleher M. O., McEvoy L., Brayda-Bruno M., Kaelin A., Lazennec J.-Y., Le Huec J.-C., Logroscino C., Mata P., Moreta P., “Electrical conductivity measurement: a new technique to detect iatrogenic initial pedicle perforation,” Eur. Spine J. 16(11), 1919–1924 (2007). 10.1007/s00586-007-0409-8 [DOI] [PMC free article] [PubMed] [Google Scholar]
- 8.Matousek P., Draper E. R., Goodship A. E., Clark I. P., Ronayne K. L., Parker A. W., “Noninvasive Raman spectroscopy of human tissue in vivo,” Appl. Spectrosc. 60(7), 758–763 (2006). 10.1366/000370206777886955 [DOI] [PubMed] [Google Scholar]
- 9.Morris M. D., Mandair G. S., “Raman assessment of bone quality,” Clin. Orthop. Relat. Res. 469(8), 2160–2169 (2011). 10.1007/s11999-010-1692-y [DOI] [PMC free article] [PubMed] [Google Scholar]
- 10.Krafft C., Codrich D., Pelizzo G., Sergo V., “Raman and FTIR microscopic imaging of colon tissue: a comparative study,” J. Biophotonics 1(2), 154–169 (2008). 10.1002/jbio.200710005 [DOI] [PubMed] [Google Scholar]
- 11.Rohleder D. R., Kocherscheidt G., Gerber K., Kiefer W., Köhler W., Möcks J., Petrich W. H., “Comparison of mid-infrared and Raman spectroscopy in the quantitative analysis of serum,” J. Biomed. Opt. 10(3), 031108 (2005). 10.1117/1.1911847 [DOI] [PubMed] [Google Scholar]
- 12.Swamy A., Burstrom G., Spliethoff J. W., Babic D., Reich C., Groen J., Edstrom E., Elmi Terander A., Racadio J. M., Dankelman J., Hendriks B. H. W., “Diffuse reflectance spectroscopy, a potential optical sensing technology for the detection of cortical breaches during spinal screw placement,” J. Biomed. Opt. 24(01), 1–11 (2019). 10.1117/1.JBO.24.1.017002 [DOI] [PMC free article] [PubMed] [Google Scholar]
- 13.Van Veen R., Sterenborg H. J., Pifferi A., Torricelli A., Chikoidze E., Cubeddu R., “Determination of visible near-IR absorption coefficients of mammalian fat using time-and spatially resolved diffuse reflectance and transmission spectroscopy,” J. Biomed. Opt. 10(5), 054004 (2005). 10.1117/1.2085149 [DOI] [PubMed] [Google Scholar]
- 14.Farrell T. J., Patterson M. S., Wilson B., “A diffusion theory model of spatially resolved, steady-state diffuse reflectance for the noninvasive determination of tissue optical properties in vivo,” Med. Phys. 19(4), 879–888 (1992). 10.1118/1.596777 [DOI] [PubMed] [Google Scholar]
- 15.Doornbos R., Lang R., Aalders M., Cross F., Sterenborg H., “The determination of in vivo human tissue optical properties and absolute chromophore concentrations using spatially resolved steady-state diffuse reflectance spectroscopy,” Phys. Med. Biol. 44(4), 967–981 (1999). 10.1088/0031-9155/44/4/012 [DOI] [PubMed] [Google Scholar]
- 16.Rathmell J. P., Desjardins A. E., van der Voort M., Hendriks B. H. W., Nachabe R., Roggeveen S., Babic D., Söderman M., Brynolf M., Holmström B., “Identification of the Epidural Space with Optical Spectroscopy,” Anesthesiology 113(6), 1406–1418 (2010). 10.1097/ALN.0b013e3181fcee47 [DOI] [PubMed] [Google Scholar]
- 17.Volynskaya Z. I., Haka A. S., Bechtel K. L., Fitzmaurice M., Shenk R., Wang N., Nazemi J., Dasari R. R., Feld M. S., “Diagnosing breast cancer using diffuse reflectance spectroscopy and intrinsic fluorescence spectroscopy,” J. Biomed. Opt. 13(2), 024012 (2008). 10.1117/1.2909672 [DOI] [PubMed] [Google Scholar]
- 18.Zonios G., Perelman L. T., Backman V., Manoharan R., Fitzmaurice M., Van Dam J., Feld M. S., “Diffuse reflectance spectroscopy of human adenomatous colon polyps in vivo,” Appl. Opt. 38(31), 6628–6637 (1999). 10.1364/AO.38.006628 [DOI] [PubMed] [Google Scholar]
- 19.Stelzle F., Zam A., Adler W., Tangermann-Gerk K., Douplik A., Nkenke E., Schmidt M., “Optical nerve detection by diffuse reflectance spectroscopy for feedback controlled oral and maxillofacial laser surgery,” J. Transl. Med. 9(1), 20 (2011). 10.1186/1479-5876-9-20 [DOI] [PMC free article] [PubMed] [Google Scholar]
- 20.Nilsson J. H., Reistad N., Brange H., Öberg C.-F., Sturesson C., “Diffuse reflectance spectroscopy for surface measurement of liver pathology,” Eur. Surg. Res. 58(1-2), 40–50 (2017). 10.1159/000449378 [DOI] [PubMed] [Google Scholar]
- 21.Müller M. G., Valdez T. A., Georgakoudi I., Backman V., Fuentes C., Kabani S., Laver N., Wang Z., Boone C. W., Dasari R. R., “Spectroscopic detection and evaluation of morphologic and biochemical changes in early human oral carcinoma,” Cancer 97, 1681–1692 (2003). 10.1002/cncr.11255 [DOI] [PubMed] [Google Scholar]
- 22.Georgakoudi I., Jacobson B. C., Van Dam J., Backman V., Wallace M. B., Müller M. G., Zhang Q., Badizadegan K., Sun D., Thomas G. A., “Fluorescence, reflectance, and light-scattering spectroscopy for evaluating dysplasia in patients with Barrett’s esophagus,” Gastroenterology 120(7), 1620–1629 (2001). 10.1053/gast.2001.24842 [DOI] [PubMed] [Google Scholar]
- 23.Elmi Terander A., Burström G., Nachabe R., Skulason H., Pedersen K., Fagerlund M., Ståhl F., Charalampidis A., Söderman M., Holmin S., Babic D., Jenniskens I., Edström E., Gerdhem P., “Pedicle Screw Placement Using Augmented Reality Surgical Navigation with Intraoperative 3D Imaging: A First In-Human Prospective Cohort Study,” Spine (Philadelphia) 44(7), 517–525 (2019). 10.1097/BRS.0000000000002876 [DOI] [PMC free article] [PubMed] [Google Scholar]
- 24.Burström G., Buerger C., Hoppenbrouwers J., Nachabe R., Lorenz C., Babic D., Homan R., Racadio J. M., Grass M., Persson O., Edström E., Elmi Terander A., “Machine learning for automated 3-dimensional segmentation of the spine and suggested placement of pedicle screws based on intraoperative cone beam computer tomography,” J. Neurosurg. Spine 31(1), 147–154 (2019). 10.3171/2018.12.spine181397 [DOI] [PubMed] [Google Scholar]
- 25.Tanis E., Spliethoff J. W., Evers D. J., Langhout G. C., Snaebjornsson P., Prevoo W., Hendriks B. H., Ruers T. J., “Real-time in vivo assessment of radiofrequency ablation of human colorectal liver metastases using diffuse reflectance spectroscopy,” Eur. J. Surg. Oncol. 42(2), 251–259 (2016). 10.1016/j.ejso.2015.12.005 [DOI] [PubMed] [Google Scholar]
- 26.Li W., Liu Y., Qian Z., “Determination of detection depth of optical probe in pedicle screw measurement device,” Biomed. Eng. Online 13(1), 148 (2014). 10.1186/1475-925X-13-148 [DOI] [PMC free article] [PubMed] [Google Scholar]
- 27.Hendriks B. H. W., Balthasar A. J. R., Lucassen G. W., van der Voort M., Mueller M., Pully V. V., Bydlon T. M., Reich C., van Keersop A. T. M. H., Kortsmit J., Langhout N., van Geffen G.-J., “Nerve detection with optical spectroscopy for regional anesthesia procedures,” J. Transl. Med. 13(1), 380 (2015). 10.1186/s12967-015-0739-y [DOI] [PMC free article] [PubMed] [Google Scholar]
- 28.de Boer L. L., Bydlon T. M., van Duijnhoven F., Vranken Peeters M., Loo C. E., Winter-Warnars G. A. O., Sanders J., Sterenborg H., Hendriks B. H. W., Ruers T. J. M., “Towards the use of diffuse reflectance spectroscopy for real-time in vivo detection of breast cancer during surgery,” J. Transl. Med. 16(1), 367 (2018). 10.1186/s12967-018-1747-5 [DOI] [PMC free article] [PubMed] [Google Scholar]
- 29.Nachabe R., Hendriks B. H., Desjardins A. E., van der Voort M., van der Mark M. B., Sterenborg H. J., “Estimation of lipid and water concentrations in scattering media with diffuse optical spectroscopy from 900 to 1,600 nm,” J. Biomed. Opt. 15(3), 037015 (2010). 10.1117/1.3454392 [DOI] [PubMed] [Google Scholar]
- 30.Taroni P., Comelli D., Pifferi A., Torricelli A., Cubeddu R., “Absorption of collagen: effects on the estimate of breast composition and related diagnostic implications,” J. Biomed. Opt. 12(1), 014021 (2007). 10.1117/1.2699170 [DOI] [PubMed] [Google Scholar]
- 31.Noble W. S., “What is a support vector machine?” Nat. Biotechnol. 24(12), 1565–1567 (2006). 10.1038/nbt1206-1565 [DOI] [PubMed] [Google Scholar]
- 32.Chang C.-C., Lin C.-J., “LIBSVM: A library for support vector machines,” ACM Trans. Intell. Syst. Technol. 2(3), 1–27 (2011). 10.1145/1961189.1961199 [DOI] [Google Scholar]
- 33.Swamy A., Burström G., Spliethoff J. W., Babic D., Ruschke S., Racadio J. M., Edström E., Terander A. E., Dankelman J., Hendriks B. H. W., “Validation of Diffuse Reflectance Spectroscopy with Magnetic Resonance Imaging for accurate vertebral bone fat fraction quantification,” Biomed. Opt. Express 10(8), 4316–4328 (2019). 10.1364/BOE.10.004316 [DOI] [PMC free article] [PubMed] [Google Scholar]
- 34.Walsh William R., Walton Mark, Bruce Warwick, Yu Yan, Gillies Ronald M., Svehla M., “2. Cell structure and biology of bone and cartilage,” in Handbook of Histology Methods for Bone and Cartilage, An Y. H., Martin K. L., eds. (Springer Science & Business Media, 2003), pp. 35–58. [Google Scholar]
- 35.Liu Y., Wang Y., Qian Z., Zhao J., Cao X., Li W., “Monitoring the reduced scattering coefficient of bone tissues on the trajectory of pedicle screw placement using near-infrared spectroscopy,” J. Biomed. Opt. 19(11), 117002 (2014). 10.1117/1.JBO.19.11.117002 [DOI] [PubMed] [Google Scholar]
- 36.Toms S. A., Lin W.-C., Weil R. J., Johnson M. D., Jansen E. D., Mahadevan-Jansen A., “Intraoperative Optical Spectroscopy Identifies Infiltrating Glioma Margins with High Sensitivity,” Neurosurgery 57(2), 382–394 (2005). 10.1093/neurosurgery/57.2.382 [DOI] [PubMed] [Google Scholar]
- 37.Andrews R., Mah R., Aghevli A., Freitas K., Galvagni A., Guerrero M., Papsin R., Reed C., Stassinopoulos D., “Multimodality stereotactic brain tissue identification: the NASA smart probe project,” Stereotact. Funct. Neurosurg. 73(1-4), 1–8 (1999). 10.1159/000029742 [DOI] [PubMed] [Google Scholar]
- 38.Spliethoff J. W., Prevoo W., Meier M. A., de Jong J., Klomp H. M., Evers D. J., Sterenborg H. J., Lucassen G. W., Hendriks B. H., Ruers T. J., “Real-time In Vivo Tissue Characterization with Diffuse Reflectance Spectroscopy during Transthoracic Lung Biopsy: A Clinical Feasibility Study,” Clin. Cancer Res. 22(2), 357–365 (2016). 10.1158/1078-0432.CCR-15-0807 [DOI] [PubMed] [Google Scholar]
- 39.Parker S. L., McGirt M. J., Farber S. H., Amin A. G., Rick A. M., Suk I., Bydon A., Sciubba D. M., Wolinsky J. P., Gokaslan Z. L., Witham T. F., “Accuracy of free-hand pedicle screws in the thoracic and lumbar spine: analysis of 6816 consecutive screws,” Neurosurgery 68(1), 170–178; discussion 178 (2011). 10.1227/NEU.0b013e3181fdfaf4 [DOI] [PubMed] [Google Scholar]


