Abstract
The dynamic activities of mitochondria and lysosomes, which play important roles in maintaining cellular homeostasis, were observed without labeling by using highly sensitive photothermal (PT) microscopy. This imaging modality allows for the direct observation of cellular organelles that contain endogenous chromophores, with high temporal and spatial resolution. We identified mitochondria and lysosomes inside living mammalian cells via simultaneous dual-color imaging. Moreover, dynamic imaging revealed that the lysosomes make contact with mitochondria and move between sites within the dynamic mitochondrial network. Since mitochondrial and lysosomal functions are intricately connected, PT microscopy should provide in-depth understanding of cellular functions associated with mitochondria–lysosome communication as well as insights into various human diseases caused by dysfunction of these organelles.
1. Introduction
Optical microscopy is indispensable for visualizing intracellular structures in biomedical research and medical diagnosis. Since optical methods are non-invasive, they are particularly useful for revealing the structure and dynamics of organelles in living cells and organs. Fluorescence microscopy is currently one of the most popular methods for cell imaging owing to the unprecedented sensitivity of its background-free detection. Fluorescent molecules such as fluorescent proteins, organic dyes, and semiconductor nanocrystals are used to label specific targets. However, it is possible that the label–target complex may have different behavior from the native target. Furthermore, this imaging modality is limited to observations of targets that can be readily labeled. Photobleaching of fluorescence signals is also a significant problem in fluorescence microscopy, especially in time-course imaging where fluorescent molecules are exposed to successive light irradiation.
Photothermal (PT) microscopy can visualize non-fluorescent chromophores with high sensitivity and high spatial resolution [1–3]. In PT microscopy, two laser beams with different wavelengths are usually used for pumping and probing: the pump beam increases the temperature, ΔT, around the focal point of the optically absorbing sample, which results in variations in the local refractive index (typically Δn ≈ 10−4 for ΔT = 1 K in water); the refractive index change is detected with the probe beam. This technique has been applied to the visualization of the distributions of endogenous chromophores in biological specimens, such as hemoproteins in mitochondria [4–6], red blood cells in microvascular networks [7], and melanin pigments in skin cancers [8–10]. Non-fluorescent molecules are usually less affected by photobleaching compared to fluorescence molecules, and hence make better PT imaging contrasts.
So far, several label-free PT imaging studies of live cells or organs have been made [4–7,9]. However, little has been reported on the dynamic imaging of cellular processes because of the slow imaging speed of the PT microscopy modality. Image acquisition time in previous realizations of PT microscopy typically ranged from several to several tens of minutes [1]. Cell structure, organelles, and macromolecules inside the cell are dynamic entities, responding both to the internal state of the cell and external stimuli. Dynamic time-resolved imaging or time-course analysis is essential for providing sufficient information to explain complex biological events. Furthermore, time-resolved imaging is needed to thoroughly examine which organelles or species can be visualized in PT microscopy, as the origin of the PT signal from live cells is not yet clear [4].
Improvements in signal-to-noise ratio (SNR) are critical for the successful application of PT microscopy to dynamic cellular imaging. Improved SNR is crucial for cellular imaging, not only because it facilitates measurement times to be decreased, but also because it allows the minimization of irradiation and thermal damage to live cells. In previous work, we developed a highly-sensitive laser scanning PT microscope by implementing a new detection scheme (space-divided balanced detection), using a low-noise balanced detector [11–13]. The detection limit for the temperature increase was evaluated experimentally to be 0.1-0.2 K for an integration time per pixel of 10 µs [12]. This system allows image acquisition with a temporal resolution of several seconds while maintaining a temperature-rise of a few degrees. Furthermore, simultaneous multi-wavelength PT imaging has been demonstrated using several laser diodes (LDs) with different wavelengths, via frequency-division multiplexing [14]. Multi-wavelength imaging is a straightforward approach for differentiating or identifying multiple species within a sample that takes advantage of the fact that each PT signal is proportional to the molecular absorption coefficient. PT spectral imaging has also been achieved, using a wavelength-tunable laser as a pump beam, by switching the laser wavelength and making repeated scans [5,9]. However, the simultaneous measurement of multiple wavelengths is crucial for imaging moving objects such as living cells, to minimalize image displacement between the images acquired using different wavelengths.
In this study, we performed dynamic imaging of live cells by using highly sensitive, simultaneous dual-pump PT microscopy. We observed filamentous and punctate structures inside living cells, which were attributed to mitochondria and lysosomes, respectively. Moreover, time-course PT imaging revealed distinctive lysosome motion and a transformation of mitochondrial morphology in response to external stimuli.
2. Experimental
2.1. Experimental setup
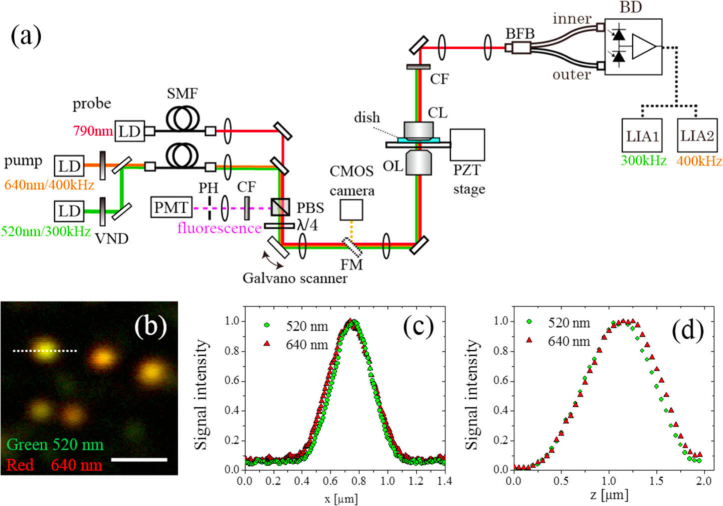
Figure 1 shows the PT microscopy experimental setup used in this study. The optical configuration is largely the same as that reported in our previous publications [11,12]. A 780-nm single-frequency laser diode (LD) was used for probing. For two-color imaging, 520 and 640-nm LDs were used as pumps, with their intensities modulated at different frequencies (300 and 400 kHz, respectively) for the simultaneous lock-in detection. Variable neutral-density filters were used to control the pump-beam powers. The two pump beams were combined using a dichroic mirror and collimated using a single-mode fiber and an off-axis parabolic mirror for spatial-mode filtering. The combined pump and probe beams were directed to the sample via a galvo-scanner. An objective lens with a numerical aperture of 1.25 (Olympus UPLSAPO40XS) was used to focus the beams on a sample. The focused laser beams were scanned, point-by-point, sequentially, and the pixel information was assembled into an image. Transmitted beams were collected by a collection lens (Olympus U-AAC) whose front aperture was directly immersed in the culture solution. Improvement in the SNR is crucial for the dynamics imaging because SNR is proportional to the square root of the measurement time in the shot noise limited PT microscopy. To improve the signal-to-noise ratio, a spatially divided balanced detection scheme was implemented using a custom-made fiber bundle [11,13,15]. The fiber bundle separated the central and peripheral parts of the transmitted probe beams. A home-built balanced photodetector was used to detect the separated probe beams with shot-noise-limited sensitivity [12]. The PT signals at the two frequencies were simultaneously demodulated by frequency-division multiplexing [14] using a dual-frequency lock-in amplifier (NF LI5660), for which the time constants tc were set to 10 µs. The sample position was controlled in the axial direction using a positioning stage driven by a piezo actuator to acquire a set of images focused on adjacent parallel planes within the sample (a z-stack) [8]. A confocal fluorescence detection scheme was also set up, in which a photomultiplier tube (Hamamatsu H5784-04) detected the fluorescence signal from the sample through a pinhole [11]. More details of the experimental setup have been presented in our previous publications [8,11–15]
Fig. 1.
(a) Schematic of the experimental setup. LD, laser diode; SMF, single-mode fiber; PBS, polarizing beam splitter; CF, color filter; PH, pinhole; PMT, photomultiplier tube; FM, flip mirror; OL, objective lens; CL; collection lens; BFB, bifurcated fiber bundle; BD, balanced detector; LIA, lock-in amplifier. (b) PT image of 5-nm gold nanoparticles dispersed in polyvinyl alcohol film. Green and red colors indicate signal intensities at the pump wavelength of 520 and 640 nm, respectively. Pump-beam powers incident on the sample were 0.3 and 0.9 mW at 520 and 640 nm, respectively. The probe beam power was 7 mW. The image size is 500 × 500 pixels with the pixel size of 8 nm. Scale bar: 1 µm. (c) Intensity profiles along the dotted line in (b). (d) Point spread function along the axial direction.
The spatial resolution of the PT microscope was evaluated by measuring individual 5-nm gold nanoparticles (Sigma Aldrich) dispersed in polyvinyl alcohol film [Fig. 1(b-d)]. The full width at half maximum (FWHM) values for the lateral intensity profiles were measured to be 0.29 and 0.32 µm when the wavelength of the pump beam was 520 and 640 nm, respectively. The spatial displacement between the two-color image was within 20 nm. Figure 1(d) shows the axial point spread function (PSF), which was obtained by acquiring a stack of 50 images, shifting the sample position in the axial direction by 0.05 µm between each acquisition; the FWHMs of the axial PSFs are 0.86 and 0.89 µm for 520 and 640 nm, respectively, and the spatial displacement in the axial direction is 0.1 µm.
2.2. Materials
HeLa and COS-7 cells were provided by the RIKEN BRC through the National BioResource Project of the MEXT/AMED, Japan. Both cell lines were cultured in Dulbecco’s modified Eagle’s medium (DMEM), supplemented with streptomycin (100 µg/mL), penicillin (100 U/mL), and 10% bovine serum, in an incubator at 5% CO2 and 37 °C. Phenol red solution, which is commonly used for pH testing, was not added to the medium because it absorbs visible light and would cause temperature increases during the measurements. For the live-cell imaging, cells were cultured in a glass-bottomed dish. Live-cell imaging was conducted at room temperature (22 °C) within 1 hour of the culture dish being taken from the incubator. For the fluorescence imaging of lysosomes, a transfection reagent (Invitrogen Lysosome-RFP) was used to express red fluorescence proteins (RFP), specifically labeling lysosomes with RFP. For the measurements of fixed cells, cells were cultured on a coverslip, which was then washed with distilled water and air-dried before being mounted on a glass slide using a drop of mounting solution (Matsunami MGK-S).
3. Results and discussion
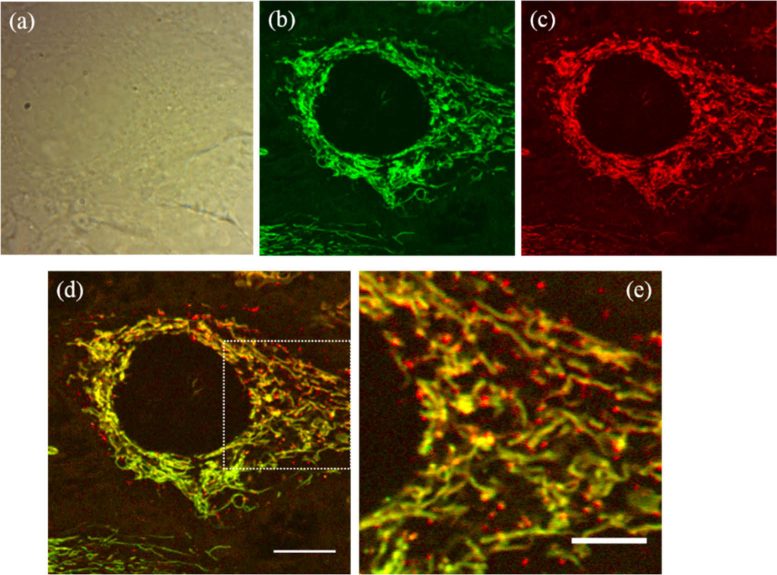
Figure 2 shows bright-field (a) and PT images (b-e) of live HeLa cells. The bright-field image was acquired using a CMOS camera with a LED backlight. PT images at the pump wavelengths of 520 and 640 nm are shown in Fig. 2(b) and Fig. 2(c), respectively. The images consist of 2000 × 2000 pixels, and the acquisition time was 44 s. The two different PT images are merged in Fig. 2(d), where the green and red colors represent the signal intensity at the 520- and 640-nm wavelengths, respectively. Figure 2(e) is a magnified view of Fig. 2(d). The pump powers incident on the sample were 2.9 and 12 mW at 520 and 640 nm, respectively. PT microscopy provides high-contrast images of organelles inside cells. In these images, filamentous and punctate structures are observed around the cell nucleus that appears as a circular dark shadow. The filamentous structures can be associated with mitochondria, from their characteristic shape and localization [4,16]. Mitochondria are organelles in cells that supply energy in the form of adenosine triphosphate (ATP). The contrast agent of the PT signal is assumed to be the cytochrome c contained in the intermembrane space of the mitochondria [4–6]. Because cytochrome c has an absorption peak at a wavelength of ∼530 nm, the 520-nm pump produces a large PT signal. The ratio of the signal intensity at 520 nm to that at 640 nm is ∼1.4. Thus, the mitochondria appear green in the merged images. In contrast, the PT signal from the punctate structures, observed using the 640-nm pump, appear more intense than the same features seen at 520 nm by a factor of ∼1.5. Thus, they appear orange or yellow in the merged images. It should be noted that most of the punctate structures are found within the mitochondrial network. The diameters of the punctate structures are in the range of 0.5-0.7 µm.
Fig. 2.
Live HeLa cell imaging results. (a) Bright field image. (b, c) PT images at the wavelengths of (b) 520 and (c) 640 nm. The pixel size is 24 nm. (d) Dual-wavelength image produced by combining the images in (b) and (c). (e) Magnified image of the outlined area in (d). Scale bars: 10 µm (d) and 5 µm (e).
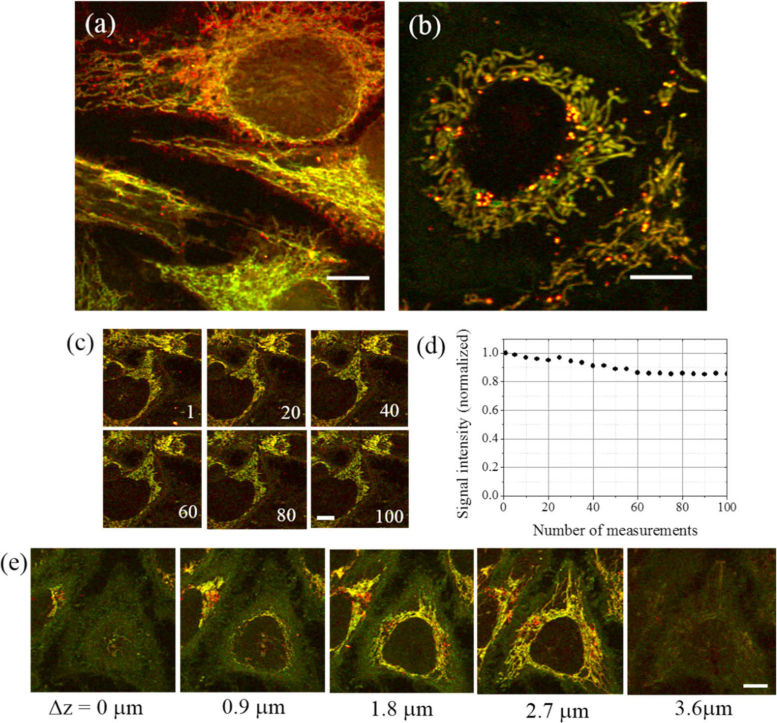
We also conducted PT imaging of fixed HeLa cells on a glass slip and acquired images showing very similar subcellular features to those seen in the live-cell images [ Fig. 3(a)]. This result indicates that it is possible to acquire PT images even for fixed cells, as long as the cell structure and organelle distribution are maintained during the fixing process. In addition to HeLa cells, we conducted PT imaging of live COS-7 cells [Fig. 3(b)] and found that both filamentous and punctate structures are again visualized around the cell nucleus in these cells. In the HeLa cells, the punctate structures are widely scattered throughout the mitochondrial network. In contrast, in the COS-7 cells, the punctate structures are clustered around the boundaries of the cell nuclei. We examined the photodegradation of the endogenous chromophores caused by the laser irradiation by repeating the image acquisition [Fig. 3(c)]. Figure 3(d) shows the mean signal intensities of the sequential images, indicating that signal intensity decreases by only 14% after 100 scans.
Fig. 3.
(a) PT image of fixed HeLa cells. (b) PT image of live COS-7 cells. (c) PT images of live HeLa cells upon repeated measurements; the number of measurements is indicated at the lower right of each image panel. (d) Mean signal intensity as a function of number of measurements. (e) Selected optically sectioned images of live HeLa cells; a total of 40 images were acquired by changing the z-position of the sample. Scale bars: 10 µm.
PT microscopy is capable of optical sectioning in a similar manner to confocal microscopy because it is based on a pump-probe technique [8]. Here, we demonstrate 3D imaging of organelles in live cells. A stack of 50 images of live HeLa cells was acquired by changing the sample position in the axial direction, using a step size of 0.1 µm, to obtain a complete structure of the cell and its organelles [Fig. 3(e) and Visualization 1 (13.5MB, avi) ]. Although the filamentous and the punctate structures produce strong PT signals, a weak signal is also produced by the cell cytosol or cytoskeleton, allowing the outline shape of the cells to be determined.
To examine whether the punctate structures observed in PT images form a part of the mitochondria, we observed morphological changes of the mitochondria in response to physiological treatments. For this purpose, carbonyl cyanide m-chlorophenylhydrazone (CCCP), an ionophore and decoupler of the respiratory chain, was added on the culture medium and time-course images were acquired (Visualization 2 (5MB, avi) and Visualization 3 (4.7MB, avi) ). It is known that CCCP induces membrane depolarization, leading to a morphological transformation of mitochondria from filaments to a rounded structures [17]. Figure 4 shows PT images of HeLa cells before (a) and after (b) CCCP loading. The final concentration of CCCP was 20 µM. The filamentous structure changes to a round shape with a diameter of ∼1.0 µm after depolarization. This finding establishes that the filamentous structures represent mitochondria. However, we observed that the punctate structures are not affected by CCCP. Their sizes, signal intensities, signal intensity ratios (520/640nm), and subcellular locations showed little change during CCCP loading. This result suggests that the punctate structures are distinct from mitochondria.
Fig. 4.
PT images of live HeLa cells (a) before and (b) after CCCP loading for a period of 135 min; 200 images of 500 × 500 pixels were successively acquired during the CCCP loading process with a frame interval of 37 s (Visualization 2 (5MB, avi) and Visualization 3 (4.7MB, avi) ). The pixel size is 75 nm. Scale bars: 10 µm.
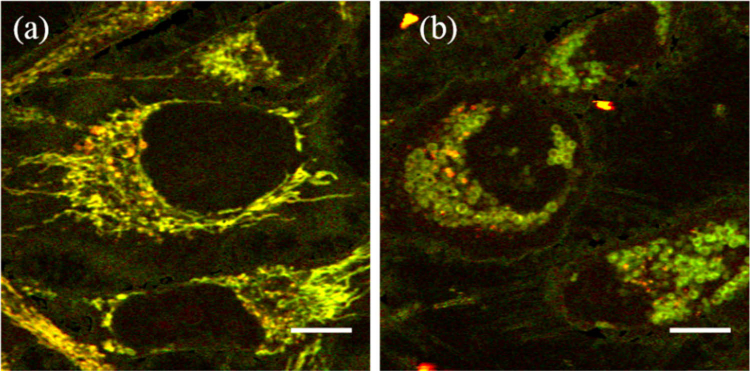
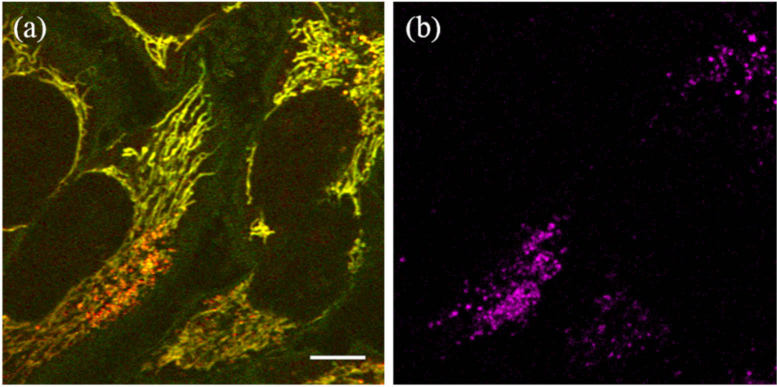
Although the punctate structures cannot be attributed to the mitochondrial network, we consider that it is functionally linked to the mitochondria as they are colocalized around the cell nucleus. Lysosomes are membrane-enclosed organelles that function as the digestive system of the cell, and these are thought to have membrane contact sites with mitochondria, allowing mutual regulation of their functions [18,19]. In fluorescence imaging, lysosomes and mitochondria have often been observed to colocalize [20]. Thus, we speculated that the punctate structures seen here in the PT images are lysosomes. Since lysosomes can also be observed using a fluorescence probe, PT and confocal fluorescence images of lysosomes, within the same cells, specifically labeled with RFP were acquired (Fig. 5). Fluorescence imaging was first conducted, using the 520-nm LD for excitation, followed by PT imaging. One can see clear colocalization of the punctate structures in the PT [Fig. 5(a)] and fluorescence images [Fig. 5(b)]. This result indicates that the punctate structures can be attributed to lysosomes.
Fig. 5.
(a) Photothermal and (b) fluorescence images of live HeLa cells acquired from the same view. Lysosomes were specifically labeled using red fluorescent proteins. For the fluorescence imaging, the power of the excitation laser beam was set at 0.1 mW. The images consist of 1100 × 1100 pixels with the pixel size of 62 nm. Scale bar: 10 µm.
Lysosomes contain various enzymes capable of degrading different types of biomolecules. One of the possible origins of the measured PT signals are lipofuscin granules. These lipid-containing residues of lysosomal digestion consists of pigments that absorb visible light. However, careful studies are still needed to ascertain the origin of the PT signal as lysosomes contain various biomolecules and their degradation products [21]. There is a possibility that the PT signal originates from impaired mitochondria incorporated within lysosomes through autophagy pathways (mitophagy) [21,22]. Accumulation of specific substrates in lysosomes is implicated as a cause of various diseases, known as lysosomal storage diseases [23]. We anticipate that imaging of endogenous chromophores in lysosomes will prove to be a beneficial approach for improving the understanding and diagnosis of such diseases.
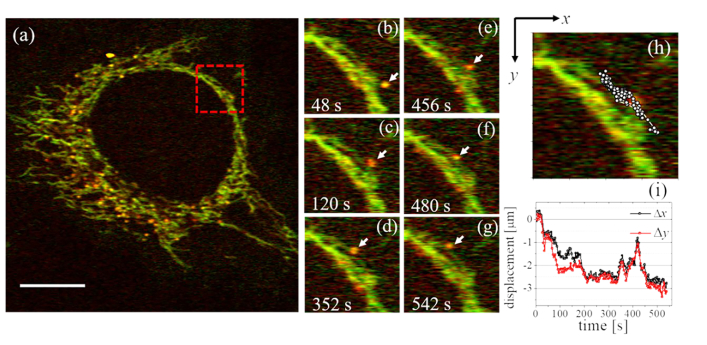
Finally, we observed dynamic activities of the organelles by acquiring time-course images at 4 s/frame (Fig. 6 and Visualization 4 (8.7MB, avi) ), with each image consisting of 500 × 500 pixels. We can see that lysosomes move around the dynamic mitochondrial network. Figure 6(b-g) displays expanded views of the square region in shown in Fig. 6(a) from the time-course images. Figure 6(h) illustrates the trajectory of the lysosome marked by the arrows in Fig. 6(b-g) as overlaid circles on the PT image. The temporal variations of the lysosomal position in the x and y directions are summarized in Fig. 6(i). We observed that most of the lysosomes are continually in contact with the mitochondria and some of the lysosomes move along the mitochondrial structures. It appears that the movements of the lysosomes are not continuous but rather that these organelles appear to move in a stop-and-go fashion and the movement direction changes frequently. This suggests that lysosome movement is subject to regulation by protein motors [24,25]. We were able to confirm that laser irradiation does not cause cell death during measurements lasting several tens of minutes.
Fig. 6.
Dynamic PT imaging of mitochondria and lysosomes in a live HeLa cell. (a) Successive images were acquired with a frame interval of 4 s (Visualization 4 (8.7MB, avi) ). The pixel size is 105 nm. Scale bar: 10 µm. (b-g) Time-course images of an expanded view of the region outlined by the red square in (a). The location of a lysosome is indicated by the arrows. (h) The trajectory of the lysosome over 550 s. (i) Lysosomal positions in the x and y directions during the time-course measurement.
Dynamic images shown in Fig. 6 were acquired with a pixel size of 0.1 µm. Although one can see pixel cross-talk along the fast scanning axis (transverse direction), it does not cause a significant problem to observe the structure and dynamics of the cellar organelles.
In lock-in measurements, the modulation period should be much smaller than tc. However, in PT microscopy, signal intensity is determined by the heat diffusivity and it decreases with a decrease in the modulation period. We have examined the frequency dependence of the PT signal of live HeLa cells by changing the modulation frequency from 40 kHz to 3 MHz and found that the PT signal decreased by half at 1 MHz. This indicates that the low modulation frequency is better to achieve a high SNR. On the other hand, images are severely distorted when the modulation frequency is less than ∼200 kHz for tc = 10 µs because the modulation period is too closes to tc. In order to balance SNR with the image fidelity, modulation frequencies were selected at 300 and 400 kHz. Since second-order low pass filters were used for the lock-in integration, frequency detuning between the two-channels was set at 100 kHz so that the cross-talk between the two-channel is less than -40 dB. We have also examined the frequency dependence of the spatial resolution by measuring individual gold nanoparticles and confirmed that the spatial resolution shows little difference as long as the modulation frequency is above 300 kHz.
4. Conclusions
We have demonstrated label-free dynamic imaging of mitochondria and lysosomes in living cells by using highly sensitive, simultaneous dual-pump PT microscopy. To date, mitochondria and lysosomes have been visualized via fluorescence microscopy, using various fluorescent molecules as probes. Our label-free approach has advantages, especially for the dynamic observation of organelles, because labeling markers may disturb the motion of the target and result in behavior that is different from that of the native target [16].
Mitochondrial and lysosomal functions are thought to be intricately connected and critical for maintaining cellular homeostasis. A further direction of this study will be to provide a biological interpretation of the present findings and new insight into a biological problem associated with lysosome-mitochondria interactions. Lysosomes play a crucial role in degrading damaged mitochondria in mitophagy pathway. It would be interesting to observe mitophagy or the consequences of its disruption without the use of any labels by PT microscopy.
Besides mitophagy, recent researches suggest several functional cross-talk between mitochondria and lysosomes. For example, lysosome regulates mitochondrial fission, and conversely, mitochondria regulate lysosomal dynamics by modulating Rab7 GTP-binding [18]. Furthermore, lysosomes and mitochondria control lipid and amino metabolism in a coordinated way [26–28]. However, their mechanism and functional roles are still not well known. It has also been suggested that dysfunction of mitochondria and lysosome causes various human diseases including neurodegenerative diseases, for example Parkinson’s and Alzheimer’s diseases [18,19]. The distinctive lysosome motion observed using PT microscopy may be related to inter-organelle communication between mitochondria and lysosomes. Our label-free imaging modality has the capabilities to provide new insights into cellular functions associated with mitochondria–lysosome communication that would not be readily accessible using fluorescence-labeling techniques.
Funding
Japan Society for the Promotion of Science10.13039/501100001691 (18K03561); Sumitomo Foundation10.13039/100008608 (160314).
Disclosures
The authors declare that there are no conflicts of interest related to this work.
References
- 1.Vermeulen P., Cognet L., Lounis B., “Photothermal microscopy: optical detection of small absorbers in scattering environments,” J. Microsc. 254(3), 115–121 (2014). 10.1111/jmi.12130 [DOI] [PubMed] [Google Scholar]
- 2.Uchiyama K., Hibara A., Kimura H., Sawada T., Kitamori T., “Thermal lens microscope,” Jpn. J. Appl. Phys. 39(Part 1, No. 9A), 5316–5322 (2000). 10.1143/JJAP.39.5316 [DOI] [Google Scholar]
- 3.Gaiduk A., Yorulmaz M., Ruijgrok P. V., Orrit M., “Room-temperature detection of a single molecule's absorption by photothermal contrast,” Science 330(6002), 353–356 (2010). 10.1126/science.1195475 [DOI] [PubMed] [Google Scholar]
- 4.Lasne D., Blab G. A., De Giorgi F., Ichas F., Lounis B., Cognet L., “Label-free optical imaging of mitochondria in live cells,” Opt. Express 15(21), 14184–14193 (2007). 10.1364/OE.15.014184 [DOI] [PubMed] [Google Scholar]
- 5.Brusnichkin A. V., Nedosekin D. A., Galanzha E. I., Vladimirov Y. A., Shevtsova E. F., Proskurnin M. A., Zharov V. P., “Ultrasensitive label-free photothermal imaging, spectral identification, and quantification of cytochrome c in mitochondria, live cells, and solutions,” J. Biophotonics 3(12), 791–806 (2010). 10.1002/jbio.201000012 [DOI] [PMC free article] [PubMed] [Google Scholar]
- 6.Tamaki E., Sato K., Tokeshi M., Sato K., Aihara M., Kitamori T., “Single-cell analysis by a scanning thermal lens microscope with a microchip: direct monitoring of cytochrome c distribution during apoptosis process,” Anal. Chem. 74(7), 1560–1564 (2002). 10.1021/ac011092t [DOI] [PubMed] [Google Scholar]
- 7.Lu S., Min W., Chong S., Holtom G. R., Xie X. S., “Label-free imaging of heme proteins with two-photon excited photothermal lens microscopy,” Appl. Phys. Lett. 96(11), 113701 (2010). 10.1063/1.3308485 [DOI] [Google Scholar]
- 8.Miyazaki J., Tsurui H., Kobayashi T., “Reduction of distortion in photothermal microscopy and its application to the high-resolution three-dimensional imaging of nonfluorescent tissues,” Biomed. Opt. Express 6(9), 3217–3224 (2015). 10.1364/BOE.6.003217 [DOI] [PMC free article] [PubMed] [Google Scholar]
- 9.Nedosekin D. A., Galanzha E. I., Ayyadevara S., Shmookler Reis R. J., Zharov V. P., “Photothermal confocal spectromicroscopy of multiple cellular chromophores and fluorophores,” Biophys. J. 102(3), 672–681 (2012). 10.1016/j.bpj.2011.12.035 [DOI] [PMC free article] [PubMed] [Google Scholar]
- 10.He J., Wang N., Tsurui H., Kato M., Iida M., Kobayashi T., “Noninvasive, label-free, three-dimensional imaging of melanoma with confocal photothermal microscopy: Differentiate malignant melanoma from benign tumor tissue,” Sci. Rep. 6(1), 30209 (2016). 10.1038/srep30209 [DOI] [PMC free article] [PubMed] [Google Scholar]
- 11.Miyazaki J., Iida T., Tanaka S., Hayashi-Takagi A., Kasai H., Okabe S., Kobayashi T., “Fast 3D visualization of endogenous brain signals with high-sensitivity laser scanning photothermal microscopy,” Biomed. Opt. Express 7(5), 1702–1710 (2016). 10.1364/BOE.7.001702 [DOI] [PMC free article] [PubMed] [Google Scholar]
- 12.Miyazaki J., Toumon Y., “Experimental evaluation of temperature increase and associated detection sensitivity in shot noise-limited photothermal microscopy,” Opt. Commun. 430, 170–175 (2019). 10.1016/j.optcom.2018.08.007 [DOI] [Google Scholar]
- 13.Miyazaki J., Tsurui H., Kawasumi K., Kobayashi T., “Sensitivity enhancement of photothermal microscopy with radially segmented balanced detection,” Opt. Lett. 40(4), 479–482 (2015). 10.1364/OL.40.000479 [DOI] [PubMed] [Google Scholar]
- 14.Miyazaki J., Tsurui H., Kawasumi K., Kobayashi T., “Simultaneous dual-wavelength imaging of nonfluorescent tissues with 3D subdiffraction photothermal microscopy,” Opt. Express 23(3), 3647–3656 (2015). 10.1364/OE.23.003647 [DOI] [PubMed] [Google Scholar]
- 15.Miyazaki J., “Improvement of signal-to-noise ratio in photothermal microscopy by optimizing detection aperture,” Opt. Commun. 390, 99–104 (2017). 10.1016/j.optcom.2016.12.074 [DOI] [Google Scholar]
- 16.Okada M., Smith N. I., Palonpon A. F., Endo H., Kawata S., Sodeoka M., Fujita K., “Label-free Raman observation of cytochrome c dynamics during apoptosis,” Proc. Natl. Acad. Sci. U. S. A. 109(1), 28–32 (2012). 10.1073/pnas.1107524108 [DOI] [PMC free article] [PubMed] [Google Scholar]
- 17.Gao W. H., Pu Y. M., Luo K. Q., Chang D. C., “Temporal relationship between cytochrome c release and mitochondrial swelling during UV-induced apoptosis in living HeLa cells,” J. Cell Sci. 114, 2855–2862 (2001). [DOI] [PubMed] [Google Scholar]
- 18.Wong Y. C., Ysselstein D., Krainc D., “Mitochondria-lysosome contacts regulate mitochondrial fission via RAB7 GTP hydrolysis,” Nature 554(7692), 382–386 (2018). 10.1038/nature25486 [DOI] [PMC free article] [PubMed] [Google Scholar]
- 19.Audano M., Schneider A., Mitro N., “Mitochondria, lysosomes, and dysfunction: their meaning in neurodegeneration,” J. Neurochem. 147(3), 291–309 (2018). 10.1111/jnc.14471 [DOI] [PubMed] [Google Scholar]
- 20.Andersson H., Baechi T., Hoechl M., Richter C., “Autofluorescence of living cells,” J. Microsc. 191(1), 1–7 (2002). 10.1046/j.1365-2818.1998.00347.x [DOI] [PubMed] [Google Scholar]
- 21.Fujiwara Y., Wada K., Kabuta T., “Lysosomal degradation of intracellular nucleic acids-multiple autophagic pathways,” J. Biochem. 161, 145–154 (2016). 10.1093/jb/mvw085 [DOI] [PubMed] [Google Scholar]
- 22.Saito T., Sadoshima J., “Molecular mechanisms of mitochondrial autophagy/mitophagy in the heart,” Circ. Res. 116(8), 1477–1490 (2015). 10.1161/CIRCRESAHA.116.303790 [DOI] [PMC free article] [PubMed] [Google Scholar]
- 23.Platt F. M., Boland B., van der Spoel A. C., “The cell biology of disease: lysosomal storage disorders: the cellular impact of lysosomal dysfunction,” J. Cell Biol. 199(5), 723–734 (2012). 10.1083/jcb.201208152 [DOI] [PMC free article] [PubMed] [Google Scholar]
- 24.Pu J., Guardia C. M., Keren-Kaplan T., Bonifacino J. S., “Mechanisms and functions of lysosome positioning,” J. Cell Sci. 129(23), 4329–4339 (2016). 10.1242/jcs.196287 [DOI] [PMC free article] [PubMed] [Google Scholar]
- 25.Jordens I., Fernandez-Borja M., Marsman M., Dusseljee S., Janssen L., Calafat J., Janssen H., Wubbolts R., Neefjes J., “The Rab7 effector protein RILP controls lysosomal transport by inducing the recruitment of dynein-dynactin motors,” Curr. Biol. 11(21), 1680–1685 (2001). 10.1016/S0960-9822(01)00531-0 [DOI] [PubMed] [Google Scholar]
- 26.Elbaz-Alon Y., Rosenfeld-Gur E., Shinder V., Futerman A. H., Geiger T., Schuldiner M., “A Dynamic Interface between Vacuoles and Mitochondria in Yeast,” Dev. Cell 30(1), 95–102 (2014). 10.1016/j.devcel.2014.06.007 [DOI] [PubMed] [Google Scholar]
- 27.Honscher C., Mari M., Auffarth K., Bohnert M., Griffith J., Geerts W., van der Laan M., Cabrera M., Reggiori F., Ungermann C., “Cellular Metabolism Regulates Contact Sites between Vacuoles and Mitochondria,” Dev. Cell 30(1), 86–94 (2014). 10.1016/j.devcel.2014.06.006 [DOI] [PubMed] [Google Scholar]
- 28.Todkar K., Ilamathi H. S., Germain M., “Mitochondria and Lysosomes: Discovering Bonds,” Front. Cell Dev. Biol. 5, 106 (2017). 10.3389/fcell.2017.00106 [DOI] [PMC free article] [PubMed] [Google Scholar]


