Abstract
This cross-sectional study weighs the proportional associations of rising drug costs and use with increased Medicare Part D spending for a cohort of oral anticancer drugs used from 2013 through 2017.
Increased spending on oral anticancer drugs should ideally be driven by increased use because of rising access to care and expanding drug indications.1,2 Yet, prices have risen faster than inflation and are not necessarily reflective of novelty or efficacy.2,3 This study weighs the proportional associations of rising drug costs and use with increased Medicare Part D spending for a cohort of oral anticancer drugs used from 2013 through 2017.
Methods
Partners Human Research Committee at Partners Healthcare deemed this study to be exempt from review owing to use of publicly available, deidentified data. This study followed Strengthening the Reporting of Observational Studies in Epidemiology (STROBE) reporting guidelines. Drugs on CareFirst’s 2017 list of oral anticancer drugs that have cancer as the only on-label medical indication were searched in the 2013-2017 Medicare Part D Prescriber Public Use File National Summary Reports, which include Medicare beneficiaries in Medicare Advantage and stand-alone drug plans.4 Drugs with complete data that were prescribed in all 5 years were included to assess the relative contributions of drug cost and use to change in overall spending during a comparable time period for each drug. Trademarked and generic compounds were included as distinct entities. Calculations included trends in spending, use, and average drug cost per beneficiary treated. Spending in 2017 was calculated in 2 scenarios: (1) if mean drug cost per beneficiary remained the same as in 2013 and (2) if use, or the number of patients treated, remained the same as in 2013. These values were compared to determine the proportion of 2017 spending attributed to changes in cost and use. Dollars in 2013 through 2016 were inflation-adjusted to 2017 dollars.
Results
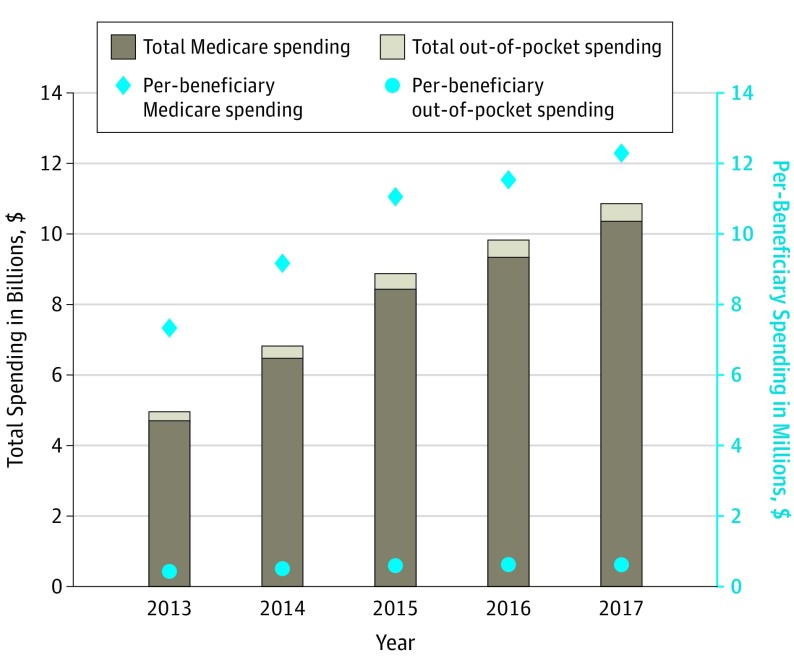
From 2013 through 2017, more than $41.4 billion was spent on the 56 included oral anticancer drugs. Average annual out-of-pocket costs per drug were $551, which amounted to $2.1 billion total from 2013 through 2017. Annualized spending increased 118% from $5.0 billion in 2013 to $10.9 billion in 2017 (Figure 1). Increased drug costs accounted for 56% of the $5.9 billion rise in annualized spending, while increased use accounted for 44%.
Figure 1. Rising Total and per-Beneficiary Spending on Oral Anticancer Drugs From 2013 Through 2017.
Total and per-beneficiary spending increased each year from 2013 through 2017, though the rate of increase declined each year. Out-of-pocket costs accounted for a comparatively consistent and small proportion of total spending, both at the aggregate and per-beneficiary level, when compared with Medicare costs.
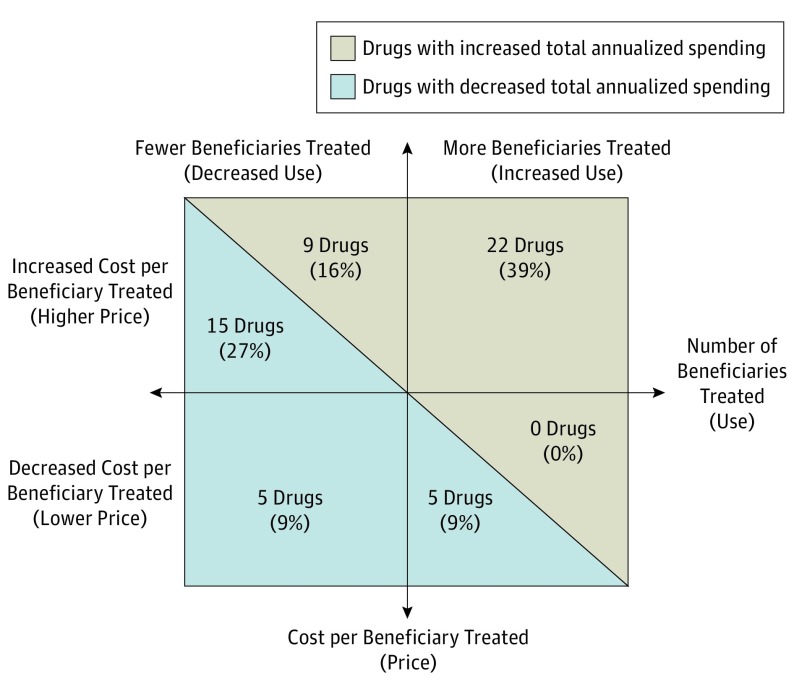
Drug cost per beneficiary treated had a compound annual growth rate of 13% above inflation, rising 66% over the study period. Almost one-quarter of the drugs (13 of 56 [23%]) were more expensive per beneficiary by 2017 than the most expensive one in 2013 (Gleevec). Changes in drug cost were larger in magnitude by an average of $1.9 million per drug for the 46 drugs that rose in cost than the 10 drugs that decreased in cost (Figure 2). Use rose 32% from an average of 11 426 beneficiaries treated per drug in 2013 to 15 051 in 2017. The rate of growth in total annualized spending, drug cost per beneficiary, and use decelerated on average by 6.7%, 4.6%, and 1.5% per year, respectively.
Figure 2. Factors Associated With Change in Spending for Oral Anticancer Drugs From 2013 Through 2017.
This 4-quadrant chart indicates the associations of drug cost per beneficiary treated and use (number of beneficiaries treated) with the rise or decline of total annualized spending for 56 drugs from 2013 through 2017.
Discussion
Annualized spending on the same oral anticancer drugs more than doubled in a 5-year period. Use increased substantially, likely owing to expanding drug indications, increased Medicare Part D enrollment, and declining cancer mortality yielding longer treatment courses. However, increased spending was predominantly driven (56%) by rising drug costs, which is reflective of pharmaceutical pricing strategies. From 2007 through 2013, anticancer drug prices increased 5% above inflation annually, plus 10% per subsequent indication approved.5 Results of this study demonstrated a continued rise from 2013 through 2017 with a compound annual growth rate of 13% above inflation for drug cost per beneficiary. High drug prices on market entry are often attributed to research and development expenses, though research and development may not explain the subsequent increases in drug costs demonstrated in this study.6 Policy makers should consider capping price increases at a set percentage beyond inflation, especially given that rising use reflects increased need for these therapies. Further studies should assess whether costs are offset by savings from decreased inpatient or infusion therapy, the influence of price on use, and whether patient demographics correspond with use.
References
- 1.Dusetzina SB. Drug pricing trends for orally administered anticancer medications reimbursed by commercial health plans, 2000-2014. JAMA Oncol. 2016;2(7):960-961. doi: 10.1001/jamaoncol.2016.0648 [DOI] [PubMed] [Google Scholar]
- 2.Mailankody S, Prasad V. Five years of cancer drug approvals: innovation, efficacy, and costs. JAMA Oncol. 2015;1(4):539-540. doi: 10.1001/jamaoncol.2015.0373 [DOI] [PubMed] [Google Scholar]
- 3.Dusetzina SB, Huskamp HA, Keating NL. Specialty drug pricing and out-of-pocket spending on orally administered anticancer drugs in Medicare Part D, 2010 to 2019. JAMA. 2019;321(20):2025-2027. doi: 10.1001/jama.2019.4492 [DOI] [PMC free article] [PubMed] [Google Scholar]
- 4.Oral chemotherapy drugs. CareFirst. https://member.carefirst.com/carefirst-resources/pdf/oral-chemotherapy-drug-list-sum2714.pdf. Published 2017. Accessed June 2, 2019.
- 5.Bennette CS, Richards C, Sullivan SD, Ramsey SD. Steady increase in prices for oral anticancer drugs after market launch suggests a lack of competitive pressure. Health Aff (Millwood). 2016;35(5):805-812. doi: 10.1377/hlthaff.2015.1145 [DOI] [PubMed] [Google Scholar]
- 6.Prasad V, Mailankody S. Research and development spending to bring a single cancer drug to market and revenues after approval. JAMA Intern Med. 2017;177(11):1569-1575. doi: 10.1001/jamainternmed.2017.3601 [DOI] [PMC free article] [PubMed] [Google Scholar]


