Abstract
Elucidating the metabolic changes that accompany disease states via metabolomics analysis of tissues has become an important avenue of exploration in biomarker and therapeutic target discovery. Conventional harvesting techniques rely on post-euthanasia tissue harvest which introduces ischemic conditions and subsequent metabolome changes that may ultimately introduce artifacts into final analyses. In this chapter, we present protocols for low-ischemia time rapid kidney tissue harvest followed by metabolite extraction for metabolomics studies in rodents.
1. Introduction
The mammalian kidney is a complex organ with marked intrinsic metabolic activity and high energy demands, consuming the second highest amount of oxygen per gram of tissue (2.7mmol/kg/min) (Cohen, 1979). Most of nephronal energy utilization is related to epithelial transport (Na+-K+-ATPase), which determines the volume and composition of urine, and in addition to differences in oxygen tensions and osmotic environments, varies widely among the distinct segments (Katz, Doucet, & Morel, 1979). As such, the distribution of ATP producing mitochondria parallels the distribution of the ATP-consuming sodium pumps among different renal epithelial cells (Pfaller & Rittinger, 1980). Interestingly, different segments have been shown to have distinct preferences for ATP producing substrates, and a wide distribution of metabolic enzymes have been reported along the nephron (Guder & Ross, 1984). But in addition to its own complex metabolic activity, the kidneys have the potential to directly influence systemic metabolism, and directly regulate circulating metabolite levels through glomerular filtration, tubular secretion or net production. Disruptions in renal and systemic metabolism may initiate a vicious cycle that causes and perpetuates renal disease. Not surprisingly, more and more evidence has emerged suggesting abnormalities in distinct metabolic pathways are associated with the pathogenesis and progression of many kidney diseases (Grams et al., 2017; Sharma et al., 2013; Weiss & Kim, 2012; Wettersten & Weiss, 2013).
While the identification and use of kidney-related metabolites dates back several centuries, recent advances in analytical techniques and analyses have facilitated the global characterization and roles of metabolites in kidney diseases. Metabolomics, a relatively new omics technology, is utilized to simultaneously determine multiple metabolite concentrations in a particular solid tissue or biofluid from a living organism (Nicholson & Lindon, 2008). By providing real-time assessment of subtle differences to organism metabolism, it offers the potential to reveal the underlying mechanisms associated with disease from early stages. In addition, it is ideally suited for biomarker, as well as therapeutic target discovery, and provides a more unbiased and comprehensive view of the molecular changes that occur in disease states. Moreover, an individual’s overall phenotype is achieved and maintained by the sum of metabolic activities and the complex interactions between genotype, metabolic phenotype, and the environment. Thus, metabolomics analyses can provide a better characterization of an individual’s phenotype through the integration of genetics, epigenetic, transcriptomic, and proteomic variation, as well as other disease modifying factors such as dietary intake, physical activity, and environmental exposure.
While biofluids effectively integrate the metabolic changes that occur in a living organism, tissue samples can be used to determine organ-specific metabolic fingerprints. In addition, when properly performed, tissue metabolomics can provide a snap-shot of in-vivo metabolism. However, intracellular metabolite compositions can change rapidly during sample collection and preparation altering the analytical readout and subsequent conclusions of the metabolic state. In order to achieve accurate and reproducible results, it is necessary to adequately collect and prepare the sample to decrease artifacts confounding biological interpretation.
Metabolomics analysis in tissue involves organ/tissue harvest, temporary arrest of metabolic activity, metabolite extraction and analysis. Although metabolomics analysis of tissues is widely applied across multiple fields, most available studies focus on metabolite extraction and instrument analytic tools, with little information on methods for tissue harvesting and cessation of post-harvest metabolic activity; particularly for the kidneys. While all steps are essential to obtain an accurate metabolic profile, the initial phases of tissue sampling followed by rapid termination of metabolic activity are critical. Here, we describe procedures to harvest and freeze kidney tissue, followed by extraction of kidney tissue metabolites for metabolomics studies in rodents.
2. Kidney harvesting and freezing
2.1. Overview
One important consideration when designing animal studies involving metabolic analysis is the method of anesthesia and euthanasia used. Several studies have shown wide-ranging changes in tissue metabolite concentrations depending on whether animals are anesthetized or euthanized before tissue harvest. In rodents, kidneys are typically harvested after euthanasia, and flash frozen in liquid N2 to temporarily halt metabolism. While post euthanasia harvesting followed by snap freezing of the whole kidney is convenient and easy, this is a slow process and can take up to several minutes. Time consideration is highly important as it has been previously shown that many glycolytic metabolites have turnover times of a few seconds (<30s) with rapid changes in response to ischemia (Hems & Brosnan, 1970; Lowry et al., 1964). Furthermore, the time it takes to stop enzymatic activity by freezing depends on the size of the sample and can further impact metabolite concentrations. Thus, minimization of ischemia time, followed by rapid termination of enzyme activity is important to achieve an accurate readout of the metabolome.
2.2. Anesthesia vs euthanasia for kidney harvesting
In rodents, anesthesia is administered via two methods: injection (ketamine, or pentobarbital) or inhalation (isoflurane) with each method carrying advantages and disadvantages. Injectable anesthetics are easy to administer, relatively inexpensive, and do not require specific equipment. However, the depth of anesthesia follows a time-dependent curve and is less predictable in longer procedures. Inhalants or gas anesthesia can achieve a more stable and predictable anesthetic depth but requires access to or investment in anesthetic machine/precision vaporizers. Nevertheless, most variability related to metabolic changes is associated with how rapidly tissues can be harvested after anesthesia induction and becomes more important in longer procedures (Brunner, Cheng, & Berman, 1975; La Monaca & Fodale, 2012). On the other hand, the hypoxia induced by euthanasia is responsible for faster and more dramatic metabolite changes (Overmyer et al., 2015). The harvesting of the kidney under anesthesia, in accordance with ethical standards and animal welfare, ensures continuous blood supply to the organ until removal and ultimately reduces ischemic changes. Due to the ease, availability and short duration of the procedure, we prefer the injectable ketamine in combination with xylazine. In any case, the anesthetic of choice and the method for tissue harvest should be consistent between experimental animals and appropriately documented.
2.3. Snap freezing vs clamp freezing
In addition to metabolic changes induced by hypoxia, metabolite concentration can change due to rapid degradation and sensitivity to factors such as temperature, pH. etc. Therefore, any additional delays between tissue harvest and complete quenching of cellular metabolism contribute to alterations in metabolite profile.
Previous studies have determined the relationship between freezing time and tissue size. For a kidney sample of 500mg (average mouse kidney weight ~200mg, rat ~1g), it would take 25s for the innermost part to reach 0 °C using N2 (Faupel et al., 1972). This delay in temperature drop is attributed to low thermal conductivity of the tissue, and the Leidenfrost effect. The use of other refrigerants such as isopentane can reduce freezing time by overcoming the Leidenfrost effect. Yet, this is less practical and freezing time remains longer than 15s. A solution to overcome issues due to low thermal conductivity is to increase refrigerant-exposed surface area by flattening the tissue between pre-cooled aluminum blocks as in the clamp freezing technique developed by Wollenberger, Ristau, and Schoffa (1960). This simple technique allows the resulting intracellular metabolome measurement to resemble the in vivo state as close as possible, and should be preferred for freezing kidney samples for metabolic analysis.
2.4. Materials and reagents for terminal procedures
Ketamine and xylazine
1mL syringe for intraperitoneal (IP) anesthetics
Animal scale
Dissection tools: pointed scissors, forceps, Kelly forceps, curved forceps, scalpel
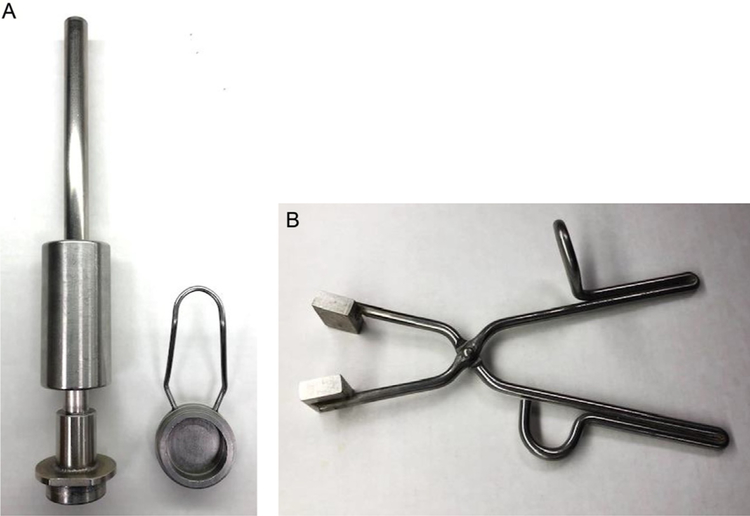
Aluminum tissue pulverizer or aluminum tissue clamp (Fig. 1A and B)
Container with dry-ice
Container filled liquid N2
Heat pad or heat lamp for intra-procedural thermal regulatory support
Betadine
Electrical clippers
FIG. 1.
Tissue pulverizer and clamp. A N2 pre-cooled tissue pulverizer (A) is used to flatten the kidney and reduce freezing time. The tissue pulverizer is made of aluminum and consists of a 5cm base where the kidney is placed immediately after excision, and fits a special piston that is used to flatten the kidney. Once the kidney is flat-frozen it can be pulverized using the same device. Alternatively, a N2 pre-cooled tissue clamp (B) can be used to compressed and freeze the kidney immediately after excision, but would require the use of a tissue pulverizer to grind the tissue before proceeding with metabolite extraction. The tissue clamp is 10in. long and has a 5 by 4-cm surface by 8-mm deep aluminum block at both ends.
2.5. Experimental setup and animal preparation
Before starting any procedures with live animals, experimental protocols should be approved by the institutional animal care and use committee (IACUC). If animals were subjected to any procedure such as imaging or metabolic cages, it is important to return animals to their usual environment and let them acclimate for at least 12h.
Weigh animals to prepare needed amount of anesthetic. For general surgical procedures in mice, an induction dose of ketamine (90–120mg/kg) combined with xylazine (10mg/kg) via IP injection is recommended. In rats, ketamine (40–80mg/kg) combined with xylazine (5–10mg/kg) via intraperitoneal IP injection.
Mix anesthetic medications into a cocktail; do not administer individually.
Induce rodent with ketamine/xylazine via IP injection.
Allow 8–10min of quiet induction time.
Prepare aluminum tissue pulverizer or aluminum clamp by allowing to cool in liquid N2.
Once rodent is anesthetized, prepare the surgical site by shaving the fur using electrical clippers and scrubbing the skin with betadine.
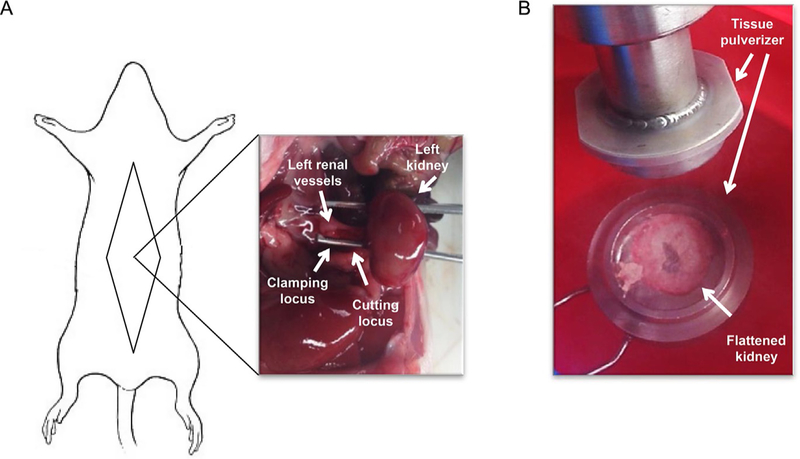
2.6. Surgery for kidney harvesting and freezing (Fig. 2)
FIG. 2.
Surgery for kidney harvesting and freezing. (A) Schematic representation of an anesthetized rodent positioned for kidney harvest surgery and image of left kidney after dissection of vessels and kidney decapsulation. (B) Photograph of left kidney flattened after clamp-freezing.
-
2.6.1.
Before proceeding with surgery, reassess level of anesthesia by toe-pinch, to ensure a surgical depth of anesthesia.
-
2.6.2.
Monitor respiratory rate and effort, at regular intervals during the procedure.
-
2.6.3.
Grasp lower abdominal skin with forceps, and perform a medial laparotomy through all layers. Grasp again and extend laparotomy to sides as needed.
-
2.6.4.
Dissect abdominal organs until kidney is exposed.
-
2.6.5.
Dissect renal vessels and decapsulate the kidney.
-
2.6.6.
Move tissue pulverizer into container with dry-ice.
-
2.6.7.
Clamp renal vessels and cut to excise kidney.
-
2.6.8.
Immediately drop and flatten freeze kidney in pre-cooled tissue pulverizer. Alternatively, kidney can be freeze-clamped in situ using N2 pre-cooled aluminum clamps. Apply pressure for 20s to allow complete freezing of the kidney.
-
2.6.9.
Preserve frozen tissue in liquid N2 until sample preparation.
-
2.6.10.
Proceed with blood and other organ collection as needed.
3. Metabolite extraction
3.1. Overview
Once cellular metabolism has been stopped, metabolites need to be extracted from the intracellular compartment. Metabolite extraction can be performed by several methods, and the choice of the most suitable is another critical step. An ideal method for metabolite extraction should be reproducible, and extract a similar amount of different metabolites while preventing further degradation. The method is usually chosen depending on the type of metabolites of interest. In our hands, three metabolite extraction protocols, perchloric acid (PCA), methanol/chloroform/water (MCW) and methanol/acetone/water (MAW) perform well. However, the PCA protocol, used for water soluble and labile metabolites, halts metabolic reactions, is amenable to the use of different analytical tools such as 1H NMR, HPLC, or GC–MS, and is the most reproducible among operators (Klawitter et al., 2007).
3.2. Materials and reagents
Scale
Frozen tissue
Liquid nitrogen
Wet ice
Dry ice
Eppendorf® Safe-Lock microcentrifuge tubes × 3 sets (EP-022363204)
Tissue grinder (Sigma-Aldrich Z359971)
Pellet pestle (Z359947 or Z359963)
0.6M HClO4 solution (Sigma-Aldrich 311421)
2M KHCO3
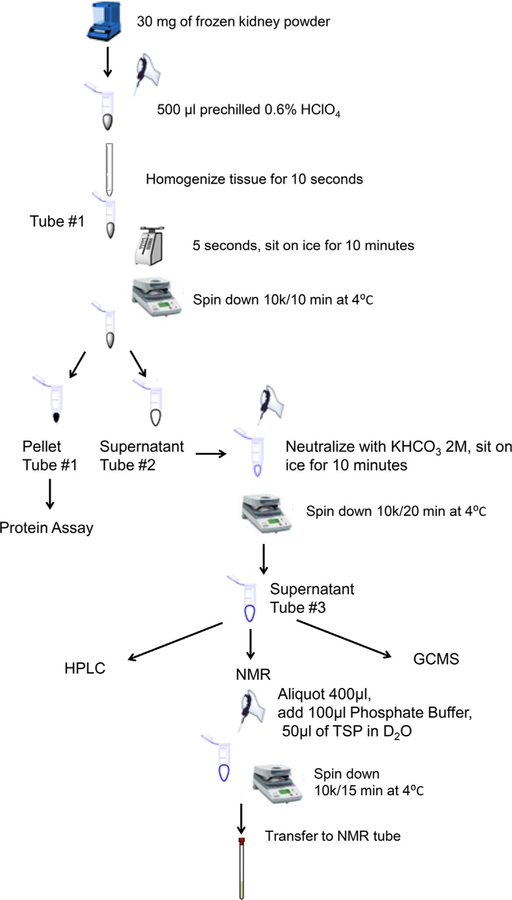
3.3. Experimental setup (Fig. 3)
FIG. 3.
Schematic diagram of kidney metabolite extraction procedure.
-
3.3.1.
Grind frozen kidney in N2 pre-cooled tissue pulverizer.
-
3.3.2.
Aliquot 30mg of frozen tissue powder.
-
3.3.3.Homogenize the tissue in 0.5mL of ice-cooled 6% HClO4:
-
3.3.3.1.Ice-cool Eppendorf tube #1
-
3.3.3.2.Pipet 0.5mL HClO4 into tube #1
-
3.3.3.3.Pour tissue powder
-
3.3.3.4.Homogenize tissue for 10s
-
3.3.3.1.
-
3.3.4.
Vortex tube #1 for 5s and place on ice for 10min/
-
3.3.5.
Centrifuge for 10min at 10,000 × g at 4 °C.
-
3.3.6.
Transfer supernatant to ice-cooled Eppendorf tube #2. Keep the pellet from tube #1 for protein assay.
-
3.3.7.
Neutralize the supernatant to pH 7.0 with ice-cooled KHCO3 2M (30μL/100μL HClO4) and leave for 10min on ice to precipitate the potassium perchlorate salts, taking care to add KHCO3 slowly to avoid loss of sample during effervescence. Check and adjust the pH if necessary.
-
3.3.8.
Centrifuge tube #2 for 20min at 10,000 × g at 4 °C and transfer supernatant to tube #3.
-
3.3.9.
Prepare sample from tube #3 for NMR, HPLC or GCMS as described below.
4. Analysis of metabolite extraction
Proper tissue extraction can be evaluated by adenine nucleotide ATP, ADP and AMP ratios and levels using High Performance Liquid Chromatography (HPLC). Nucleotides in the supernatant are separated on a reversed-phase Discovery C18 column (SIGMA, St. Louis, MO) with the Hewlett-Packard series 1100 HPLC system (Agilent, Santa Clara, CA). Briefly, a phosphate buffer with tetrabutylammonium sulfate and methanol mixture is used as mobile phase at 0.7mL/min flow rate. A gradient elution is applied and the separation of nucleotides completed in 20min. The nucleotide levels are normalized by mg tissue weight.
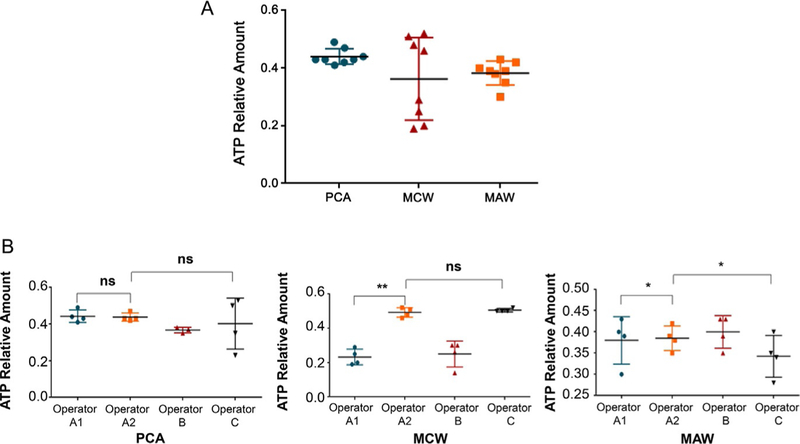
When we compared three different extraction protocols, PCA, MCW, and MAW, the ATP/ADP and AMP/ATP ratios for each of the three extraction protocols were found to be comparable by HPLC analysis (Table 1; Fig. 4A). However, the PCA protocol had the least interoperator variability and was the most reproducible among three different operators (Fig. 4B).
Table 1.
Performance of tissue extraction protocols.
| PCA | MCW | MAW | |
|---|---|---|---|
| ATP/ADP | 1.66 | 1.49 | 0.99 |
| AMP/ATP | 0.27 | 0.41 | 1.12 |
PCA, perchloric acid/water; MCW, methanol/chloroform/water; MAW, methanol/acetonitrile/water.
FIG. 4.
Analysis of metabolite extraction and intra, inter-observer variability. Three metabolite extraction protocols perform well for kidney metabolites (A), but the PCA protocol has the least interoperator variability and is the most reproducible among three different operators (B). PCA: perchloric acid; MCW: methanol/chloroform/water; MAW: methanol/acetone/water. *P <0.05 and **P <0.01.
5. Sample profiling with different analytic technologies
5.1. Overview
There are two main analytic technologies that are currently used for metabolomics analysis: nuclear magnetic resonance (NMR) spectroscopy, and gas chromatography-mass spectroscopy (GC–MS). Each of these platforms has its advantages and disadvantages and should be considered complementary rather than exclusive, considering no unique methodology can provide full coverage of the entire metabolome in a given sample (Beckonert et al., 2007). The combined application of NMR spectroscopy and GC–MS allows the identification of a more comprehensive metabolic profile compared to the use of each single platform alone.
5.2. NMR-based analysis
NMR has extensively been used for monitoring metabolic changes in vitro, ex-vivo and non-invasively in-vivo. The advantages of NMR are that is non-destructive, highly discriminatory and can quantify compounds without the requirement for extensive sample clean up. Urine samples are the ones that require the least sample preparation. Plasma and tissue samples require protein extraction to avoid small-molecule signal interference by macromolecule signals. Large water signals typically overpower smaller desired signals and must be suppressed. While NMR spectroscopy allows for the simultaneous quantification of 20–50 metabolites sensitivity is a limiting factor. The sensitivity depends on the natural abundance of the nucleus studied (1H, 31P or 13C) and the concentration of the detectable isotopes that the cell culture, animal or human has been exposed to.
5.2.1. Materials and reagents
Savant™ SC210 P1 SpeedVac™ (Thermo Fisher Scientific SC210P1-115)
5mm NMR tubes (Bruker 5 × 103.5-S-0,38)
Phosphate buffer solution: K2HPO4/KH2PO4, adjusted to pH 7.4 with concentrated HCl
NMR reference solution: 1mM TSP-d4 (Sigma 269913) solution in D2O (Sigma 613444)
5.2.2. Sample preparation
-
5.2.2.1.
Aliquot 400μL of tissue extract
-
5.2.2.2.
Add 100μL of 0.1M phosphate buffer and 50μL of 1mM TSP-d4 solution in D2O.
-
5.2.2.3.
Vortex samples for 20s.
-
5.2.2.4.
Centrifuge for 15min at 10,000 × g at 4 °C.
-
5.2.2.5.
Transfer to 5mm NMR tubes.
5.2.3. Spectra acquisition and analysis
The 1H NMR spectra can be acquired on a Bruker 600MHz Avance III HD spectrometer equipped with a BBO cryoprobe and SampleCase auto sampler (Bruker Biospin, Rheinstetten, Germany). The 1H NMR spectra can be recorded using 1D NOESY pulse sequence with presaturation (noesygppr1d), with 90-degree pulse (~13μs), 4.68s acquisition time, and 4s relaxation delay. The spectra can be phase and baseline corrected using the Topspin 3.5 software. Metabolites can be identified and quantified using the software program Chenomx NMR Suite 8.2, by fitting the spectral lines of library compounds into the recorded NMR spectrum of the tissue extracts. The quantification is based on peak area of the TSP-d4 signal.
5.3. GC–MS-based analysis
Mass spectroscopy depends on the ionization of the analyte followed by the determination of the intensity of the ion produced, which is registered according to mass-to-charge ratios (m/z). Chromatographic separation precedes the mass analyzer and increases selectivity while decreasing potential ion suppression effects in the mass analyzer. GC–MS provides robust analyte separation and can identify between 100 and 300 metabolites. The number and type of metabolites depends not only on the extraction procedure but also on the ionization technology used. One disadvantage of GC–MS is that it requires more extensive sample preparation due to the presence of volatile metabolites.
5.3.1. Materials and reagents
Savant™ SC210 P1 SpeedVac™ (Thermo Fisher Scientific SC210P1-115)
MOXTM Regent (Thermo Fisher Scientific TS-45950)
MSTFA + 1% TMCS (Thermo Fisher Scientific TS-48915)
5.3.2. Sample preparation
-
5.3.2.1.
Dry tissue extract in a SpeedVac concentrator
-
5.3.2.2.
Methoximate using 10μL of a 20mg/mL solution of MOX™ Regent at 30 °C for 90min.
-
5.3.2.3.
Derivatize using 40μL of MSTFA + 1% TMCS (N-methyl-N-trimethylsilyltrifluoroacetami de with 1% trimethylchlorosilane) at 37 °C for 30min.
5.3.3. Spectra acquisition and analysis
Metabolite levels can be determined using GC–MS (Hewlett-Packard, HP 5980B) with DB5-MS column. GC–MS spectra are deconvoluted using AMDIS software, and the SpectConnect software is used to create metabolite peaks matrix. The Agilent Fiehn GC/MS Metabolomics RTL Library is used for metabolite identifications. Total ion current (TIC) is used for analysis of the relative abundance of the metabolites.
6. Representative results related to hypoxia and freezing delay in rodent kidney
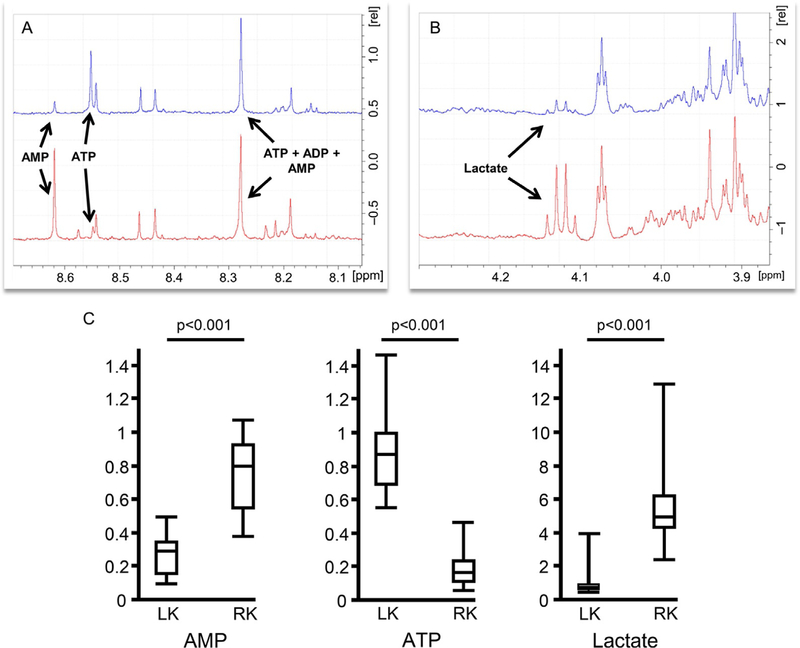
To determine the effects of hypoxia and freezing delay on kidney metabolite concentration, we collected the left and right kidney from the same rodent using two different harvesting techniques. The left kidney was collected under anesthesia followed by immediate clamp-freeze, while the right kidney was collected after cardiac puncture and blood collection followed by snap freezing. By harvesting the kidney with the rodent under anesthesia we were able to reduce ischemia time from an average of 5min to 7s, which is the average time lapse between clamping of the renal vessels and placement of the kidney in tissue pulverizer. The flattening of the kidney to half of its original size by using the N2 pre-cooled tissue pulverizer reduced the freezing time from 55 to 9s. Therefore, harvesting of the kidney with the rodent under anesthesia followed by free-clamping allows stopping metabolic activity in an average of 16s compared to ~6min of post-euthanasia kidney harvest followed by snap freezing. This time difference was sufficient to yield significant changes in the metabolic profile, particularly with metabolites known to be oxygen-dependent such as ATP, AMP and lactate (Fig. 5B).
FIG. 5.
Metabolite concentration in relation to kidney harvesting and freezing technique. 1D 1H NMR scan, post exponential coefficient Fourier transformation and phase adjustment illustrating differences in (A) ATP, AMP and (B) lactate concentrations between kidney harvested under anesthesia followed by clamp freezing (blue) and kidney harvested port euthanasia followed by snap freeze (red). (C) Box plot displaying lactate, AMP and ATP concentrations (nM). Box represents first and third quartiles, whiskers depict minimum and maximum.
7. Conclusion
In this chapter, we aim to provide guidance for kidney harvesting, freezing and metabolite extraction techniques for metabolomics analysis in rodents, and raise awareness on the importance of these aspects to ensure fidelity and reproducibility of results. Sample collection and preparation is critical in metabolomics analysis. One of the main goals of ex-vivo kidney metabolomics is to recapitulate as close as possible the in-vivo animal metabolic profile. However, factors known to affect metabolite concentrations should be minimized in order to achieve a reliable metabolic profile. The harvesting of the kidney with the rodent under a surgical level of anesthesia followed by immediate clamp freezing allows a continuous blood supply to the organ while minimizing freezing time and should be considered “gold standard” for metabolic studies in rodents. Although the type of anesthesia may add variation to the metabolic profile, it is the time to harvest and freeze of the organ aspect that affects the metabolome the most. Following a standardized protocol and attention to these details is necessary to accurately generate findings that can then be reliably interpreted.
Acknowledgments
This work is supported by the National Institutes of Health grant DK118391 to M.V.I., the nuSURF Program (DK101405) and the Mayo Translational Polycystic Kidney Disease Center (NIDDK P30 DK090728).
References
- Beckonert O, et al. (2007). Metabolic profiling, metabolomic and metabonomic procedures for NMR spectroscopy of urine, plasma, serum and tissue extracts. Nature Protocols, 2(11), 2692–2703. [DOI] [PubMed] [Google Scholar]
- Brunner EA, Cheng SC, & Berman ML (1975). Effects of anesthesia on intermediary metabolism. Annual Review of Medicine, 26, 391–401. [DOI] [PubMed] [Google Scholar]
- Cohen JJ (1979). Is the function of the renal papilla coupled exclusively to an anaerobic pattern of metabolism? The American Journal of Physiology, 236(5), F423–F433. [DOI] [PubMed] [Google Scholar]
- Faupel RP, et al. (1972). The problem of tissue sampling from experimental animals with respect to freezing technique, anoxia, stress and narcosis. A new method for sampling rat liver tissue and the physiological values of glycolytic intermediates and related compounds. Archives of Biochemistry and Biophysics, 148(2), 509–522. [DOI] [PubMed] [Google Scholar]
- Grams ME, et al. (2017). Metabolomic alterations associated with cause of CKD. Clinical Journal of the American Society of Nephrology, 12(11), 1787–1794. [DOI] [PMC free article] [PubMed] [Google Scholar]
- Guder WG, & Ross BD (1984). Enzyme distribution along the nephron. Kidney International, 26(2), 101–111. [DOI] [PubMed] [Google Scholar]
- Hems DA, & Brosnan JT (1970). Effects of ischaemia on content of metabolites in rat liver and kidney in vivo. The Biochemical Journal, 120(1), 105–111. [DOI] [PMC free article] [PubMed] [Google Scholar]
- Katz AI, Doucet A, & Morel F (1979). Na-K-ATPase activity along the rabbit, rat, and mouse nephron. The American Journal of Physiology, 237(2), F114–F120. [DOI] [PubMed] [Google Scholar]
- Klawitter J, et al. (2007). Development and validation of an assay for the quantification of 11 nucleotides using LC/LC-electrospray ionization-MS. Analytical Biochemistry, 365(2), 230–239. [DOI] [PubMed] [Google Scholar]
- La Monaca E, & Fodale V (2012). Effects of anesthetics on mitochondrial signaling and function. Current Drug Safety, 7(2), 126–139. [DOI] [PubMed] [Google Scholar]
- Lowry OH, et al. (1964). Effect of ischemia on known substrates and cofactors of the glycolytic pathway in brain. The Journal of Biological Chemistry, 239, 18–30. [PubMed] [Google Scholar]
- Nicholson JK, & Lindon JC (2008). Systems biology: Metabonomics. Nature, 455(7216), 1054–1056. [DOI] [PubMed] [Google Scholar]
- Overmyer KA, et al. (2015). Impact of anesthesia and euthanasia on metabolomics of mammalian tissues: Studies in a C57BL/6J mouse model. PLoS One:10(2), e0117232. [DOI] [PMC free article] [PubMed] [Google Scholar]
- Pfaller W, & Rittinger M (1980). Quantitative morphology of the rat kidney. The International Journal of Biochemistry, 12(1–2), 17–22. [DOI] [PubMed] [Google Scholar]
- Sharma K, et al. (2013). Metabolomics reveals signature of mitochondrial dysfunction in diabetic kidney disease. Journal of the American Society of Nephrology: JASN, 24(11), 1901–1912. [DOI] [PMC free article] [PubMed] [Google Scholar]
- Weiss RH, & Kim K (2012). Metabolomics in the study of kidney diseases. Nature Reviews. Nephrology, 8(1), 22–33. [DOI] [PubMed] [Google Scholar]
- Wettersten HI, & Weiss RH (2013). Applications of metabolomics for kidney disease research: From biomarkers to therapeutic targets. Organogenesis, 9(1), 11–18. [DOI] [PMC free article] [PubMed] [Google Scholar]
- Wollenberger A, Ristau O, & Schoffa G (1960). A simple technic for extremely rapid freezing of large pieces of tissue. Pflügers Archiv für die Gesamte Physiologie des Menschen und der Tiere, 270, 399–412. [PubMed] [Google Scholar]


