

Abstract
The cholinergic basal forebrain (CBF), comprising different groups of cortically projecting cholinergic neurons, plays a crucial role in higher cognitive processes and has been implicated in diverse neuropsychiatric disorders. A distinct corticotopic organization of CBF projections has been revealed in animal studies, but little is known about their organization in the human brain. We explored regional differences in functional connectivity (FC) profiles within the human CBF by applying a clustering approach to resting‐state functional magnetic resonance imaging (rs‐fMRI) data of healthy adult individuals (N = 85; 19–85 years). We further examined effects of age on FC of the identified CBF clusters and assessed the reproducibility of cluster‐specific FC profiles in independent data from healthy older individuals (N = 25; 65–89 years). Results showed that the human CBF is functionally organized into distinct anterior‐medial and posterior‐lateral subdivisions that largely follow anatomically defined boundaries of the medial septum/diagonal band and nucleus basalis Meynert. The anterior‐medial CBF subdivision was characterized by connectivity with the hippocampus and interconnected nodes of an extended medial cortical memory network, whereas the posterior‐lateral subdivision was specifically connected to anterior insula and dorsal anterior cingulate components of a salience/attention network. FC of both CBF subdivisions declined with increasing age, but the overall topography of subregion‐specific FC profiles was reproduced in independent rs‐fMRI data of healthy older individuals acquired in a typical clinical setting. Rs‐fMRI‐based assessments of subregion‐specific CBF function may complement established volumetric approaches for the in vivo study of CBF involvement in neuropsychiatric disorders.
Keywords: basal forebrain, connectivity‐based parcellation, functional clustering, functional connectivity, resting‐state functional MRI
1. INTRODUCTION
Nuclei of cholinergic neurons in the basal forebrain innervate the entire cerebral cortex and limbic structures such as the hippocampus (Luiten, Gaykema, Traber, & Spencer Jr., 1987; Mesulam, Mufson, Levey, & Wainer, 1983). Corticopetal signaling from the cholinergic basal forebrain (CBF) modulates neuronal activity in its cortical target regions and has been implicated in attentional processes as well as in synaptic plasticity, learning, and memory (Ballinger, Ananth, Talmage, & Role, 2016; Hasselmo & Sarter, 2011). Dysfunction of the CBF has been associated with a range of neuropsychiatric disorders, including schizophrenia (Sarter, Lustig, & Taylor, 2012), autism (Perry et al., 2001), Alzheimer's disease, and Lewy body disease (Rogers, Brogan, & Mirra, 1985; Whitehouse et al., 1982; Whitehouse, Hedreen, White 3rd, & Price, 1983).
According to Mesulam's nomenclature (Mesulam, Mufson, Levey, et al., 1983; Mesulam, Mufson, Wainer, & Levey, 1983), the CBF can be cytoarchitectonically subdivided from anterior to posterior into four main cell groups (Ch1–4), which reflect cholinergic neurons of the medial septum (MS, Ch1), the vertical (Ch2) and horizontal (Ch3) limb of the diagonal band of Broca (DB), and the nucleus basalis Meynert (NBM, Ch4). The NBM represents the largest cluster of cholinergic neurons within the CBF and can be further subdivided into anterior‐medial and anterior‐lateral (Ch4am, Ch4al), intermediate (Ch4i), and posterior (Ch4p) sections based on anatomo‐topographic characteristics. Evidence from axonal tracer studies in rodents and nonhuman primates indicates that CBF neurons project to the cortex in a distinct topographic organization. Thus, anterior‐medial cell clusters of the CBF project predominantly to the hippocampus and ventromedial cortical regions, whereas the projection density progressively shifts to lateral neocortical areas for more posterior‐lateral cell clusters (Bloem et al., 2014; Ghashghaei & Barbas, 2001; Luiten et al., 1987; Mesulam, Mufson, Levey, et al., 1983; Zaborszky et al., 2015). In the human brain, cholinergic cell clusters are arranged in a similar anatomic topography within the CBF (Hedreen, Struble, Whitehouse, & Price, 1984; Mesulam & Geula, 1988), and the cholinergic pathways emanating from the CBF travel through analogous fiber bundles to their cortical target areas (Kitt, Mitchell, DeLong, Wainer, & Price, 1987; Mesulam, Hersh, Mash, & Geula, 1992; Selden, Gitelman, Salamon‐Murayama, Parrish, & Mesulam, 1998). However, given that direct axonal tracing studies are not feasible in humans, little is known about the corticotopic organization of CBF projections in the human brain (Mesulam & Geula, 1988).
Over the last years, functional connectivity (FC) analysis of resting‐state functional magnetic resonance imaging (rs‐fMRI) data has emerged as a powerful in vivo tool to study interconnected neuronal systems and subcortical–cortical interactions in the human brain (Englot et al., 2017; Libby, Ekstrom, Ragland, & Ranganath, 2012; Roy et al., 2009; Zhang, Hu, Chao, & Li, 2016). This method has previously been used to characterize the FC profile of the NBM using a seed region derived from a cytoarchitectonically‐defined stereotactic atlas of CBF nuclei (Li et al., 2014; Zaborszky et al., 2008). Although this study provided unprecedented insight into the cortical connectivity of the NBM in the human brain, it was limited in scope by the focus on an a priori defined NBM seed region. More recently, connectivity differences between CBF subdivisions were explored using rs‐fMRI data from young adults (Markello, Spreng, Luh, Anderson, & De Rosa, 2018) but not yet across a wider age range or in an older population.
In the present study, we used FC‐based parcellation of the CBF as a well‐established data‐driven approach for studying FC characteristics of presumably functionally heterogeneous brain regions (Eickhoff, Thirion, Varoquaux, & Bzdok, 2015; Kahnt, Chang, Park, Heinzle, & Haynes, 2012; Mishra, Rogers, Chen, & Gore, 2014; Pascual et al., 2015; Zhang, Snyder, Shimony, Fox, & Raichle, 2010; Zhuo et al., 2016). Parcellation was based on a comprehensive cytoarchitectonically defined spatial outline of the CBF without predefined segments. Based on the distinct corticotopic organization of CBF projections observed in rodents and nonhuman primates, we hypothesized that the human CBF may be parcellated into at least two clearly functionally distinct subdivisions along its anterior–posterior axis that reflect the previously described preferential projections to hippocampus/ventromedial cortex and lateral neocortical areas, respectively. We then characterized the identified CBF FC profiles in relation to well‐described cortical functional networks (Yeo et al., 2011), examined negative effects of age on FC of the different CBF subdivisions, and assessed the reproducibility of subdivision‐specific FC patterns in independent rs‐fMRI data of healthy older individuals as acquired in a typical clinical setting.
2. MATERIALS AND METHODS
2.1. Subjects
Imaging data were obtained from the Nathan Kline Institute (NKI)/Rockland sample (Nooner et al., 2012), available through the International Neuroimaging Data‐Sharing Initiative (http://fcon_1000.projects.nitrc.org). From this population‐based cohort (N = 207), we first selected all subjects with an age over 17 years as well as no current or lifetime diagnosis of mental disorders according to the Diagnostic and Statistical Manual of Mental Disorders (DSM‐IV‐TR; American Psychiatric Association, 2000) (N = 105). Two subjects were rejected because of missing information regarding the DSM‐IV‐TR information, and one subject was rejected because of missing structural imaging data. After preprocessing (see below), we excluded the imaging data of subjects with more than 2 mm and 2° in maximum head motion (N = 17). In total, 85 subjects (age range: 19–85 years, 47 males) were included in the parcellation procedure.
For validation purposes, we applied our parcellation results on rs‐fMRI data of an independent sample derived from our local cohort of healthy elderly volunteers recruited at the DZNE in Rostock (N = 25, age range: 65–89 years, 13 males). Acquisition parameters and preprocessing procedures for the 3T MRI data of this sample have previously been described in detail (Dyrba, Grothe, Kirste, & Teipel, 2015) and followed similar settings as described for the NKI/Rockland sample in the next sections.
2.2. Image acquisition
Ten‐min rs‐fMRI scans were obtained from all subjects on a single 3T Siemens MRI scanner (Magnetom TrioTim, Siemens Medical Systems, Erlangen, Germany) using an echo planar imaging sequence with the following parameters: orientation = transversal, FoV = 216 mm, voxel size = 3.0 mm isotropic, slice thickness = 3.0 mm, repetition time = 2,500 ms, echo time = 30 ms, flip angle = 80°.
For anatomic reference and image preprocessing, high‐resolution structural MRI (sMRI) scans were obtained using the same scanner and a magnetization prepared rapid acquisition gradient echo sequence with the following parameters: orientation = sagittal, FoV = 256 mm, voxel size = 1.0 mm isotropic, slice thickness = 1.0 mm, repetition time = 2,500 ms, echo time = 3.5 ms, flip angle = 8°.
2.3. Preprocessing
We used the advanced version of the Data Processing Assistant for rs‐fMRI (DPARSFA; Chao‐Gan & Yu‐Feng, 2010) in conjunction with the statistical parametric mapping software (SPM8, http://www.fil.ion.ucl.ac.uk/spm) and the toolbox for Data Processing and Analysis of Brain Imaging (DPABI, http://rfmri.org/DPABI). We first removed the 10 initial time points of the rs‐fMRI time‐series and applied slice timing correction on the remaining volumes. The slice‐timed rs‐fMRI volumes were realigned and motion corrected, and the mean volume was coregistered to the corresponding sMRI. sMRIs were segmented into gray matter (GM), white matter (WM), and cerebrospinal fluid (CSF) partitions and spatially normalized to stereotactic Montreal Neurological Institute (MNI) space using Diffeomorphic Anatomical Registration Through Exponentiated Lie Algebra (DARTEL) (Ashburner, 2007). We regressed out nuisance covariates in the rs‐fMRIs with 24 head motion parameters (Friston, Williams, Howard, Frackowiak, & Turner, 1996), as well as global, WM, and CSF signal as nuisance regressors, including a linear detrend. Subsequently, rs‐fMRIs were normalized to MNI space using the normalization parameters of the coregistered sMRI scans. Finally, the rs‐fMRIs were smoothed with a 6 mm full width at half maximum Gaussian kernel, masked for cerebral tissue, and bandpass filtered between 0.01 and 0.08 Hz (Logothetis, Pauls, Augath, Trinath, & Oeltermann, 2001; Lu et al., 2007).
2.4. Definition of CBF region of interest and FC analyses
A comprehensive CBF region‐of‐interest (ROI) was defined in the MNI space template based on combined information from existing stereotactic atlases of basal forebrain cholinergic nuclei in MNI space (Kilimann et al., 2014; Teipel et al., 2005; Zaborszky et al., 2008). This mask was resampled to a final voxel size of 3 mm isotropic to match the voxel size of the rs‐fMRI images. For each of the 189 voxels in the CBF‐mask, we calculated an FC map by correlating the voxel's signal time course with all other GM voxels of the brain (as defined in the Harvard‐Oxford atlas for cortical and subcortical regions; Desikan et al., 2006). Voxel‐specific FC maps were Fisher z‐transformed and then averaged over all subjects.
2.5. Experimental design and statistical analysis
2.5.1. Connectivity based parcellation
The CBF ROI was parcellated into functionally homogeneous subdivisions by clustering its voxels based on the similarity of their averaged FC maps on group‐level using the k‐means clustering algorithm (Eickhoff, Laird, Fox, Bzdok, & Hensel, 2016; Lloyd, 1982). For this, the data were first organized into an n‐by‐m matrix representing the FC maps of all CBF voxels, where n represents the voxels in the CBF ROI (189 voxels) and m all other brain GM voxels with their corresponding FC values. Similarity between the voxels' FC maps was estimated using Pearson's correlation coefficient, and one minus the correlation coefficient was used as a distance measure. The k‐means clustering algorithm then partitioned the CBF voxels (rows of the n‐by‐m matrix) by initially assigning all voxels to k different clusters based on centroids positioned by chance and iteratively reassigning the voxels until the intra‐cluster distances across all clusters reached a minimum (maximum 1,000 iterations). For each k, the clustering was repeated for 100 random starting positions of the initial centroids and the best solution was chosen based on the mean silhouette value for all voxels (Kaufman & Rousseeuw, 1990). The silhouette value ranges from −1 to +1 and measures the similarity of a given voxel to all other voxels within the same cluster compared to the voxels in the other clusters.
In our primary analysis, we set k = 2, because we hypothesized that the well‐described cortical projection differences between anterior‐medial (MS, DB) and posterior‐lateral (NBM) CBF subdivisions in animal models (Luiten et al., 1987; Mesulam, Mufson, Levey, et al., 1983) would be detected as differential rs‐fMRI FC profiles in the human CBF. In additional analyses using k = 3 and k = 4, we further explored the feasibility of using rs‐fMRI data for detecting even more fine‐grained functional distinctions among CBF divisions in the human brain.
2.5.2. Cluster‐wise FC
For each cluster of the final CBF parcellations, we determined the specific FC profile leading to the definition of that cluster. Cluster‐to‐voxel FC maps were calculated for each individual and subjected to second‐level one‐sample t‐tests, using age and gender as covariates, and restricting the search space to the GM mask that was also used for the FC maps driving the CBF parcellation. Because of the uncertain interpretation of negative time course correlations (anticorrelations) that can emerge as an artifact of global signal regression, we only considered positive effects in the FC maps (Murphy & Fox, 2017). Results are reported at a voxel‐wise statistical threshold of p < .05, corrected for multiple testing using the family‐wise error rate (FWE).
Given animal‐derived evidence for a functional topography of CBF projections that follows the organization of interconnected cortical systems (Ghashghaei & Barbas, 2001; Zaborszky et al., 2015), we further analyzed FC profiles of the CBF in relation to functional brain networks using an established parcellation of the human cerebral cortex into 17 intrinsically connected networks (Yeo et al., 2011). For each subject, the CBF clusters' signal time courses were correlated with the average signal time course of each of the 17 networks. These correlations were Fisher z‐transformed, and significance of their deviance from zero was assessed using one‐sample t‐tests.
2.5.3. Effects of age on cluster‐wise FC
Effects of age on CBF FC were assessed for the two principal CBF subdivisions revealed by the k = 2 clustering parcellation. Analyses employed voxel‐wise linear regressions of age on cluster‐specific FC maps and were controlled for gender. The search space was restricted to the thresholded positive connectivity profile of each CBF cluster, and statistical significance was assessed at p < .05, corrected for the false discovery rate (FDR).
2.5.4. Replication of cluster‐wise FC profiles in an independent sample
For the two principal CBF subdivisions identified in our primary analysis, we calculated cluster‐wise FC profiles within the independent replication sample using FC analyses as described above. Topographic correspondence between the cluster‐wise FC profiles derived from the two independent samples was quantified using spatial correlation (Pearson's r) of the sample‐specific FC signals across all cortical networks (Buckner et al., 2009; Fjell et al., 2015; Grothe & Teipel, 2016).
3. RESULTS
3.1. Connectivity‐based parcellation
k‐means clustering for k = 2 parcellated the CBF into an anterior‐medial cluster (aCBF) and a posterior‐lateral cluster (pCBF; Figure 1). The aCBF cluster mostly covered the rostral nuclei of the MS/DB but also included anterior‐medial parts of the NBM (Figure 1a) and was characterized by predominant FC with the hippocampus, ventromedial prefrontal cortex, and retrosplenial/posterior cingulate cortex (Figure 1b, Table 1). The pCBF cluster covered the remaining anterior‐lateral, intermediate, and posterior parts of the NBM (Figure 1a), and markedly differed in its FC profile from the aCBF cluster; there was more pronounced connectivity with the insula, dorsal anterior cingulate cortex (dACC), and thalamus, and an absence of effects in posterior‐medial cortical areas (Figures 1b and 5, Table 1). The clusters had overlapping FC within regions of the medial prefrontal and (posterior) lateral orbitofrontal cortex, temporal pole, as well as hippocampus and amygdala.
Figure 1.
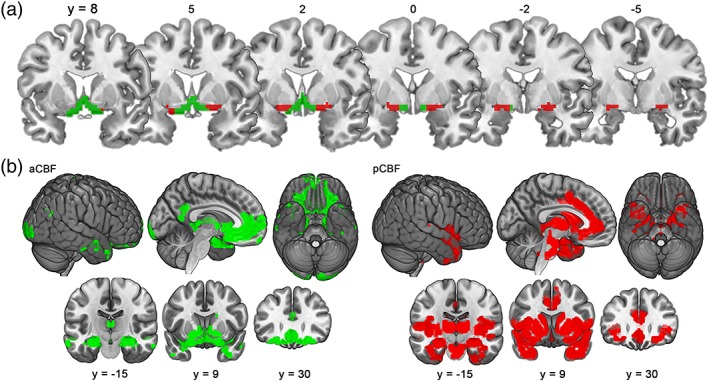
Functional connectivity (FC)‐based cholinergic basal forebrain (CBF) parcellation for a two‐cluster solution. (a) Coronal slices from anterior to posterior showing the anterior‐medial (aCBF, green) and posterior‐lateral CBF clusters (pCBF, red) identified by k‐means clustering (k = 2) of voxel‐wise FC profiles. Slice positions are indicated by Montreal Neurological Institute (MNI) y‐coordinates. (b) Corresponding FC profiles of aCBF and pCBF seeds (p (FWE) < .05) are illustrated on lateral, medial, and ventral brain surfaces, as well as on representative coronal sections at MNI coordinates (y = −15, y = 9, and y = 30) [Color figure can be viewed at http://wileyonlinelibrary.com]
Table 1.
Locations of local functional connectivity maxima for the anterior and posterior cholinergic basal forebrain (CBF) according to automated anatomical labeling atlas (AAL, http://www.gin.cnrs.fr/en/tools/aal-aal2/). FWE corrected on voxel‐level (p < .05), minimum cluster‐size 20 voxel
| Number | Cluster‐size (voxels) | Region | Side | T | MNI coordinate | ||
|---|---|---|---|---|---|---|---|
| x | y | z | |||||
| Anterior CBF | |||||||
| 1 | 3,016 | Cadaute nucleus | L | 33.42 | −6 | 6 | −6 |
| Caudate nucleus | R | 29.51 | 6 | 12 | −6 | ||
| Olfactory gyrus | L | 17.37 | −12 | 12 | −15 | ||
| 2 | 93 | Middle temporal gyrus | R | 8.30 | 57 | −6 | −18 |
| 3 | 100 | Middle temporal gyrus | L | 7.95 | −57 | −3 | −21 |
| Middle temporal gyrus | L | 7.68 | −51 | −12 | −18 | ||
| Middle temporal gyrus | L | 6.04 | −63 | −15 | −18 | ||
| 4 | 166 | Lingual gyrus | L | 7.71 | −9 | −99 | −18 |
| Superior occipital gyrus | R | 7.61 | 18 | −105 | 6 | ||
| Inferior occipital gyrus | L | 7.05 | −21 | −99 | −12 | ||
| 5 | 32 | Angular gyrus | L | 7.22 | −48 | −75 | 39 |
| Angular gyrus | L | 6.45 | −42 | −75 | 45 | ||
| Angular gyrus | L | 6.10 | −51 | −75 | 30 | ||
| 6 | 42 | Posterior cingulum | L | 5.99 | −3 | −51 | 30 |
| Precuneus | L | 5.82 | −6 | −57 | 12 | ||
| Posterior CBF | |||||||
| 7 | 7,401 | Putamen | L | 41.60 | −21 | 6 | −9 |
| Putamen | R | 39.88 | 21 | 9 | −6 | ||
| Amygdala | R | 34.47 | 27 | 0 | −12 | ||
Figure 5.
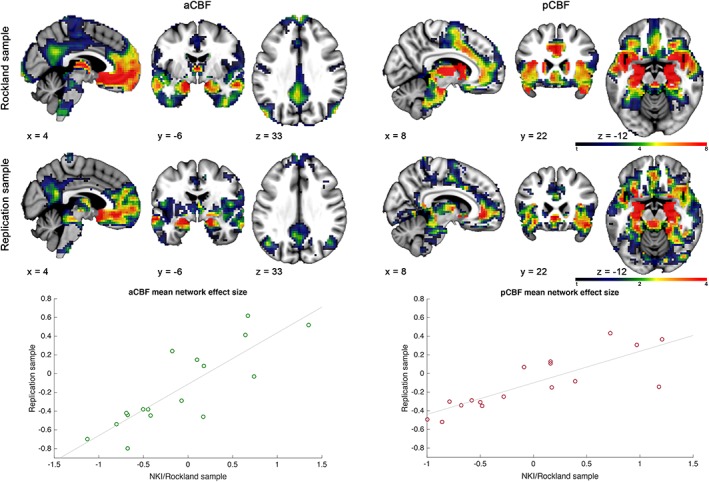
Reproducibility of subregion‐specific cholinergic basal forebrain (CBF) functional connectivity (FC) profiles. Top and middle panels show unthresholded FC maps of the anterior‐medial (left side, aCBF) and posterior‐lateral (right side, pCBF) CBF clusters derived from the cluster‐defining NKI/Rockland sample (top) and the local replication sample of healthy older individuals (middle). FC maps are displayed on representative sagittal, coronal, and transversal sections of the standard space template. Confirming the qualitatively visible correspondence between the FC maps, diagrams plotting the respective FC profiles (expressed as effect size) across 17 cortical networks (Yeo et al., 2011) show that these are highly correlated between the independent samples (see text for spatial correlation statistics) [Color figure can be viewed at http://wileyonlinelibrary.com]
At higher cluster numbers (k = 3 and 4), the aCBF cluster was further partitioned into two and three subclusters, whereas the pCBF cluster remained virtually unchanged (Figure 2). The first partition (k = 3) separated a region corresponding to anterior‐medial parts of the NBM that was characterized by a more selective FC profile with anterior medial temporal and ventromedial prefrontal regions compared to the parent cluster (k3_2; blue cluster in upper part of Figure 2). The second partition (k = 4) further subdivided the remainder of the aCBF cluster along a horizontal axis anterior to the crossing of the anterior commissure, although the resulting dorsal and ventral subclusters were characterized by very similar FC profiles (k4_1 and k4_2; cyan and orange clusters in bottom part of Figure 2).
Figure 2.
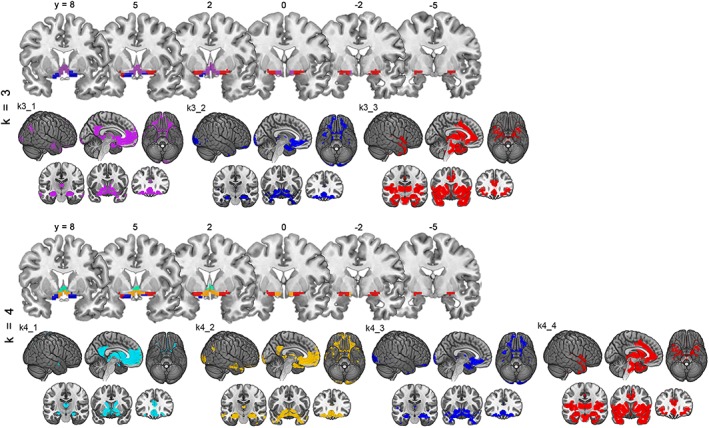
Functional connectivity (FC)‐based cholinergic basal forebrain (CBF) parcellation at higher cluster solutions. Figure shows CBF parcellations and corresponding FC profiles (p (FWE) < .05) when using higher cluster solutions (k = 3, top row and k = 4, bottom row) for the k‐means clustering algorithm. Analogously to Figure 1, CBF parcellations are depicted on coronal slices from anterior to posterior spanning Montreal Neurological Institute (MNI) coordinates from y = 8 to y = −5. Corresponding FC profiles are illustrated on lateral, medial, and ventral brain surfaces, as well as on representative coronal sections at MNI coordinates (y = −15, y = 9, and y = 30). Violet: k3_1, blue: k3_2 and k4_3, red: k3_3 and k4_4, cyan: k4_1, and orange: k4_2 [Color figure can be viewed at http://wileyonlinelibrary.com]
3.2. Connectivity with cortical networks
We further characterized the distinct FC profiles of the principal aCBF and pCBF clusters with respect to functional cortical networks (Table 2, Figure 3). In accordance with the voxel‐wise profiles, the aCBF cluster showed significant positive FC with limbic networks centered on orbitofrontal (t(84) = 16.8, p < .001) and anterior‐medial temporal cortices (t(84) = 8.9, p < .001), as well as with midline (t(84) = 6.2, p < .001) and posterior‐medial temporal subsystems of the default mode network (DMN) (t(84) = 5.1, p < .001). The pCBF cluster also showed positive FC with the anterior‐medial temporal limbic network (t(84) = 15.5, p < .001) but differed from the aCBF cluster in showing selective FC with the posterior ventral attention network (VAN) (t(84) = 9.6, p < .001), as well as with lateral‐temporal parts of the DMN (t(84) = 6.5, p < .001) and the ventrolateral somatomotor network (t(84) = 6.4, p < .001).
Table 2.
Functional connectivity of aCBF and pCBF subdivisions with cortical connectivity networks
| Network | aCBF | pCBF | ||||
|---|---|---|---|---|---|---|
| Mean | T | Sig. (2‐tailed) | Mean | T | Sig. (2‐tailed) | |
| 1 | 0.005 | 0.198 | n.s. | −0.101 | −5.135 | <0.001 |
| 2 | −0.057 | −2.618 | n.s. | −0.097 | −4.945 | <0.001 |
| 3 | 0.035 | 1.659 | n.s. | −0.044 | −1.456 | n.s. |
| 4a | 0.029 | 1.588 | n.s. | 0.179 | 6.398 | <0.001 |
| 5 | −0.128 | −6.222 | <0.001 | −0.192 | −11.910 | <0.001 |
| 6 | −0.125 | −5.935 | <0.001 | −0.121 | −5.141 | <0.001 |
| 7a | −0.078 | −4.433 | <0.001 | 0.214 | 9.610 | <0.001 |
| 8 | −0.175 | −8.669 | <0.001 | 0.042 | 1.986 | n.s. |
| 9a , b | 0.211 | 8.895 | <0.001 | 0.313 | 15.454 | <0.001 |
| 10b | 0.456 | 16.763 | <0.001 | 0.029 | 1.390 | n.s. |
| 11 | −0.059 | −3.089 | 0.003 | −0.179 | −9.090 | <0.001 |
| 12 | −0.217 | −12.630 | <0.001 | −0.137 | −7.675 | <0.001 |
| 13 | −0.146 | −7.494 | <0.001 | −0.203 | −9.624 | <0.001 |
| 14a | −0.032 | −1.963 | n.s. | 0.140 | 6.464 | <0.001 |
| 15b | 0.104 | 5.050 | <0.001 | −0.010 | −0.567 | n.s. |
| 16b | 0.144 | 6.233 | <0.001 | −0.022 | −1.064 | n.s. |
| 17 | 0.021 | 1.012 | n.s. | 0.018 | 1.017 | n.s. |
CBF = cholinergic basal forebrain; aCBF = anterior‐medial cluster; pCBF = posterior‐lateral cluster; n.s. = not significant (false discovery rate‐corrected alpha = 0.003). Note. Network numbers correspond to their initial description in (Yeo et al., 2011). According to (Hansson et al., 2017), these may be termed as follows: 1, higher visual; 2, primary visual; 3, dorsal somatomotor network (SMN); 4, ventral SMN‐auditory; 5, posterior dorsal attention network (DAN); 6, frontal eye field‐DAN; 7, posterior ventral attention network (VAN); 8, anterior VAN; 9, temporal pole/anterior medial temporal lobe (MTL) limbic network (LIM); 10, orbitofrontal LIM; 11, precuneus non‐default mode network (DMN); 12, frontoparietal network (FPN) component 1; 13, FPN component 2; 14, lateral‐temporal DMN/language; 15, posterior MTL‐retrosplenial DMN; 16, midline DMN; and 17, anterior DMN.
Significant positive functional connectivity with pCBF.
Significant positive functional connectivity with aCBF.
Figure 3.
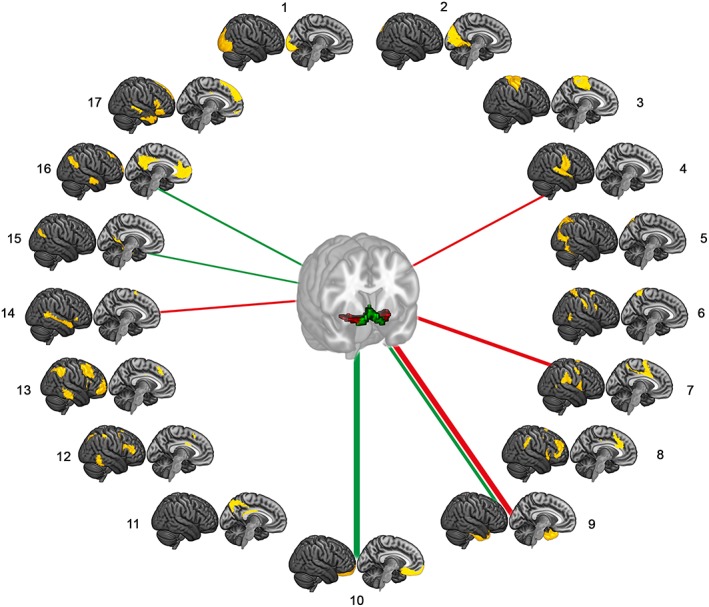
Functional connectivity (FC) of cholinergic basal forebrain (CBF) subdivisions with specific cortical networks. Lines indicate significant positive FC of the identified anterior‐medial (aCBF, green) and posterior‐lateral (pCBF, red) CBF subdivisions with specific cortical connectivity networks as defined by standardized network templates (Yeo et al., 2011). Line thickness indicates effect size [Color figure can be viewed at http://wileyonlinelibrary.com]
3.3. Subregion‐specific effects of age
Voxel‐wise effects of age on FC of the aCBF and pCBF subdivisions are shown in Figure 4. For the aCBF, higher age was associated with lower FC with the ventromedial prefrontal cortex, hippocampus, and the basal ganglia. For the pCBF, higher age was associated with lower FC with the dACC, anterior insula, lateral orbitofrontal cortex, and basal ganglia.
Figure 4.
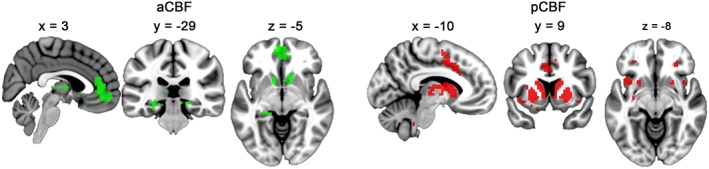
Effects of age on subregion‐specific cholinergic basal forebrain (CBF) functional connectivity (FC). Significant negative effects of age on FC of the anterior‐medial (aCBF, green) and posterior‐lateral (pCBF, red) CBF subdivisions are displayed on representative sagittal, coronal, and transversal sections of the standard space template (p (FDR) < .05) [Color figure can be viewed at http://wileyonlinelibrary.com]
3.4. Replication sample
Seed‐based FC analyses in the replication sample produced very similar FC profiles of the aCBF and pCBF subdivisions as initially identified in the NKI/Rockland sample (Figure 5). When quantified in a spatial correlation analysis across all cortical networks, the respective FC profiles of the aCBF (r(15) = .84, p < .001) and pCBF (r(15) = .83, p < .001) subdivisions were highly correlated between both samples.
4. DISCUSSION
4.1. CBF subdivisions and their respective FC profiles
In line with our initial hypothesis, a two‐cluster solution parcellated the CBF into distinct anterior‐medial and posterior‐lateral clusters that were characterized by largely differing FC profiles. Although these clusters were automatically defined based solely on FC characteristics and not constrained by any predefined segments or manual groupings, their boundary shows a striking anatomic resemblance with the distinction between cytoarchitectonically defined MS/DB (Ch1‐3) and NBM (Ch4) subdivisions as revealed by stereotactic mappings (Kilimann et al., 2014; Zaborszky et al., 2008). However, this correspondence between functionally and cytoarchitectonically defined subdivisions was not complete, given that the aCBF cluster also covered anterior‐medial parts of the NBM, whereas the pCBF cluster covered the remaining anterior‐lateral, intermediate, and posterior parts of the NBM. The aCBF cluster showed FC predominantly with the hippocampus, ventromedial prefrontal cortex, and retrosplenial/posterior cingulate cortex, whereas the pCBF cluster showed selective FC with the insula, dACC, and thalamus.
According to axonal tracing studies in animal models, posterior CBF neurons (including intermediate and posterior NBM sections) project predominantly to the lateral neocortex and mesocortex, particularly the ventrolateral orbital cortex, insula, and temporal pole (Luiten et al., 1987; Mesulam, Mufson, Levey, et al., 1983), and these sites are also dominantly represented in our observed pCBF FC profile. In contrast to the pCBF–dACC connectivity observed here, the ACC has been reported to receive cholinergic input primarily from anterior‐medial parts of the NBM (Mesulam, Mufson, Levey, et al., 1983). However, a recent detailed topographic mapping study between CBF neurons and medial prefrontal cortex in mice indicated that this may only be true for the ventral ACC, whereas the dACC was found to be most densely connected with more posterior CBF neurons (Bloem et al., 2014). Furthermore, the prominent insula–dACC–thalamus connectivity of the identified pCBF subdivision reported here largely replicates the FC profile of the NBM reported in a previous study using an a priori seed region based on a cytoarchitectonically defined stereotactic map (Li et al., 2014). Although axonal tracing studies have documented selective projections from the NBM into the thalamic reticular nucleus (Hallanger, Levey, Lee, Rye, & Wainer, 1987; Levey, Hallanger, & Wainer, 1987), the main cholinergic innervation of the thalamus does not arise from the CBF but from cholinergic nuclei within the brainstem (Ch5/6) (Mesulam, Mufson, Wainer, et al., 1983). Thus, the pCBF/NBM–thalamus connectivity observed in rs‐fMRI data may also reflect an indirect functional connection mediated by the common implication of these structures in a larger functional brain network (see further discussion below). Although only very limited data on FC characteristics of anterior‐medial parts of the CBF is available from one recent rs‐fMRI study (Markello et al., 2018), the observed profile of most pronounced aCBF FC with the hippocampus and interconnected areas of the retrosplenial/posterior cingulate and ventromedial prefrontal cortex is well in line with this recent study and largely agrees with the axonal tracing literature on cortical projection patterns of the anterior CBF nuclei (Bloem et al., 2014; Gaykema, Luiten, Nyakas, & Traber, 1990; Mesulam, Mufson, Levey, et al., 1983; Parvizi, Van Hoesen, Buckwalter, & Damasio, 2006).
Although the aCBF and pCBF subdivisions are characterized by largely diverging cortical FC profiles, they also show a notable convergence in connectivity within areas of the posterior ventromedial prefrontal cortex, temporal pole, and especially hippocampus and amygdala. Besides receiving the most dense cholinergic innervation among all brain regions (Mesulam, Volicer, Marquis, Mufson, & Green, 1986), these key limbic and paralimbic structures are also the only cortical areas that provide neural input into the CBF (Mesulam & Mufson, 1984). A limitation of the FC metric used in our human in vivo study is that it cannot distinguish the signaling direction of the functional connection. Future studies may use effective connectivity paradigms based on experimentally evoked brain activity to further explore the directionality of the identified CBF‐cortical connectivity profiles (Friston et al., 2017).
4.2. Relation to cortical functional networks
Visually the aCBF FC profile resembles a previously described medial temporal DMN subsystem/episodic memory network (Andrews‐Hanna, Reidler, Sepulcre, Poulin, & Buckner, 2010; Vincent et al., 2006), whereas the prominent insula/dACC components of the pCBF FC profile are characteristic of a distinct network that has been variably referred to as VAN, salience, or cingulo‐opercular network (Dosenbach et al., 2007; Seeley et al., 2007). This network‐specific connectivity of aCBF and pCBF subdivisions could also be confirmed by quantitative assessment using standardized templates of well‐described cortical brain networks (Yeo et al., 2011). Interestingly, a specific connectivity of the pCBF with the VAN agrees with findings from a previous molecular imaging study demonstrating a disproportionately high density of cortical nicotinergic receptors in this particular brain network (Picard et al., 2013).
In general, the finding of network‐specific FC profiles of the identified aCBF and pCBF subdivisions coincides with previous evidence from axonal tracing studies in animal models indicating a functionally based topographical organization of CBF projections (Zaborszky et al., 2015). Thus, the cortical projection patterns of distinct CBF subdivisions appear to be determined by the functional relatedness and interconnectivity of the cortical target areas, rather than following strict anatomic gradients of spatial adjacency. It has been hypothesized that this complex corticotopic organization of CBF projections might facilitate coordinate control of spatially separated but functionally linked nodes of large‐scale cortical networks (Ballinger et al., 2016).
The specific FC of the aCBF with the medial temporal DMN/episodic memory network and of the pCBF with the VAN matches the assumed roles of these CBF subdivisions in particular cognitive functions, as revealed by selective lesion studies in animal models. Thus, septohippocampal projections of the anterior CBF have been specifically implicated in memory processes, whereas the neocortical projections of the NBM appear to be more closely related to attentional functions (Berger‐Sweeney et al., 2001; Voytko et al., 1994). Future studies combining in vivo FC measures of the identified CBF subdivisions with detailed psychometric assessments may allow studying in more detail the role of CBF signaling in human cognition, thereby complementing analogous covariance‐based studies on the cognitive correlates of structural CBF decline in aging and neurodegenerative disease (Butler et al., 2012; Grothe, Heinsen, Amaro Jr., Grinberg, & Teipel, 2016; Ray et al., 2015).
4.3. More fine‐grained CBF parcellations
Surprisingly, higher cluster solutions did not result in an increasing parcellation of the pCBF cluster covering different cytoarchitectonic NBM subdivisions, but further fractionated the aCBF cluster. In a first step, this resulted in a separation of a region corresponding to anterior‐medial parts of the NBM, which was characterized by a more selective FC profile with anterior medial temporal and ventromedial prefrontal regions compared to the parent cluster. Among all NBM neurons, the anterior‐medial populations show the strongest axonal projections to the hippocampus and ventromedial cortex in animal models, and accordingly this subdivision has been described as a transitional zone between the anterior and posterior CBF (Luiten et al., 1987; Mesulam, Mufson, Levey, et al., 1983). In a second step, the most anterior medial cluster further split along a horizontal axis at the level of the anterior commissure, which may potentially reflect connectivity differences between the MS/vertical DB and the horizontal DB. However, in contrast to the parcellated subdivisions identified in the previous steps, this distinction was only based on very subtle differences in the respective FC profiles. In this context, it has to be noted that the employed clustering approach is explorative in nature, and the correct number of meaningful subdivisions is not known a priori. Rather, the approach allows exploring regional differences in FC characteristics across increasing parcellation resolutions. The marginal difference in FC profiles at the highest examined clustering solution indicates that this resolution may represent a limit for resolving meaningful functional differences among CBF subdivisions by means of conventional rs‐fMRI acquisitions. Future studies using ultra‐high field fMRI acquisitions may potentially further improve the corticotopic mapping of human CBF connectivity (Maass, Berron, Libby, Ranganath, & Duzel, 2015).
4.4. Rs‐fMRI CBF connectivity as an in vivo marker of alterations in CBF function
We demonstrated the potential of using rs‐fMRI to investigate alterations in CBF function by showing a significant age‐related decline in subregion‐specific CBF FC. This finding may reflect the well‐described decrease in cholinergic tone during normal brain aging, which is believed to underlie subtle impairments in cognition and a higher susceptibility to anticholinergic side effects (Risacher et al., 2016; Schliebs & Arendt, 2011). Most interestingly, despite both CBF subdivisions showing prominent connectivity to the hippocampus, only the hippocampal connectivity of the aCBF subdivision was negatively affected by advancing age. Although this finding nicely coincides with the marked age effects on cholinergic septohippocampal projections described in animal models (Ypsilanti, Girao da Cruz, Burgess, & Aubert, 2008), it has to be noted that our in vivo connectivity approach cannot distinguish between cholinergic and non‐cholinergic neuron populations in the examined CBF‐mask. Although definition of this region was based on stereotactic mappings of histologically determined CBF nuclei in the human brain (Kilimann et al., 2014; Teipel et al., 2005; Zaborszky et al., 2008), this brain area also contains non‐cholinergic, particularly GABAergic, projection neurons that may show similar age‐related changes (Rubio et al., 2012; Yang, Thankachan, McCarley, & Brown, 2017). Irrespective of this limitation, these findings underline the importance of using functionally homogeneous seed regions when studying age or disease‐related CBF connectivity alterations with rs‐fMRI, similar to what has been reported for FC studies focused on the hippocampus and posterior cingulate cortex (Damoiseaux, Viviano, Yuan, & Raz, 2016; Dillen et al., 2016).
5. CONCLUSION
Our study paves the way for using rs‐fMRI‐based assessments of subregion‐specific CBF function to complement established volumetric approaches in the in vivo study of CBF involvement in cognitive aging and neurodegenerative disease (Grothe, Heinsen, & Teipel, 2012; Schmitz & Spreng, 2016). As a first step toward such applications, we demonstrated that the dissociated FC profiles of the identified CBF subdivisions are reproducible in rs‐fMRI acquisitions of elderly participants as typically collected in clinical research settings. We expect rs‐fMRI‐based assessments of CBF connectivity to be particularly useful for the study of functional CBF alterations in predementia stages of neurodegenerative disease (Brayda‐Bruno et al., 2013; Grothe, Ewers, Krause, Heinsen, & Teipel, 2014; Lim et al., 2015; Ray et al., 2017), as well as other neuropsychiatric conditions with cholinergic involvement that are not typically associated with gross neurodegeneration (Grothe et al., 2017; Perry et al., 2001; Sarter et al., 2012).
CONFLICT OF INTEREST
The authors declare no competing financial interests or relationships.
ACKNOWLEDGMENTS
We would like to thank the International Data‐Sharing Initiative (INDI; http://fcon_1000.projects.nitrc.org/indi/) and all contributing institutions for openly sharing their valuable neuroimaging data sets. Parts of the presented material arise from the doctoral thesis of H.‐C. F.
Fritz H‐CJ, Ray N, Dyrba M, Sorg C, Teipel S, Grothe MJ. The corticotopic organization of the human basal forebrain as revealed by regionally selective functional connectivity profiles. Hum Brain Mapp. 2019;40:868–878. 10.1002/hbm.24417
REFERENCES
- American Psychiatric Association . (2000). Diagnostic and statistical manual of mental disorders (4th ed., Text Revision). Washington, DC: Author. [Google Scholar]
- Andrews‐Hanna, J. R. , Reidler, J. S. , Sepulcre, J. , Poulin, R. , & Buckner, R. L. (2010). Functional‐anatomic fractionation of the brain's default network. Neuron, 65, 550–562. [DOI] [PMC free article] [PubMed] [Google Scholar]
- Ashburner, J. (2007). A fast diffeomorphic image registration algorithm. NeuroImage, 38, 95–113. [DOI] [PubMed] [Google Scholar]
- Ballinger, E. C. , Ananth, M. , Talmage, D. A. , & Role, L. W. (2016). Basal forebrain cholinergic circuits and signaling in cognition and cognitive decline. Neuron, 91, 1199–1218. [DOI] [PMC free article] [PubMed] [Google Scholar]
- Berger‐Sweeney, J. , Stearns, N. A. , Murg, S. L. , Floerke‐Nashner, L. R. , Lappi, D. A. , & Baxter, M. G. (2001). Selective immunolesions of cholinergic neurons in mice: Effects on neuroanatomy, neurochemistry, and behavior. The Journal of Neuroscience: The Official Journal of the Society for Neuroscience, 21, 8164–8173. [DOI] [PMC free article] [PubMed] [Google Scholar]
- Bloem, B. , Schoppink, L. , Rotaru, D. C. , Faiz, A. , Hendriks, P. , Mansvelder, H. D. , … Wouterlood, F. G. (2014). Topographic mapping between basal forebrain cholinergic neurons and the medial prefrontal cortex in mice. The Journal of Neuroscience: The Official Journal of the Society for Neuroscience, 34, 16234–16246. [DOI] [PMC free article] [PubMed] [Google Scholar]
- Brayda‐Bruno, L. , Mons, N. , Yee, B. K. , Micheau, J. , Abrous, D. N. , Nogues, X. , & Marighetto, A. (2013). Partial loss in septo‐hippocampal cholinergic neurons alters memory‐dependent measures of brain connectivity without overt memory deficits. Neurobiology of Disease, 54, 372–381. [DOI] [PubMed] [Google Scholar]
- Buckner, R. L. , Sepulcre, J. , Talukdar, T. , Krienen, F. M. , Liu, H. , Hedden, T. , … Johnson, K. A. (2009). Cortical hubs revealed by intrinsic functional connectivity: Mapping, assessment of stability, and relation to Alzheimer's disease. The Journal of Neuroscience: The Official Journal of the Society for Neuroscience, 29, 1860–1873. [DOI] [PMC free article] [PubMed] [Google Scholar]
- Butler, T. , Blackmon, K. , Zaborszky, L. , Wang, X. , DuBois, J. , Carlson, C. , … Thesen, T. (2012). Volume of the human septal forebrain region is a predictor of source memory accuracy. Journal of the International Neuropsychological Society, 18, 157–161. [DOI] [PMC free article] [PubMed] [Google Scholar]
- Chao‐Gan, Y. , & Yu‐Feng, Z. (2010). DPARSF: A MATLAB toolbox for “pipeline” data analysis of resting‐state fMRI. Frontiers in Systems Neuroscience, 4, 13. [DOI] [PMC free article] [PubMed] [Google Scholar]
- Damoiseaux, J. S. , Viviano, R. P. , Yuan, P. , & Raz, N. (2016). Differential effect of age on posterior and anterior hippocampal functional connectivity. NeuroImage, 133, 468–476. [DOI] [PMC free article] [PubMed] [Google Scholar]
- Desikan, R. S. , Segonne, F. , Fischl, B. , Quinn, B. T. , Dickerson, B. C. , Blacker, D. , … Killiany, R. J. (2006). An automated labeling system for subdividing the human cerebral cortex on MRI scans into gyral based regions of interest. NeuroImage, 31, 968–980. [DOI] [PubMed] [Google Scholar]
- Dillen, K. N. H. , Jacobs, H. I. L. , Kukolja, J. , von Reutern, B. , Richter, N. , Onur, O. A. , … Fink, G. R. (2016). Aberrant functional connectivity differentiates retrosplenial cortex from posterior cingulate cortex in prodromal Alzheimer's disease. Neurobiology of Aging, 44, 114–126. [DOI] [PubMed] [Google Scholar]
- Dosenbach, N. U. , Fair, D. A. , Miezin, F. M. , Cohen, A. L. , Wenger, K. K. , Dosenbach, R. A. , … Petersen, S. E. (2007). Distinct brain networks for adaptive and stable task control in humans. Proceedings of the National Academy of Sciences of the United States of America, 104, 11073–11078. [DOI] [PMC free article] [PubMed] [Google Scholar]
- Dyrba, M. , Grothe, M. , Kirste, T. , & Teipel, S. J. (2015). Multimodal analysis of functional and structural disconnection in Alzheimer's disease using multiple kernel SVM. Human Brain Mapping, 36, 2118–2131. [DOI] [PMC free article] [PubMed] [Google Scholar]
- Eickhoff, S. B. , Laird, A. R. , Fox, P. T. , Bzdok, D. , & Hensel, L. (2016). Functional segregation of the human dorsomedial prefrontal cortex. Cerebral Cortex, 26, 304–321. [DOI] [PMC free article] [PubMed] [Google Scholar]
- Eickhoff, S. B. , Thirion, B. , Varoquaux, G. , & Bzdok, D. (2015). Connectivity‐based parcellation: Critique and implications. Human Brain Mapping, 36, 4771–4792. [DOI] [PMC free article] [PubMed] [Google Scholar]
- Englot, D. J. , D'Haese, P. F. , Konrad, P. E. , Jacobs, M. L. , Gore, J. C. , Abou‐Khalil, B. W. , & Morgan, V. L. (2017). Functional connectivity disturbances of the ascending reticular activating system in temporal lobe epilepsy. Journal of Neurology, Neurosurgery, and Psychiatry, 88, 925–932. [DOI] [PMC free article] [PubMed] [Google Scholar]
- Fjell, A. M. , Amlien, I. K. , Sneve, M. H. , Grydeland, H. , Tamnes, C. K. , Chaplin, T. A. , … Walhovd, K. B. (2015). The roots of Alzheimer's disease: Are high‐expanding cortical areas preferentially targeted? Cerebral Cortex, 25, 2556–2565. [DOI] [PMC free article] [PubMed] [Google Scholar]
- Friston, K. J. , Preller, K. H. , Mathys, C. , Cagnan, H. , Heinzle, J. , Razi, A. , & Zeidman, P. (2017). Dynamic causal modelling revisited. NeuroImage. pii: S1053‐8119(17)30156‐8. http://doi.org.10.1016/j.neuroimage.2017.02.045. [Epub ahead of print]. [DOI] [PMC free article] [PubMed] [Google Scholar]
- Friston, K. J. , Williams, S. , Howard, R. , Frackowiak, R. S. , & Turner, R. (1996). Movement‐related effects in fMRI time‐series. Magnetic Resonance in Medicine, 35, 346–355. [DOI] [PubMed] [Google Scholar]
- Gaykema, R. P. , Luiten, P. G. , Nyakas, C. , & Traber, J. (1990). Cortical projection patterns of the medial septum‐diagonal band complex. The Journal of Comparative Neurology, 293, 103–124. [DOI] [PubMed] [Google Scholar]
- Ghashghaei, H. T. , & Barbas, H. (2001). Neural interaction between the basal forebrain and functionally distinct prefrontal cortices in the rhesus monkey. Neuroscience, 103, 593–614. [DOI] [PubMed] [Google Scholar]
- Grothe, M. , Heinsen, H. , & Teipel, S. J. (2012). Atrophy of the cholinergic basal forebrain over the adult age range and in early stages of Alzheimer's disease. Biological Psychiatry, 71, 805–813. [DOI] [PMC free article] [PubMed] [Google Scholar]
- Grothe, M. J. , Ewers, M. , Krause, B. , Heinsen, H. , & Teipel, S. J. (2014). Basal forebrain atrophy and cortical amyloid deposition in nondemented elderly subjects. Alzheimer's & Dementia: The Journal of the Alzheimer's Association, 10, S344–S353. [DOI] [PMC free article] [PubMed] [Google Scholar]
- Grothe, M. J. , Heinsen, H. , Amaro, E., Jr. , Grinberg, L. T. , & Teipel, S. J. (2016). Cognitive correlates of basal forebrain atrophy and associated cortical hypometabolism in mild cognitive impairment. Cerebral Cortex, 26, 2411–2426. [DOI] [PMC free article] [PubMed] [Google Scholar]
- Grothe, M. J. , Scheef, L. , Bauml, J. , Meng, C. , Daamen, M. , Baumann, N. , … Sorg, C. (2017). Reduced cholinergic basal forebrain integrity links neonatal complications and adult cognitive deficits after premature birth. Biological Psychiatry, 82, 119–126. [DOI] [PubMed] [Google Scholar]
- Grothe, M. J. , & Teipel, S. J. (2016). Spatial patterns of atrophy, hypometabolism, and amyloid deposition in Alzheimer's disease correspond to dissociable functional brain networks. Human Brain Mapping, 37, 35–53. [DOI] [PMC free article] [PubMed] [Google Scholar]
- Hallanger, A. E. , Levey, A. I. , Lee, H. J. , Rye, D. B. , & Wainer, B. H. (1987). The origins of cholinergic and other subcortical afferents to the thalamus in the rat. The Journal of Comparative Neurology, 262, 105–124. [DOI] [PubMed] [Google Scholar]
- Hansson, O. , Grothe, M. J. , Strandberg, T. O. , Ohlsson, T. , Hagerstrom, D. , Jogi, J. , … Scholl, M. (2017). Tau pathology distribution in Alzheimer's disease corresponds differentially to cognition‐relevant functional brain networks. Frontiers in Neuroscience, 11, 167. [DOI] [PMC free article] [PubMed] [Google Scholar]
- Hasselmo, M. E. , & Sarter, M. (2011). Modes and models of forebrain cholinergic neuromodulation of cognition. Neuropsychopharmacology, 36, 52–73. [DOI] [PMC free article] [PubMed] [Google Scholar]
- Hedreen, J. C. , Struble, R. G. , Whitehouse, P. J. , & Price, D. L. (1984). Topography of the magnocellular basal forebrain system in human brain. Journal of Neuropathology and Experimental Neurology, 43, 1–21. [DOI] [PubMed] [Google Scholar]
- Kahnt, T. , Chang, L. J. , Park, S. Q. , Heinzle, J. , & Haynes, J. D. (2012). Connectivity‐based parcellation of the human orbitofrontal cortex. The Journal of Neuroscience: The Official Journal of the Society for Neuroscience, 32, 6240–6250. [DOI] [PMC free article] [PubMed] [Google Scholar]
- Kaufman, L. , & Rousseeuw, P. J. (1990). Finding groups in data: an introduction to cluster analysis. Hoboken, New Jersey: John Wiley & Sons, Inc. [Google Scholar]
- Kilimann, I. , Grothe, M. , Heinsen, H. , Alho, E. J. , Grinberg, L. , Amaro, E., Jr. , … Teipel, S. J. (2014). Subregional basal forebrain atrophy in Alzheimer's disease: A multicenter study. Journal of Alzheimer's Disease, 40, 687–700. [DOI] [PMC free article] [PubMed] [Google Scholar]
- Kitt, C. A. , Mitchell, S. J. , DeLong, M. R. , Wainer, B. H. , & Price, D. L. (1987). Fiber pathways of basal forebrain cholinergic neurons in monkeys. Brain Research, 406, 192–206. [DOI] [PubMed] [Google Scholar]
- Levey, A. I. , Hallanger, A. E. , & Wainer, B. H. (1987). Cholinergic nucleus basalis neurons may influence the cortex via the thalamus. Neuroscience Letters, 74, 7–13. [DOI] [PubMed] [Google Scholar]
- Li, C. S. , Ide, J. S. , Zhang, S. , Hu, S. , Chao, H. H. , & Zaborszky, L. (2014). Resting state functional connectivity of the basal nucleus of Meynert in humans: In comparison to the ventral striatum and the effects of age. NeuroImage, 97, 321–332. [DOI] [PMC free article] [PubMed] [Google Scholar]
- Libby, L. A. , Ekstrom, A. D. , Ragland, J. D. , & Ranganath, C. (2012). Differential connectivity of perirhinal and parahippocampal cortices within human hippocampal subregions revealed by high‐resolution functional imaging. The Journal of Neuroscience: The Official Journal of the Society for Neuroscience, 32, 6550–6560. [DOI] [PMC free article] [PubMed] [Google Scholar]
- Lim, Y. Y. , Maruff, P. , Schindler, R. , Ott, B. R. , Salloway, S. , Yoo, D. C. , … Snyder, P. J. (2015). Disruption of cholinergic neurotransmission exacerbates Abeta‐related cognitive impairment in preclinical Alzheimer's disease. Neurobiology of Aging, 36, 2709–2715. [DOI] [PubMed] [Google Scholar]
- Lloyd, S. (1982). Least‐squares quantization in Pcm. IEEE Transactions on Information Theory, 28, 129–137. [Google Scholar]
- Logothetis, N. K. , Pauls, J. , Augath, M. , Trinath, T. , & Oeltermann, A. (2001). Neurophysiological investigation of the basis of the fMRI signal. Nature, 412, 150–157. [DOI] [PubMed] [Google Scholar]
- Lu, H. , Zuo, Y. , Gu, H. , Waltz, J. A. , Zhan, W. , Scholl, C. A. , … Stein, E. A. (2007). Synchronized delta oscillations correlate with the resting‐state functional MRI signal. Proceedings of the National Academy of Sciences of the United States of America, 104, 18265–18269. [DOI] [PMC free article] [PubMed] [Google Scholar]
- Luiten, P. G. , Gaykema, R. P. , Traber, J. , & Spencer, D. G., Jr. (1987). Cortical projection patterns of magnocellular basal nucleus subdivisions as revealed by anterogradely transported Phaseolus vulgaris leucoagglutinin. Brain Research, 413, 229–250. [DOI] [PubMed] [Google Scholar]
- Maass, A. , Berron, D. , Libby, L. A. , Ranganath, C. , & Duzel, E. (2015). Functional subregions of the human entorhinal cortex. eLife, 4 http://doi.org.10.1016/j.neuroimage.2017.02.045. [DOI] [PMC free article] [PubMed] [Google Scholar]
- Markello, R. D. , Spreng, R. N. , Luh, W. M. , Anderson, A. K. , & De Rosa, E. (2018). Segregation of the human basal forebrain using resting state functional MRI. NeuroImage, 173, 287–297. [DOI] [PubMed] [Google Scholar]
- Mesulam, M. M. , & Geula, C. (1988). Nucleus basalis (Ch4) and cortical cholinergic innervation in the human brain: Observations based on the distribution of acetylcholinesterase and choline acetyltransferase. The Journal of Comparative Neurology, 275, 216–240. [DOI] [PubMed] [Google Scholar]
- Mesulam, M. M. , Hersh, L. B. , Mash, D. C. , & Geula, C. (1992). Differential cholinergic innervation within functional subdivisions of the human cerebral cortex: A choline acetyltransferase study. The Journal of Comparative Neurology, 318, 316–328. [DOI] [PubMed] [Google Scholar]
- Mesulam, M. M. , & Mufson, E. J. (1984). Neural inputs into the nucleus basalis of the substantia innominata (Ch4) in the rhesus monkey. Brain: A Journal of Neurology, 107(Pt 1), 253–274. [DOI] [PubMed] [Google Scholar]
- Mesulam, M. M. , Mufson, E. J. , Levey, A. I. , & Wainer, B. H. (1983). Cholinergic innervation of cortex by the basal forebrain: Cytochemistry and cortical connections of the septal area, diagonal band nuclei, nucleus basalis (substantia innominata), and hypothalamus in the rhesus monkey. The Journal of Comparative Neurology, 214, 170–197. [DOI] [PubMed] [Google Scholar]
- Mesulam, M. M. , Mufson, E. J. , Wainer, B. H. , & Levey, A. I. (1983). Central cholinergic pathways in the rat: An overview based on an alternative nomenclature (Ch1‐Ch6). Neuroscience, 10, 1185–1201. [DOI] [PubMed] [Google Scholar]
- Mesulam, M. M. , Volicer, L. , Marquis, J. K. , Mufson, E. J. , & Green, R. C. (1986). Systematic regional differences in the cholinergic innervation of the primate cerebral cortex: Distribution of enzyme activities and some behavioral implications. Annals of Neurology, 19, 144–151. [DOI] [PubMed] [Google Scholar]
- Mishra, A. , Rogers, B. P. , Chen, L. M. , & Gore, J. C. (2014). Functional connectivity‐based parcellation of amygdala using self‐organized mapping: A data driven approach. Human Brain Mapping, 35, 1247–1260. [DOI] [PMC free article] [PubMed] [Google Scholar]
- Murphy, K. , & Fox, M. D. (2017). Towards a consensus regarding global signal regression for resting state functional connectivity MRI. NeuroImage, 154, 169–173. [DOI] [PMC free article] [PubMed] [Google Scholar]
- Nooner, K. B. , Colcombe, S. J. , Tobe, R. H. , Mennes, M. , Benedict, M. M. , Moreno, A. L. , … Milham, M. P. (2012). The NKI‐Rockland sample: A model for accelerating the pace of discovery science in psychiatry. Frontiers in Neuroscience, 6, 152. [DOI] [PMC free article] [PubMed] [Google Scholar]
- Parvizi, J. , Van Hoesen, G. W. , Buckwalter, J. , & Damasio, A. (2006). Neural connections of the posteromedial cortex in the macaque. Proceedings of the National Academy of Sciences of the United States of America, 103, 1563–1568. [DOI] [PMC free article] [PubMed] [Google Scholar]
- Pascual, B. , Masdeu, J. C. , Hollenbeck, M. , Makris, N. , Insausti, R. , Ding, S. L. , & Dickerson, B. C. (2015). Large‐scale brain networks of the human left temporal pole: A functional connectivity MRI study. Cerebral Cortex, 25, 680–702. [DOI] [PMC free article] [PubMed] [Google Scholar]
- Perry, E. K. , Lee, M. L. , Martin‐Ruiz, C. M. , Court, J. A. , Volsen, S. G. , Merrit, J. , … Wenk, G. L. (2001). Cholinergic activity in autism: Abnormalities in the cerebral cortex and basal forebrain. The American Journal of Psychiatry, 158, 1058–1066. [DOI] [PubMed] [Google Scholar]
- Picard, F. , Sadaghiani, S. , Leroy, C. , Courvoisier, D. S. , Maroy, R. , & Bottlaender, M. (2013). High density of nicotinic receptors in the cingulo‐insular network. NeuroImage, 79, 42–51. [DOI] [PubMed] [Google Scholar]
- Ray, N. J. , Bradburn, S. , Murgatroyd, C. , Toseeb, U. , Mir, P. , Kountouriotis, G. K. , … Grothe, M. J. (2017). In vivo cholinergic basal forebrain atrophy predicts cognitive decline in de novo Parkinson's disease. Brain: A Journal of Neurology, 141(Pt 1), 165–176. [DOI] [PMC free article] [PubMed] [Google Scholar]
- Ray, N. J. , Metzler‐Baddeley, C. , Khondoker, M. R. , Grothe, M. J. , Teipel, S. , Wright, P. , … O'Sullivan, M. J. (2015). Cholinergic basal forebrain structure influences the reconfiguration of white matter connections to support residual memory in mild cognitive impairment. The Journal of Neuroscience, 35, 739–747. [DOI] [PMC free article] [PubMed] [Google Scholar]
- Risacher, S. L. , McDonald, B. C. , Tallman, E. F. , West, J. D. , Farlow, M. R. , Unverzagt, F. W. , … Saykin, A. J. (2016). Association between anticholinergic medication use and cognition, brain metabolism, and brain atrophy in cognitively normal older adults. JAMA Neurology, 73, 721–732. [DOI] [PMC free article] [PubMed] [Google Scholar]
- Rogers, J. D. , Brogan, D. , & Mirra, S. S. (1985). The nucleus basalis of Meynert in neurological disease: A quantitative morphological study. Annals of Neurology, 17, 163–170. [DOI] [PubMed] [Google Scholar]
- Roy, A. K. , Shehzad, Z. , Margulies, D. S. , Kelly, A. M. , Uddin, L. Q. , Gotimer, K. , … Milham, M. P. (2009). Functional connectivity of the human amygdala using resting state fMRI. NeuroImage, 45, 614–626. [DOI] [PMC free article] [PubMed] [Google Scholar]
- Rubio, S. E. , Vega‐Flores, G. , Martinez, A. , Bosch, C. , Perez‐Mediavilla, A. , del Rio, J. , … Pascual, M. (2012). Accelerated aging of the GABAergic septohippocampal pathway and decreased hippocampal rhythms in a mouse model of Alzheimer's disease. The FASEB Journal, 26, 4458–4467. [DOI] [PubMed] [Google Scholar]
- Sarter, M. , Lustig, C. , & Taylor, S. F. (2012). Cholinergic contributions to the cognitive symptoms of schizophrenia and the viability of cholinergic treatments. Neuropharmacology, 62, 1544–1553. [DOI] [PMC free article] [PubMed] [Google Scholar]
- Schliebs, R. , & Arendt, T. (2011). The cholinergic system in aging and neuronal degeneration. Behavioural Brain Research, 221, 555–563. [DOI] [PubMed] [Google Scholar]
- Schmitz, T. W. , & Spreng, R. (2016). Basal forebrain degeneration precedes and predicts the cortical spread of Alzheimer's pathology. Nature Communications, 7, 13249. [DOI] [PMC free article] [PubMed] [Google Scholar]
- Seeley, W. W. , Menon, V. , Schatzberg, A. F. , Keller, J. , Glover, G. H. , Kenna, H. , … Greicius, M. D. (2007). Dissociable intrinsic connectivity networks for salience processing and executive control. The Journal of Neuroscience: The Official Journal of the Society for Neuroscience, 27, 2349–2356. [DOI] [PMC free article] [PubMed] [Google Scholar]
- Selden, N. R. , Gitelman, D. R. , Salamon‐Murayama, N. , Parrish, T. B. , & Mesulam, M. M. (1998). Trajectories of cholinergic pathways within the cerebral hemispheres of the human brain. Brain: A Journal of Neurology, 121(Pt 12), 2249–2257. [DOI] [PubMed] [Google Scholar]
- Teipel, S. J. , Flatz, W. H. , Heinsen, H. , Bokde, A. L. , Schoenberg, S. O. , Stockel, S. , … Hampel, H. (2005). Measurement of basal forebrain atrophy in Alzheimer's disease using MRI. Brain: A Journal of Neurology, 128, 2626–2644. [DOI] [PubMed] [Google Scholar]
- Vincent, J. L. , Snyder, A. Z. , Fox, M. D. , Shannon, B. J. , Andrews, J. R. , Raichle, M. E. , & Buckner, R. L. (2006). Coherent spontaneous activity identifies a hippocampal‐parietal memory network. Journal of Neurophysiology, 96, 3517–3531. [DOI] [PubMed] [Google Scholar]
- Voytko, M. L. , Olton, D. S. , Richardson, R. T. , Gorman, L. K. , Tobin, J. R. , & Price, D. L. (1994). Basal forebrain lesions in monkeys disrupt attention but not learning and memory. The Journal of Neuroscience: The Official Journal of the Society for Neuroscience, 14, 167–186. [DOI] [PMC free article] [PubMed] [Google Scholar]
- Whitehouse, P. J. , Hedreen, J. C. , White, C. L., 3rd , & Price, D. L. (1983). Basal forebrain neurons in the dementia of Parkinson disease. Annals of Neurology, 13, 243–248. [DOI] [PubMed] [Google Scholar]
- Whitehouse, P. J. , Price, D. L. , Struble, R. G. , Clark, A. W. , Coyle, J. T. , & Delon, M. R. (1982). Alzheimer's disease and senile dementia: Loss of neurons in the basal forebrain. Science, 215, 1237–1239. [DOI] [PubMed] [Google Scholar]
- Yang, C. , Thankachan, S. , McCarley, R. W. , & Brown, R. E. (2017). The menagerie of the basal forebrain: How many (neural) species are there, what do they look like, how do they behave and who talks to whom? Current Opinion in Neurobiology, 44, 159–166. [DOI] [PMC free article] [PubMed] [Google Scholar]
- Yeo, B. T. , Krienen, F. M. , Sepulcre, J. , Sabuncu, M. R. , Lashkari, D. , Hollinshead, M. , … Buckner, R. L. (2011). The organization of the human cerebral cortex estimated by intrinsic functional connectivity. Journal of Neurophysiology, 106, 1125–1165. [DOI] [PMC free article] [PubMed] [Google Scholar]
- Ypsilanti, A. R. , Girao da Cruz, M. T. , Burgess, A. , & Aubert, I. (2008). The length of hippocampal cholinergic fibers is reduced in the aging brain. Neurobiology of Aging, 29, 1666–1679. [DOI] [PubMed] [Google Scholar]
- Zaborszky, L. , Csordas, A. , Mosca, K. , Kim, J. , Gielow, M. R. , Vadasz, C. , & Nadasdy, Z. (2015). Neurons in the basal forebrain project to the cortex in a complex topographic organization that reflects corticocortical connectivity patterns: An experimental study based on retrograde tracing and 3D reconstruction. Cerebral Cortex, 25, 118–137. [DOI] [PMC free article] [PubMed] [Google Scholar]
- Zaborszky, L. , Hoemke, L. , Mohlberg, H. , Schleicher, A. , Amunts, K. , & Zilles, K. (2008). Stereotaxic probabilistic maps of the magnocellular cell groups in human basal forebrain. NeuroImage, 42, 1127–1141. [DOI] [PMC free article] [PubMed] [Google Scholar]
- Zhang, D. , Snyder, A. Z. , Shimony, J. S. , Fox, M. D. , & Raichle, M. E. (2010). Noninvasive functional and structural connectivity mapping of the human thalamocortical system. Cerebral Cortex, 20, 1187–1194. [DOI] [PMC free article] [PubMed] [Google Scholar]
- Zhang, S. , Hu, S. , Chao, H. H. , & Li, C. S. (2016). Resting‐state functional connectivity of the locus coeruleus in humans: In comparison with the ventral tegmental area/substantia nigra pars compacta and the effects of age. Cerebral Cortex, 26, 3413–3427. [DOI] [PMC free article] [PubMed] [Google Scholar]
- Zhuo, J. , Fan, L. , Liu, Y. , Zhang, Y. , Yu, C. , & Jiang, T. (2016). Connectivity profiles reveal a transition subarea in the parahippocampal region that integrates the anterior temporal‐posterior medial systems. The Journal of Neuroscience: The Official Journal of the Society for Neuroscience, 36, 2782–2795. [DOI] [PMC free article] [PubMed] [Google Scholar]