

Abstract
The purpose of this study was to determine the relationship between the organization of the brain connectome and cerebrovascular reactivity (CVR) in persons with white matter hyperintensities. Diffusion tensor and CVR mapping 3T MRI scans were acquired in 31 participants with white matter hyperintensities. In each participant, the connectome was assessed by reconstructing all white matter tracts with tractography and segmenting the whole brain into multiple regions. Graph theory analysis was performed to quantify how effectively tracts connected brain regions by measuring the global and local efficiency of the connectome. CVR in white matter and gray matter was correlated with the global and local efficiency of the connectome, while adjusting for age, gender, and gray matter volume. For comparison, white matter hyperintensity volume was also correlated with global and local efficiency. White matter CVR was positively correlated with the global efficiency (coefficient: 23.3, p = .005) and local efficiency (coefficient: 2850, p = .004) of the connectome. Gray matter CVR was positively correlated with the global efficiency (coefficient: 21.3, p < .001) and local efficiency (coefficient: 2670, p < .001) of the connectome. White matter hyperintensity volume was negatively correlated with global efficiency (coefficient: −0.0002, p = .003) and local efficiency (coefficient: −0.024, p = .003) of the connectome. The association between CVR and the brain connectome suggests that impaired cerebrovascular function may be part of the pathophysiology of the disruption of the brain connectome in persons with white matter hyperintensities.
Keywords: cerebrovascular circulation, diffusion tensor imaging, gray matter, leukoaraiosis, white matter
1. INTRODUCTION
Cerebrovascular reactivity (CVR) is the change in cerebral blood flow in response to a vasodilatory challenge and reflects underlying vascular dysfunction or pathology (Sobczyk et al., 2014). White matter is organized into an extensive network of tracts known as the connectome (Griffa, Baumann, Thiran, & Hagmann, 2013; Sporns, Tononi, & Kötter, 2005). The relationship between CVR and the structural connectome has not been assessed. The structural organization of the connectome can be assessed using diffusion tensor imaging (DTI) tractography MRI (Rubinov & Sporns, 2010). DTI reconstructs white matter tracts based on the diffusion of water molecules along their length (Behrens & Jbabdi, 2009). Graph theory analysis is then used to assess how well white matter tracts connect different areas of the brain (Rubinov & Sporns, 2010). The strength of connections is weighted based on the number of tracts (network edges) connecting brain regions (network nodes) (Rubinov & Sporns, 2010). The overall integration of the connectome is described by its global efficiency, which is the sum of the inverse of the shortest path length between one region and all the other regions (Rubinov & Sporns, 2010). The segregation of the connectome is described by its local efficiency, which is the average of the inverse of the distance between all regions connected to a region (Rubinov & Sporns, 2010).
CVR may be associated with altered global or local efficiency through its effects on gray matter areas (network nodes) or on white matter tracts (network edges). Impaired CVR is implicated in disruption of gray matter and cortical thinning (Fierstra et al., 2010). CVR is also associated with disruption of white matter in persons with WMH (Sam, Conklin, Holmes, et al., 2016; Sam, Crawley, Conklin, et al., 2016). Impaired CVR has been associated with WMH lesions (Sam, Crawley, Poublanc, et al., 2016). Also in normal appearing white matter, impaired CVR is associated with worse fractional anisotropy (FA), mean diffusivity (MD), cerebral blood flow and blood volume and the development of new WMH (Sam, Peltenburg, Conklin, et al., 2016). White matter hyperintensities are associated with decreased global and local efficiency (Lawrence et al., 2018; Lawrence, Chung, Morris, Markus, & Barrick, 2014; Reijmer et al., 2016; Tuladhar, van Dijk, et al., 2016; Tuladhar, van Uden, et al., 2016; Tuladhar et al., 2017; Valenti et al., 2017; Wiseman et al., 2018; Xu, Lau, Wong, Mak, & Hui, 2018). Therefore, CVR in white and gray matter may also be associated with the global and local efficiency of the brain connectome in persons with WMH.
In order to assess the relationship between CVR and the organization of the brain connectome in persons with WMH, participants with WMH underwent CVR mapping and DTI tractography. CVR was measured by BOLD MRI using a controlled CO2 vasodilatory challenge (Sobczyk et al., 2014). DTI tractography was used to generate white matter tracts (Behrens & Jbabdi, 2009). Using graph theory analysis, the global and local efficiency of the connectome was calculated (Rubinov & Sporns, 2010). For the first time, we correlated the CVR of gray and white matter with the global and local efficiency of the connectome while adjusting for age, gender, WMH volume, and gray matter volume. As a control, we assessed the association between WMH volume with global and local efficiency which has been described in prior studies (Lawrence et al., 2014; Tuladhar, van Dijk, et al., 2016; Tuladhar, van Uden, et al., 2016; Valenti et al., 2017; Wiseman et al., 2018; Xu et al., 2018). Tractography depends on a FA threshold to terminate tracts, and since CVR and WMH are associated with altered FA, a secondary analysis was applied (Behrens & Jbabdi, 2009; Reginold et al., 2018; Sam, Conklin, Holmes, et al., 2016). This secondary analysis consisted of varying the FA threshold to determine the effect on the association between CVR or WMH and connectome characteristics. The results of this study would further our understanding of how cerebral hemodynamics contribute to the pathogenesis of the altered connectome in persons with WMH.
2. MATERIALS AND METHODS
2.1. Participants and clinical assessment
The study was approved by the University Health Network research ethics board. All participants provided written and informed consent. Participants with white matter hyperintensities were recruited from outpatient neurology clinics at the Toronto Western Hospital. Inclusion criteria for the study were age greater than 50 years and presence of WMH. Exclusion criteria for the study was the presence of DWI positive subcortical infarct within the prior 3 months, prior cortical infarct or lacunar infarct, hemodynamically significant (>70%) internal carotid artery or vertebrobasilar stenosis, evidence of dissection, vasculitis, pulmonary or cardioembolic disease, migraine headaches, demyelinating disease, mild cognitive impairment or dementia. Thirty‐one patients met inclusion and exclusion criteria. The demographic characteristics of the participants are shown in Table 1.
Table 1.
Demographic data for participants
| Subjects | |
|---|---|
| Number | 31 |
| Age (years) | 70.5 ± 9.39 |
| Gender (M/F count) | 17/14 |
| WMH volume (cm3) | 5.33 ± 7.89 |
| Gray matter volume (cm3) | 974 ± 206 |
Note: Values are means and standard deviations.
Abbreviations: F, female; M, male; WMH, white matter hyperintensity.
2.2. MR imaging
Subjects underwent MR imaging in one session on a 3T system (Signa HDx platform; GE Healthcare, Milwaukee, WI). A T2‐weighted fluid attenuated inversion recovery (FLAIR) scan was acquired to assess white mater hyperintensities (slice thickness 3 mm; no interslice gap; matrix size 240 × 240; field of view 22 × 22 cm; flip angle 90°; TE 165 ms; TR 9,145 ms; inversion time 2,800 ms; each voxel measured 0.00887 cm3, 36 imaging slices; scan time 5 min and 48 s). A BOLD fMRI scan was acquired with a T2*‐weighted echoplanar imaging gradient echo sequence to assess CVR (slice thickness 5 mm; matrix size = 64 × 64; field of view 24 × 24 cm; flip angle 85°; TE = 30 ms; TR 2000 ms; 255 frames; scan time 8 min and 30 s). A T1‐weighted scan was obtained using a 3D spoiled gradient echo sequence upon which CVR results were co‐registered (slice thickness 1.5 mm; no interslice gap; matrix size 256 × 256; field of view 22 × 22 cm; flip angle 20°; TE 3 ms; TR 7.8 ms; inversion time 300 ms; 146 imaging slices; scan time 7 min and 36 s). A DTI scan was acquired with an echoplanar spin‐echo sequence to derive white matter tracts and structural connectivity (slice thickness 3 mm; matrix size 128 × 128; field of view 22 × 22 cm; b = 1,000 s/mm2; 23 separate diffusion‐encoding gradients; 2 non‐diffusion‐weighted B0 images; TE 80 ms; TR 14,500 ms; 47 imaging slices; scan time 6 min and 18 s).
2.3. CVR assessment
CVR was quantified as the change in BOLD signal from a controlled change in end‐tidal partial pressure of carbon dioxide (PetCO2) as the vasodilatory stimulus (as described in Sam, Crawley, Conklin, et al., 2016). PetCO2 was controlled using an automated gas blender and gas delivery breathing circuit (RespirAct™; Thornhill Research Inc., Toronto, Canada). The RespirAct™ provides a quantitative repeatable CO2 stimulus that allows for reproducible and reliable measures of CVR (Kassner, Winter, Poublanc, Mikulis, & Crawley, 2010; Slessarev et al., 2007; Sobczyk et al., 2016). Cyclic step‐changes in PetCO2 have been previously shown to improve statistically significant matching between the MRI signal and end‐tidal gas concentrations (Vesely et al., 2001). The PetCO2 sequence used in this study has been previously shown to produce reliable and reproducible measures of gray matter CVR and white matter CVR (Fierstra et al., 2013; Kassner et al., 2010; Sam, Crawley, Poublanc, et al., 2016; Slessarev et al., 2007; Sobczyk et al., 2016). The PetCO2 sequence used in this study was: (a) baseline normocapnia with PetCO2 of 40 mmHg for 60 s; (b) hypercapnic step change to PetCO2 of 50 mmHg for 90 s; (c) return to baseline for 90 s; and (d) a second hypercapnic step for 120 s with a final return to baseline. Iso‐oxia was maintained throughout the study. There is a temporal shift between BOLD signal and PetCO2 data due to delay from pulmonary to cerebral circulation (Vesely et al., 2001). This temporal discrepancy was corrected for when CVR was calculated (Sam, Peltenburg, Conklin, et al., 2016). BOLD images were aligned to axial T1‐weighted images and slice time‐corrected. The PetCO2 data was time‐shifted to the maximum point of correlation with the whole brain average BOLD signal using the MATLAB software (MathWorks, Natick, MA). Subsequently, a voxel‐by‐voxel linear least squares fit of the BOLD signal to the PetCO2 data was performed and the slope of the line of best fit was taken as CVR. CVR values were expressed as the percentage MR signal change/mmHg change in PetCO2. CVR was color‐coded voxel‐by‐voxel and overlaid onto the anatomical scans to create CVR maps (example in Figure 1a).
Figure 1.
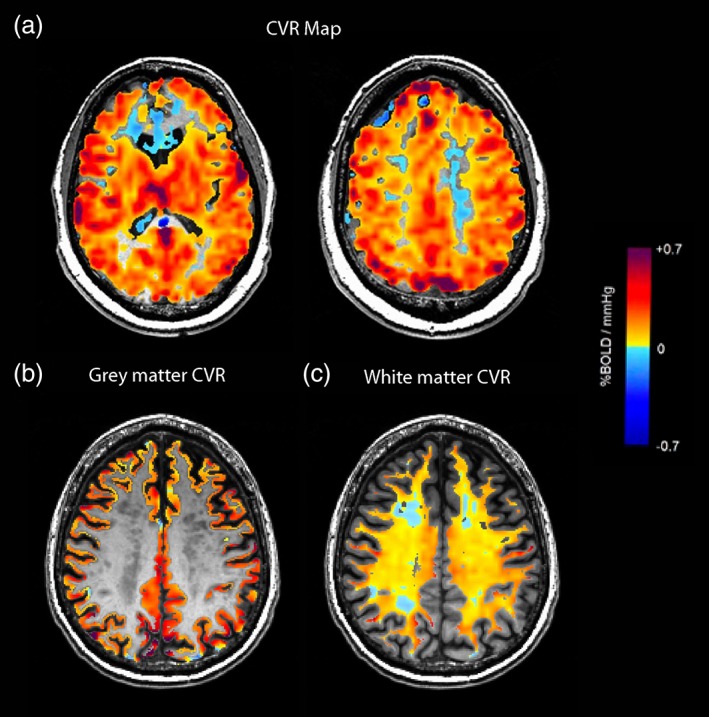
Example of CVR maps and gray matter CVR and white matter CVR. Example of (a) CVR color maps at different axial slices (scale included) overlaid on axial T1‐weighted images. Example of (b) segmented gray matter CVR and (c) segmented white matter CVR on axial T1‐weighted images. CVR, cerebrovascular reactivity [Color figure can be viewed at http://wileyonlinelibrary.com]
2.4. Measuring WMH volume
In each participant, WMH were manually segmented on axial T2 FLAIR images in DSI studio (example in Figure 2). Individual WMH were outlined as an ROI slice‐by‐slice on all T2 FLAIR slices for each participant in DSI Studio (Yeh, Verstynen, Wang, Fernández‐Miranda, & Tseng, 2013). Expert manual segmentation of WMH is considered the gold standard for segmenting WMH (Simões et al., 2013). The total WMH volume (in cm3) was measured in each participant.
Figure 2.
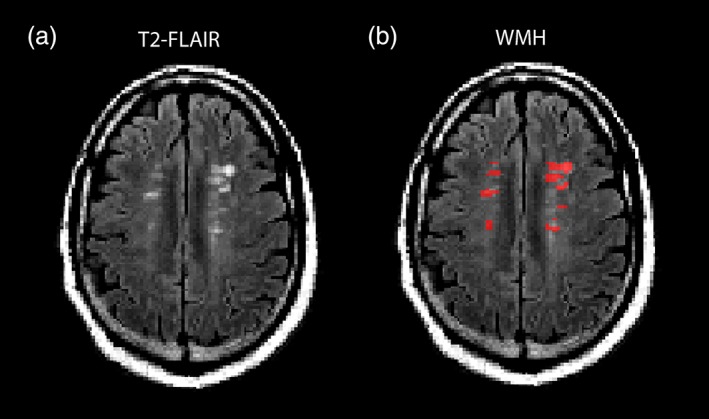
Example of segmentation of WMH on T2‐FLAIR images. Example of (a) axial T2‐FLAIR image and (b) segmentation of WMH in red. FLAIR, fluid attenuated inversion recovery; WMH, white matter hyperintensity [Color figure can be viewed at http://wileyonlinelibrary.com]
2.5. Tractography
Analysis of DTI data was conducted using DSI Studio (Yeh et al., 2013). For tractography, tracking was performed with a deterministic streamline algorithm (Yeh et al., 2013). The termination index was based on an FA threshold 0.20 consistent with prior connectivity studies in participants with WMH (Lawrence et al., 2014; Lawrence et al., 2018; Tuladhar et al., 2017; Tuladhar, van Dijk, et al., 2016; Tuladhar, van Uden, et al., 2016; Xu et al., 2018). The angular threshold was set at 60°. The step size was 0.86 mm. Tracts were excluded if their length was less than 30 mm or greater than 300 mm. A total of 150,000 seeds were placed. All white matter tracts were generated (example in Figure 3a). In each participant, the total number of tracts, mean diffusivity, and fractional anisotropy of all white matter tracts was measured.
Figure 3.
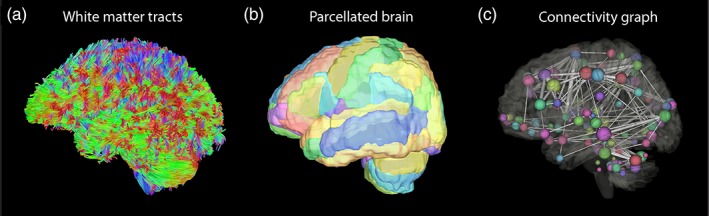
Example of tractography, brain parcellation, and analysis of connectome represented as a connectivity graph. Example of (a) all white matter tracts generated by tractography, (b) parcellation of the whole brain based on the AAL atlas with different areas in different colors and (c) connectivity graph demonstrating brain regions as spheres and tracts connecting the brain areas as solid lines [Color figure can be viewed at http://wileyonlinelibrary.com]
2.6. Tractography adjusting the FA threshold
For the secondary analysis, to determine the effect of adjusting the FA threshold to terminate tracts, the FA threshold was decreased to 0.16 or increased to 0.24. Other tracking parameters were kept the same.
2.7. Measurement of white matter CVR and gray matter CVR
In DSI studio, the CVR map, T2 FLAIR images, and DTI images were automatically co‐registered using the voxel‐to‐voxel transformation matrix in DSI Studio (Yeh et al., 2013). Co‐registration was subsequently manually confirmed by visual assessment. Cerebral white matter and cerebral gray matter was automatically segmented using the Harvard‐Oxford atlas. The gray matter volume was calculated in each participant. The mean CVR was measured in segmented cerebral white matter and in the cerebral gray matter (example in Figure 1b,c).
2.8. Connectome analysis
The graph theoretical analysis of the connectome was performed in DSI studio (Yeh et al., 2013). The AAL atlas was used for brain parcellation consistent with prior connectivity studies in participants with WMH (Lawrence et al., 2014; Lawrence et al., 2018; Reijmer et al., 2016; Tuladhar et al., 2017; Tuladhar, van Dijk, et al., 2016; Tuladhar, van Uden, et al., 2016; Xu et al., 2018) (example in Figure 3b). All 116‐brain regions in the AAL atlas were selected. The connectivity matrix was calculated based on the tracts ending at the AAL atlas regions. The weighting of connections between brain regions was based on the number of tracts connecting each area. The weighted global efficiency and weighted local efficiency was calculated. For the secondary analysis, the connectome analysis was repeated with tracts generated from the different FA thresholds described above.
2.9. Analysis of association between white matter CVR, gray matter CVR or WMH volume with global and local efficiency
Statistical analysis was performed with the Statplus software. To determine if there was an association between white matter CVR and connectome characteristics, a linear regression was performed between white matter CVR and global efficiency or local efficiency while adjusting for the effects of age, gender, WMH volume, and gray matter volume. To determine if there was an association between gray matter CVR and connectome characteristics, a linear regression was performed between gray matter CVR and global efficiency or local efficiency while adjusting for the effects of age, gender, WMH volume, and gray matter volume. It was noted there was a participant with overall negative CVR, so the linear regressions were also repeated after excluding the participant. To determine if there was an association between WMH volume and connectome characteristics, a linear regression was performed between WMH volume and global efficiency or local efficiency while adjusting for the effects of age, gender, white matter and gray matter CVR, and gray matter volume. A Bonferroni correction for six comparisons was applied and p values less than .008 were considered statistically significant.
2.10. Secondary analysis adjusting the FA threshold
For the secondary analysis, to determine if the FA threshold for tractography affected the association between CVR and WMH volume with connectome characteristics, the linear regressions were repeated using the global or local efficiency of connectomes generated from a FA threshold of 0.16 or 0.24. A Bonferroni correction for 12 comparisons was applied and p values less than .004 were considered statistically significant.
3. RESULTS
On average, in each patient there were 61,675 ± 8,657 white matter tracts with a FA of 0.474 ± 0.020 and MD of 0.923 ± 0.0364. The mean white matter CVR was 0.096 ± 0.067 and mean gray matter CVR was 0.210 ± 0.086% MR signal change/mmHg change in PetCO2. After adjusting for age, gender, WMH volume, and gray matter volume, there was a positive correlation between white matter CVR and connectome global efficiency (R 2 = 0.40, coefficient: 23.3, p = .005) and between white matter CVR and connectome local efficiency (R 2 = 0.41, coefficient: 2850, p = .004) (Figure 4). After adjusting for age, gender, WMH volume, and gray matter volume, there was a positive correlation between gray matter CVR and connectome global efficiency (R 2 = 0.48, coefficient: 21.3, p < .001) and between gray matter CVR and connectome local efficiency (R 2 = 0.51, coefficient: 2670, p < .001) (Figure 5). There was an outlier with lower CVR compared to the other subjects. After excluding the subject with the lowest CVR and adjusting for age, gender, WMH volume, and gray matter volume, there was a positive correlation between white matter CVR and global efficiency (R 2 = 0.47, coefficient: 45.3, p < .001) and local efficiency (R 2 = 0.46, coefficient: 5310, p < .001). After excluding the subject with the lowest CVR and adjusting for age, gender, WMH volume, and gray matter volume, there was a positive correlation between gray matter CVR and global efficiency (R 2 = 0.47, coefficient: 26.3, p < .001) and local efficiency (R 2 = 0.49, coefficient: 3250, p < .001). When all participants were included, after adjusting for white and gray matter CVR, age, gender, and gray matter volume, there was a negative correlation between WMH volume and global efficiency (R 2 = 0.46, coefficient: −0.0002, p = .003) and between WMH volume and local efficiency (R 2 = 0.48, coefficient: −0.024, p = .003) (Figure 6).
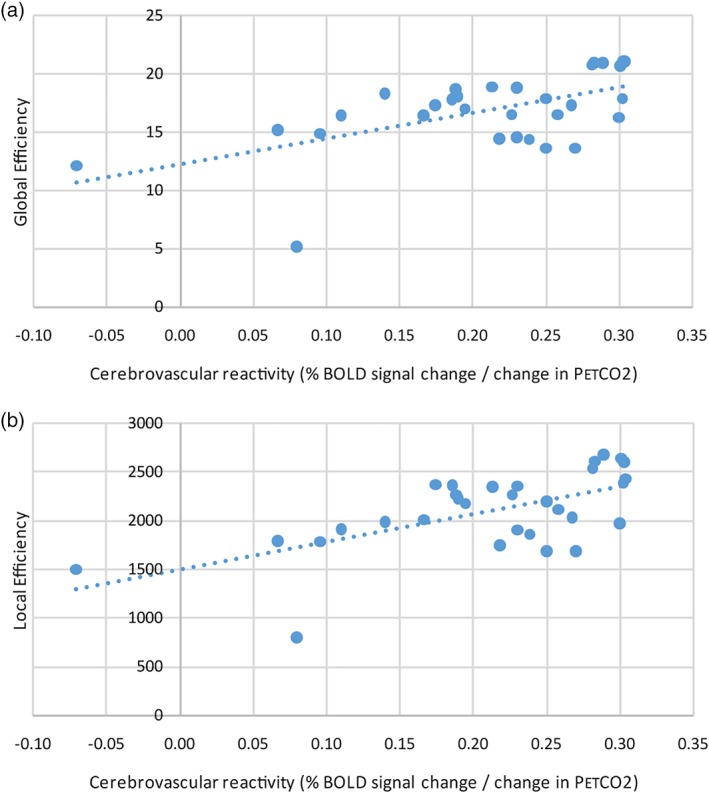
Figure 4.
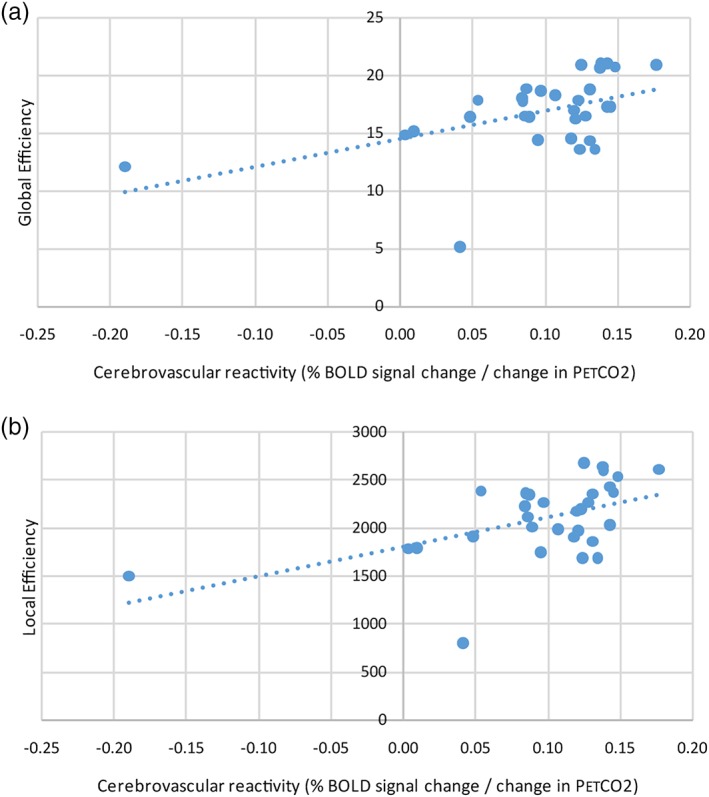
Scatter plots comparing white matter CVR with the global efficiency and local efficiency of the connectome. Scatter plot demonstrating a positive correlation between white matter cerebrovascular reactivity and (a) global efficiency (R 2 = 0.40, coefficient: 23.3, p = .005) and (b) local efficiency (R 2 = 0.41, coefficient: 2850, p = .004). The trend‐lines are depicted as dotted lines. BOLD, blood oxygenation level dependent; CVR, cerebrovascular reactivity; PetCO2, end‐tidal partial pressure of carbon dioxide [Color figure can be viewed at http://wileyonlinelibrary.com]
Figure 5.
Scatter plots comparing gray matter CVR with the global efficiency and local efficiency of the connectome. Scatter plot demonstrating a positive correlation between gray matter cerebrovascular reactivity and (a) global efficiency (R 2 = 0.48, coefficient: 21.3, p < .001) and (b) local efficiency (R 2 = 0.51, coefficient: 2670, p < .001). The trend‐lines are depicted as dotted lines. BOLD, blood oxygenation level dependent; CVR, cerebrovascular reactivity; PetCO2, end‐tidal partial pressure of carbon dioxide [Color figure can be viewed at http://wileyonlinelibrary.com]
Figure 6.
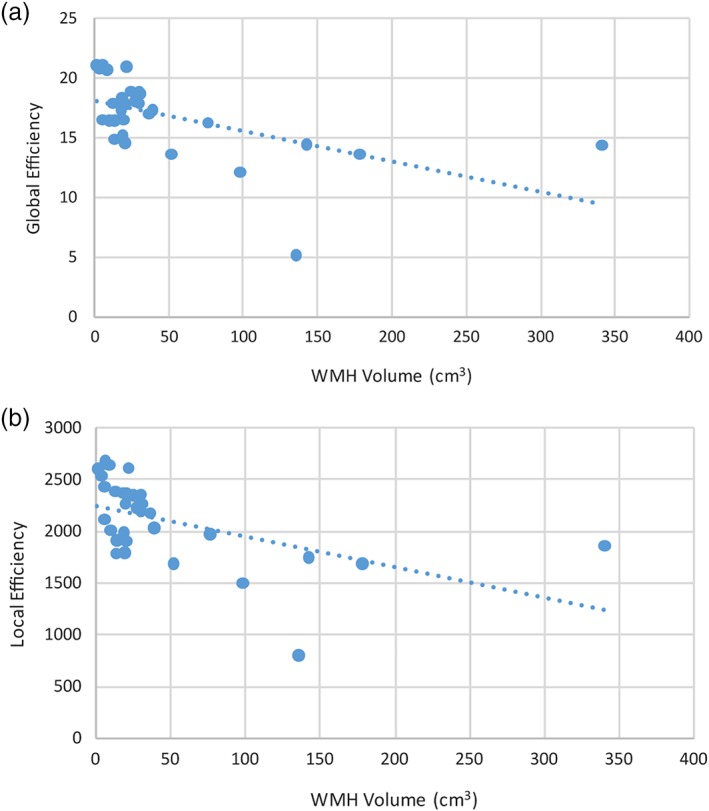
Scatter plots comparing WMH volume with the global efficiency and local efficiency of the connectome. Scatter plot demonstrating a negative correlation between WMH volume and (a) global efficiency (R 2 = 0.46, coefficient: −0.0002, p = .003) and (b) local efficiency (R 2 = 0.48, coefficient: −0.024, p = .003). The trend‐lines are depicted as dotted lines. WMH, white matter hyperintensity [Color figure can be viewed at http://wileyonlinelibrary.com]
When the FA threshold for tracking was reduced from 0.2 to 0.16, on average, there were 64,900 ± 8,170 tracts (a 5.2% increase in the number of tracts) with a FA of 0.454 ± 0.021 (a 4.2% decrease in FA) and MD of 0.947 ± 0.038 (a 2.6% increase in MD). After adjusting for WMH volume, age, gender, and gray matter volume, there was a positive correlation between white matter CVR and global efficiency (R 2 = 0.41, coefficient: 25.8, p < .001) and there was a positive correlation between white matter CVR and local efficiency (R 2 = 0.37, coefficient: 2900, p = .002). After adjusting for WMH volume, age, gender, and gray matter volume, there was a positive correlation between gray matter CVR and global efficiency (R 2 = 0.51, coefficient: 23.0, p < .001) and between gray matter CVR and local efficiency (R 2 = 0.52, coefficient: 2810, p < .001). After adjusting for white and gray matter CVR, age, gender, and gray matter volume, there was no statistically significant correlation between WMH volume and global efficiency (R 2 = 0.49, coefficient: −0.01, p = .03) or between WMH volume and local efficiency (R 2 = 0.50, coefficient: −1.57, p = .04).
When the FA threshold for tracking was increased from 0.20 to 0.24, on average, there were 57,000 ± 8,980 tracts (a 7.5% decrease in number of tracts) with a FA of 0.497 ± 0.019 (a 4.9% increase in FA) and MD of 0.898 ± 0.034 (a 2.7% decrease in MD). After adjusting for WMH volume, age, gender, and gray matter volume, there was no statistically significant correlation between white matter CVR and global efficiency (R 2 = 0.26, coefficient: 24.3, p = .015) and no significant correlation between white matter CVR and local efficiency (R 2 = 0.22, coefficient: 2590, p = .03). After adjusting for WMH volume, age, gender, and gray matter volume, there was a positive correlation between gray matter CVR and global efficiency (R 2 = 0.37, coefficient: 23.5, p = 0.002) and between gray matter CVR and local efficiency (R 2 = 0.38, coefficient: 2850, p = .001). After adjusting for gray and white matter CVR, age, gender, and gray matter volume, there was no statistically significant correlation between WMH volume and global efficiency (R 2 = 0.34, coefficient: −0.0002, p = .059) or between WMH volume and local efficiency (R 2 = 0.36, coefficient: −0.016, p = .073).
4. DISCUSSION
The main finding of this study is that the magnitude of CVR in white and gray matter is strongly associated with the efficiency of the brain connectome in persons with WMH. Prior studies showed impaired white matter CVR is associated with disruption of white matter at the microstructural scale in participants with WMH (Sam, Conklin, Holmes, et al., 2016; Sam, Crawley, Conklin, et al., 2016; Sam, Crawley, Poublanc, et al., 2016; Sam, Peltenburg, Conklin, et al., 2016). The results of this study demonstrate that the association between CVR and white matter integrity is more extensive than previously known and applies to the larger scale of white matter organization into structural networks. A prior study demonstrated that impaired gray matter CVR is associated with disruption limited to the cortex (Fierstra et al., 2010). Our results demonstrate that impaired gray matter CVR is associated with more widespread changes in the brain than previously recognized, by detecting an association between gray matter CVR and the connectome. The positive correlation between both white and gray matter CVR with global and local efficiency indicates that lower CVR is associated with fewer connections within distant and local areas of the brain. This result suggests that impaired CVR is involved in the disruption of local and global networks in the connectome.
The results of this study further our understanding of the relationship between CVR and brain connectivity. A prior study found an association between functional connectivity based on fMRI and CVR (Golestani, Kwinta, Strother, Khatamian, & Chen, 2016). It was unclear if this association was due to the spuriously altered fMRI BOLD effect related to the altered blood flow or if it was due to a true decrease in brain connectivity (Golestani et al., 2016; Para et al., 2017). An advantage of the current study was the use of structural measures of connectivity from white matter tracts generated from DTI, which is less susceptible to artifacts related to altered blood flow. The current study provides additional evidence of the association between CVR and the connectome.
The reason for the link between impaired CVR and decreased connectome efficiency is not known. Impaired CVR is related to chronic brain ischemia and impaired CVR is likely a marker of chronic ischemic injury (Fierstra et al., 2010; Marshall, 2010). In the setting of cerebrovascular disease, unaffected segments of the vascular tree can vasodilate to maintain resting cerebral blood flow (Sobczyk et al., 2014). With a vasodilatory challenge, areas at risk for chronic ischemia have variably exhausted their vasodilatory reserve and are limited in their ability to further vasodilate which can be measured as lower CVR (Sobczyk et al., 2014). Impaired cerebrovascular autoregulation may also be contributing to chronic ischemia (Mikulis, 2013). In patients with cerebrovascular disease, chronic ischemia may be caused by neurovascular uncoupling and an inability to increase blood flow in response to neural activity (Mikulis, 2013). Exhaustion of cerebrovascular reserve and the associated chronic ischemic injury to gray matter and white matter is hypothesized as the cause of disruption of both the network nodes and edges of the connectome respectively (Sam, Conklin, Holmes, et al., 2016; Sam, Crawley, Conklin, et al., 2016; Sam, Crawley, Poublanc, et al., 2016; Sam, Peltenburg, Conklin, et al., 2016). In white matter, ischemic injury may be reducing the number of tracts in the network. Ischemic injury from impaired CVR may lead to atrophy in white matter tracts leading to truly fewer connections between brain regions. Alternatively, vascular insufficiency caused by reduced CVR may lead to alterations of myelin structure, reducing FA of tracts and precluding tract reconstruction with tractography. The association between white matter CVR and connectome efficiency is in part dependent on changes in FA, because increasing the FA threshold led to a weaker association. Since impaired white matter CVR is associated with reduced FA (Sam, Conklin, Holmes, et al., 2016), fewer tracts should be identified for all FA thresholds. However, greater tract dropout will be seen with lower FA thresholds compared to higher FA thresholds. Therefore, when a higher FA threshold is used, tracts may still be generated despite reductions in FA below the threshold, leading to decreased sensitivity to the changes related to CVR. Unlike white matter CVR, the association between gray matter CVR and connectome does not depend on changes in FA, as the associations persisted despite changes in the FA threshold. This finding suggests that alterations in gray matter CVR relates to reduced connectome efficiency through a different mechanism. In gray matter, ischemic injury may cause cortical atrophy and fewer/smaller brain regions to connect (Fierstra et al., 2010). Histopathologic studies correlating CVR with white matter tract integrity and gray matter atrophy and are needed to precisely characterize how CVR is impacting tracts and brain regions to disrupt the connectome. The controversy is whether there is actual neuronal dropout versus a loss in the complexity of the neuropil itself.
This study also improves our understanding of the association between WMH volume and the connectome. Consistent with earlier studies, the global and local efficiency of the connectome was associated with WMH volume (Lawrence et al., 2014; Tuladhar, van Dijk, et al., 2016; Tuladhar, van Uden, et al., 2016; Valenti et al., 2017; Wiseman et al., 2018; Xu et al., 2018). This is the first study to assess the effect of adjusting the FA threshold. The association between WMH and connectome efficiency is dependent on FA. When the FA threshold for terminating tracts was adjusted, there was no longer a statistically significant association between WMH and connectome efficiency. It is unclear why the association is greatest at a FA cutoff of 0.2. The FA cutoff of 0.2 is close to the mean FA within WMH lesions from a prior study and may represent the threshold where tracts are maximally terminated by WMH lesions, which in turn would cause the greatest disruption to connectivity (Sam, Crawley, Conklin, et al., 2016). There was an association between WMH volume and the connectome even after adjusting for CVR. Similarly, there was an association between CVR and the brain connectome after adjusting for WMH volume. The results are consistent with earlier studies that identified that impaired CVR is associated with altered white matter integrity even in areas of normal appearing white matter (Sam, Crawley, Poublanc, et al., 2016). Since WMH and CVR have independent association with connectome efficiency, this study confirms that both are complimentary markers of white matter integrity that merit individual attention (Sam, Peltenburg, Conklin, et al., 2016).
Limitations of this study include the limited range of CVR in participants. Most subjects had overall positive CVR. A single subject had marked steal physiology (negative CVR); however, the results were unchanged when the participant was excluded in a secondary analysis. In our study, the limited extent of impaired CVR in persons with WMH may have underestimated the effect of CVR on the brain connectome in other populations with more severe cerebrovascular disease and CVR impairment. Furthermore, tractography may underestimate disruption related to CVR if it is unable to “sense” subtle early injury caused by chronic ischemia assuming that vascular injury precedes structural injury. This could lead to decreased axonal function (decreased conduction/communication) without loss of tracts. Similarly, another limitation related to tractography is that the efficiency of the connectome is based on the number of tracts connecting regions, which may not reflect the functional communication between regions.
Despite these limitations, the relationship between CVR and the connectome has interesting implications for CVR. Prior studies have demonstrated associations between connectome efficiency and cognitive function and the development of dementia (Lawrence et al., 2014; Lawrence et al., 2018; Tuladhar, van Dijk, et al., 2016; Tuladhar, van Uden, et al., 2016; Wiseman et al., 2018). Future studies should assess how impaired CVR impacts cognitive function and if impaired CVR predicts the development of dementia. Furthermore, our study suggests CVR is implicated in maintaining the integrity of the brain connectome. In the future, treatments targeted to improving/preserving CVR may help protect the brain connectome.
CONFLICT OF INTERESTS
D.J.M and J.F are coinventors of the RespirAct, a device used in this study. D.J.M and J.F hold equity shares in Thornhill Research, a University of Toronto/University Health Network‐related company that provides the RespirAct, and will receive royalties should the RespirAct become a commercial product.
Reginold W, Sam K, Poublanc J, Fisher J, Crawley A, Mikulis DJ. The efficiency of the brain connectome is associated with cerebrovascular reactivity in persons with white matter hyperintensities. Hum Brain Mapp. 2019;40:3647–3656. 10.1002/hbm.24622
REFERENCES
- Behrens, T. E. , & Jbabdi, S. (2009). MR diffusion tractography In Johansen‐Berg H. & Behrens T. E. (Eds.), Diffusion MRI: From quantitative measurement to in vivo neuroanatomy (pp. 333–351). New York: Elsevier. [Google Scholar]
- Fierstra, J. , Poublanc, J. , Han, J. S. , Silver, F. , Tymianski, M. , Crawley, A. P. , … Mikulis, D. J. (2010). Steal physiology is spatially associated with cortical thinning. Journal of Neurology, Neurosurgery, and Psychiatry, 81, 290–293. [DOI] [PubMed] [Google Scholar]
- Fierstra, J. , Sobczyk, O. , Battisti‐Charbonney, A. , Mandell, D. M. , Poublanc, J. , Crawley, A. P. , … Fisher, J. A. (2013). Measuring cerebrovascular reactivity: What stimulus to use? The Journal of Physiology, 591, 5809–5821. [DOI] [PMC free article] [PubMed] [Google Scholar]
- Golestani, A. M. , Kwinta, J. B. , Strother, S. C. , Khatamian, Y. B. , & Chen, J. J. (2016). The association between cerebrovascular reactivity and resting‐state fMRI functional connectivity in healthy adults: The influence of basal carbon dioxide. NeuroImage, 132, 301–313. [DOI] [PMC free article] [PubMed] [Google Scholar]
- Griffa, A. , Baumann, P. S. , Thiran, J. P. , & Hagmann, P. (2013). Structural connectomics in brain diseases. NeuroImage, 80, 515–526. [DOI] [PubMed] [Google Scholar]
- Kassner, A. , Winter, J. D. , Poublanc, J. , Mikulis, D. J. , & Crawley, A. P. (2010). Blood‐oxygen level dependent MRI measures of cerebrovascular reactivity using a controlled respiratory challenge: Reproducibility and gender differences. Journal of Magnetic Resonance Imaging, 31, 298–304. [DOI] [PubMed] [Google Scholar]
- Lawrence, A. J. , Chung, A. W. , Morris, R. G. , Markus, H. S. , & Barrick, T. R. (2014). Structural network efficiency is associated with cognitive impairment in small‐vessel disease. Neurology, 83, 304–311. [DOI] [PMC free article] [PubMed] [Google Scholar]
- Lawrence, A. J. , Zeestraten, E. A. , Benjamin, P. , Lambert, C. P. , Morris, R. G. , Barrick, T. R. , & Markus, H. S. (2018). Longitudinal decline in structural networks predicts dementia in cerebral small vessel disease. Neurology, 90, e1898–e1910. [DOI] [PMC free article] [PubMed] [Google Scholar]
- Marshall, R. S. (2010). On the trail of chronic ischaemia. Journal of Neurology, Neurosurgery, and Psychiatry, 81, 240. [DOI] [PubMed] [Google Scholar]
- Mikulis, D. J. (2013). Chronic neurovascular uncoupling syndrome. Stroke, 44, S55–S57. [DOI] [PubMed] [Google Scholar]
- Para, A. E. , Sam, K. , Poublanc, J. , Fisher, J. A. , Crawley, A. P. , & Mikulis, D. J. (2017). Invalidation of fMRI experiments secondary to neurovascular uncoupling in patients with cerebrovascular disease. Journal of Magnetic Resonance Imaging, 46, 1448–1455. [DOI] [PubMed] [Google Scholar]
- Reginold, W. , Sam, K. , Poublanc, J. , Fisher, J. , Crawley, A. , & Mikulis, D. J. (2018). Impact of white matter hyperintensities on surrounding white matter tracts. Neuroradiology, 60, 933–944. [DOI] [PubMed] [Google Scholar]
- Reijmer, Y. D. , Fotiadis, P. , Piantoni, G. , Boulouis, G. , Kelly, K. E. , Gurol, M. E. , … Viswanathan, A. (2016). Small vessel disease and cognitive impairment: The relevance of central network connections. Human Brain Mapping, 37, 2446–2454. [DOI] [PMC free article] [PubMed] [Google Scholar]
- Rubinov, M. , & Sporns, O. (2010). Complex network measures of brain connectivity: Uses and interpretations. NeuroImage, 52, 1059–1069. [DOI] [PubMed] [Google Scholar]
- Sam, K. , Conklin, J. , Holmes, K. R. , Sobczyk, O. , Poublanc, J. , Crawley, A. P. , … Mikulis, D. J. (2016). Impaired dynamic cerebrovascular response to hypercapnia predicts development of white matter hyperintensities. Neuroimage Clinical, 11, 796–801. [DOI] [PMC free article] [PubMed] [Google Scholar]
- Sam, K. , Crawley, A. P. , Conklin, J. , Poublanc, J. , Sobczyk, O. , Mandell, D. M. , … Mikulis, D. J. (2016). Development of white matter hyperintensity is preceded by reduced cerebrovascular reactivity. Annals of Neurology, 80, 277–285. [DOI] [PubMed] [Google Scholar]
- Sam, K. , Crawley, A. P. , Poublanc, J. , Conklin, J. , Sobczyk, O. , Mandell, D. M. , … Mikulis, D. J. (2016). Vascular dysfunction in leukoaraiosis. AJNR. American Journal of Neuroradiology, 37, 2258–2264. [DOI] [PMC free article] [PubMed] [Google Scholar]
- Sam, K. , Peltenburg, B. , Conklin, J. , Sobczyk, O. , Poublanc, J. , Crawley, A. P. , … Mikulis, D. J. (2016). Cerebrovascular reactivity and white matter integrity. Neurology, 87, 2333–2339. [DOI] [PMC free article] [PubMed] [Google Scholar]
- Simões, R. , Mönninghoff, C. , Dlugaj, M. , Weimar, C. , Wanke, I. , van Cappellen van Walsum, A. M. , & Slump, C. (2013). Automatic segmentation of cerebral white matter hyperintensities using only 3D FLAIR images. Magnetic Resonance Imaging, 31, 1182–1189. [DOI] [PubMed] [Google Scholar]
- Slessarev, M. , Han, J. , Mardimae, A. , Prisman, E. , Preiss, D. , Volgyesi, G. , … Fisher, J. A. (2007). Prospective targeting and control of end‐tidal CO2 and O2 concentrations. The Journal of Physiology, 581, 1207–1219. [DOI] [PMC free article] [PubMed] [Google Scholar]
- Sobczyk, O. , Battisti‐Charbonney, A. , Fierstra, J. , Mandell, D. M. , Poublanc, J. , Crawley, A. P. , … Fisher, J. A. (2014). A conceptual model for CO2‐induced redistribution of cerebral blood flow with experimental confirmation using BOLD MRI. NeuroImage, 92, 56–68. [DOI] [PubMed] [Google Scholar]
- Sobczyk, O. , Crawley, A. P. , Poublanc, J. , Sam, K. , Mandell, D. M. , Mikulis, D. J. , … Fisher, J. A. (2016). Identifying significant changes in cerebrovascular reactivity to carbon dioxide. AJNR. American Journal of Neuroradiology, 37, 818–824. [DOI] [PMC free article] [PubMed] [Google Scholar]
- Sporns, O. , Tononi, G. , & Kötter, R. (2005). The human connectome: A structural description of the human brain. PLoS Computational Biology, 1, e42. [DOI] [PMC free article] [PubMed] [Google Scholar]
- Tuladhar, A. M. , Lawrence, A. , Norris, D. G. , Barrick, T. R. , Markus, H. S. , & de Leeuw, F. E. (2017). Disruption of rich club organisation in cerebral small vessel disease. Human Brain Mapping, 38, 1751–1766. [DOI] [PMC free article] [PubMed] [Google Scholar]
- Tuladhar, A. M. , van Dijk, E. , Zwiers, M. P. , van Norden, A. G. , de Laat, K. F. , Shumskaya, E. , … de Leeuw, F. E. (2016). Structural network connectivity and cognition in cerebral small vessel disease. Human Brain Mapping, 37, 300–310. [DOI] [PMC free article] [PubMed] [Google Scholar]
- Tuladhar, A. M. , van Uden, I. W. , Rutten‐Jacobs, L. C. , Lawrence, A. , van der Holst, H. , van Norden, A. , … de Leeuw, F. E. (2016). Structural network efficiency predicts conversion to dementia. Neurology, 86, 1112–1119. [DOI] [PMC free article] [PubMed] [Google Scholar]
- Valenti, R. , Reijmer, Y. D. , Charidimou, A. , Boulouis, G. , Martinez, S. R. , Xiong, L. , … Viswanathan, A. (2017). Total small vessel disease burden and brain network efficiency in cerebral amyloid angiopathy. Journal of the Neurological Sciences, 382, 10–12. [DOI] [PMC free article] [PubMed] [Google Scholar]
- Vesely, A. , Sasano, H. , Volgyesi, G. , Somogyi, R. , Tesler, J. , Fedorko, L. , … Mikulis, D. (2001). MRI mapping of cerebrovascular reactivity using square wave changes in end‐tidal PCO2 . Magnetic Resonance in Medicine, 45, 1011–1013. [DOI] [PubMed] [Google Scholar]
- Wiseman, S. J. , Booth, T. , Ritchie, S. J. , Cox, S. R. , Muñoz Maniega, S. , Valdés Hernández, M. D. C. , … Bastin, M. E. (2018). Cognitive abilities, brain white matter hyperintensity volume, and structural network connectivity in older age. Human Brain Mapping, 39, 622–632. [DOI] [PMC free article] [PubMed] [Google Scholar]
- Xu, X. , Lau, K. K. , Wong, Y. K. , Mak, H. K. F. , & Hui, E. S. (2018). The effect of the total small vessel disease burden on the structural brain network. Scientific Reports, 8, 7442. [DOI] [PMC free article] [PubMed] [Google Scholar]
- Yeh, F. C. , Verstynen, T. D. , Wang, Y. , Fernández‐Miranda, J. C. , & Tseng, W. Y. (2013). Deterministic diffusion fiber tracking improved by quantitative anisotropy. PLoS One, 8, e80713. [DOI] [PMC free article] [PubMed] [Google Scholar]