

Abstract
The dopaminergic system has a unique gating function in the initiation and execution of movements. When the interhemispheric imbalance of dopamine inherent to the healthy brain is disrupted, as in Parkinson's disease (PD), compensatory mechanisms act to stave off behavioral changes. It has been proposed that two such compensatory mechanisms may be (a) a decrease in motor lateralization, observed in drug‐naïve PD patients and (b) reduced inhibition ‐ increased facilitation. Seeking to investigate the differential effect of dopamine depletion and subsequent substitution on compensatory mechanisms in non‐drug‐naïve PD, we studied 10 PD patients and 16 healthy controls, with patients undergoing two test sessions — “ON” and “OFF” medication. Using a simple visually‐cued motor response task and fMRI, we investigated cortical motor activation — in terms of laterality, contra‐ and ipsilateral percent BOLD signal change and effective connectivity in the parametric empirical Bayes framework. We found that decreased motor lateralization persists in non‐drug‐naïve PD and is concurrent with decreased contralateral activation in the cortical motor network. Normal lateralization is not reinstated by dopamine substitution. In terms of effective connectivity, disease‐related changes primarily affect ipsilaterally‐lateralized homotopic cortical motor connections, while medication‐related changes affect contralaterally‐lateralized homotopic connections. Our findings suggest that, in non‐drug‐naïve PD, decreased lateralization is no longer an adaptive cortical mechanism, but rather the result of maladaptive changes, related to disease progression and long‐term dopamine replacement. These findings highlight the need for the development of noninvasive therapies, which would promote the adaptive mechanisms of the PD brain.
Keywords: dynamic causal modeling, effective connectivity, fMRI, lateralization, parametric empirical Bayes, Parkinson's disease
Abbreviations
- AveLI
average laterality index
- BOLD
blood oxygen‐level dependent
- CHUV
Centre Hospitalier Universitaire Vaudois
- conn‐LI
connectivity laterality index
- DA
dopamine
- DCM
dynamic causal modeling
- fM1
foot region of the primary motor cortex
- GLM
general linear model
- HC
healthy controls
- hM1
hand region of the primary motor cortex
- ICV
intracranial volume
- LfM1
left foot region of the primary motor cortex
- LhM1
left hand region of the primary motor cortex
- LI
laterality index
- LMM
linear mixed model
- LSMA
left supplementary motor area
- LvPMC
left ventral premotor cortex
- MT
magnetization transfer
- PD OFF
Parkinson's disease patients “OFF” dopaminergic medication
- PD ON
Parkinson's disease patients “ON” dopaminergic medication
- PD
Parkinson's disease
- PEB
parametric empirical Bayes
- PSC
percent BOLD signal change
- RfM1
right foot region of the primary motor cortex
- RhM1
right hand region of the primary motor cortex
- ROI
region of interest
- RSMA
right supplementary motor area
- RvPMC
right ventral premotor cortex
- SMA
supplementary motor area
- sub‐LI
subordinate‐laterality index
- TMS
transcranial magnetic stimulation
- UPDRS
Unified Parkinson's disease rating scale
- VOI
volume of interest
- vPMC
ventral premotor cortex
1. INTRODUCTION
Unilateral movements are known to recruit contralateral cortical regions, the contralateral basal ganglia and the ipsilateral cerebellum, which manifests as asymmetric neural activations in functional magnetic resonance imaging (fMRI; Dassonville, Zhu, Uurbil, Kim, & Ashe, 1997; Kim et al., 1993). However, under certain conditions, ipsilateral cortical structures are also activated to some extent, attenuating the lateralization of motor activation. An increase of motor activation symmetry has been reported in healthy populations — while executing complex tasks (Buetefisch, Revill, Shuster, Hines, & Parsons, 2014; Verstynen, Diedrichsen, Albert, Aparicio, & Ivry, 2004), during movement of the nondominant hand (Kobayashi, Hutchinson, & Schlaug, 2003), due to aging (Naccarato et al., 2006; Wu & Hallett, 2005) and in patients with unilateral brain lesions following stroke (Carr, Harrison, Evans, & Stephens, 1993; Guzzetta et al., 2007; Rehme, Fink, Von Cramon, & Grefkes, 2011; Shimizu et al., 2002). Drug‐naïve Parkinson's disease (PD) patients also show decreased lateralization of motor activation during unilateral movement, interpreted as adaptive compensation at the cortical and subcortical levels (Wu, Hou, Hallett, Zhang, & Chan, 2015).
Due to its key role in motor control, the dopaminergic system is a prime suspect for the modulation of motor lateralization. Interhemispheric imbalances in nigrostriatal dopamine (DA) levels, inherent to both humans and animals, have been shown to correlate with lateralization of motor behavior (de la Fuente‐Fernández, Kishore, Calne, Ruth, & Stoessl, 2000; Molochnikov & Cohen, 2014). It has been proposed that a time‐dependent mechanism differentially regulates the DA system in both hemispheres and that this mechanism is initially able to compensate for alterations in the endogenous DA imbalance related to neurodegeneration (Blesa et al., 2011; Molochnikov & Cohen, 2014).
One of the characteristic features of PD is the pathological imbalance in DA levels between the two hemispheres, which leads to pronounced motor symptom asymmetry (Samii, Nutt, & Ransom, 2004). However, clinical symptoms of PD do not appear until a significant proportion of striatal and nigral dopamine neurons is lost (Fearnley & Lees, 1991; Samii et al., 2004). The gradual progression of pathology is at first counterbalanced by adaptive cortico‐subcortical circuit‐level mechanisms, which act to preserve behavioral performance (Blesa et al., 2017). At the level of the basal ganglia, the less‐affected putamen is thought to play a compensatory role by strengthening its cortical output (Blesa et al., 2011; Wu et al., 2015). At the cortical level, deficient input from subcortical areas is compensated by reduced cortical inhibition and increased cortical facilitation (Rothwell & Edwards, 2013). These findings have been corroborated by transcranial magnetic stimulation (TMS; Ni, Bahl, Gunraj, Mazzella, & Chen, 2013) and effective connectivity (Wu et al., 2015) studies. The finding of decreased lateralization of motor activation in drug‐naïve PD is entirely compatible with the “reduced inhibition ‐ increased facilitation” hypothesis.
While dopamine substitution is the backbone of PD treatment, little is known about its interaction with the brain's adaptive mechanisms. To our knowledge, no study thus far has investigated the modulation of motor lateralization by long‐term dopamine depletion, nor the impact of the interaction between (mal)adaptive mechanisms of non‐drug‐naïve PD and dopamine substitution therapy on motor lateralization. Aiming to fill this gap, we designed an fMRI motor task to study neural activity during right and left hand and foot movements in PD patients on their usual dopaminergic medication, that is, the “ON” state, and after withdrawal of medication, the “OFF” state, as well as in healthy individuals.
Our objective was threefold. Firstly, we aimed to investigate whether the decrease in the motor activation asymmetry previously reported in drug‐naïve PD patients (Wu et al., 2015) was present at later stages of the disease in patients with long‐term dopaminergic treatment. Secondly, to identify the neural underpinnings of symmetry changes, we set out to examine the patterns of contra‐ and ipsilateral activations driving potential symmetry changes. Thirdly, we tested the differential effect of PD pathology and subsequent dopaminergic medication on the motor system by estimating effective connectivity with dynamic causal modeling (DCM; Friston, Harrison, & Penny, 2003; Friston, 2004).
We hypothesized that (1) the lateralization of motor activation is decreased in PD patients “OFF” medication, particularly during movements of the predominantly affected body side; (2) dopamine substitution in the “ON” state increases lateralization, at least partially reinstating the pronounced asymmetry observed in healthy individuals; (3) decreased lateralization is primarily the result of a (compensatory) increase in ipsilateral cortical activation; (4) altered network interactions in PD patients mirror lateralization changes observed through the analysis of activation laterality, conducted to address hypotheses (1) and (2), with dopamine administration partially reinstating “normal” connectivity. Hypothesis (1) has two possible implications: first, the cortical reorganization in PD leading to decreased lateralization may constitute an adaptive mechanism of compensation, whereby the relative contribution of the ipsilateral hemisphere is increased to support the production of unilateral movement. Secondly, decreased lateralization may be due to a maladaptive mechanism, whereby disease‐related processes lead to a decrease in contralateral activation. The implication of hypothesis (2) is that dopamine replacement counteracts disease‐related changes at the systems level, either rendering adaptive compensation redundant or nullifying maladaptive mechanisms. Hypothesis (3) implies that lateralization decrease is an adaptive mechanism, governed by the ipsilateral cortex. Finally, hypothesis (4) implies that cortical connectivity acts to compensate for pathological input from the basal ganglia and that dopamine substitution acutely obviates the need for the compensatory decrease of lateralization.
2. MATERIALS AND METHODS
2.1. Participants
Thirty‐two patients with idiopathic PD and twenty‐one age‐matched healthy controls (HC) were recruited from a tertiary care center for movement disorders and from the community, respectively. Patients were tested in two sessions, once after administration of their usual dopaminergic medication and once after withdrawal of medication for at least 23 hr. To be specific, patients were asked to stop taking their medication at noon the day before their MRI. Given that no MRI took place earlier than 11:00 a.m., the patients were off medication for at least 23 hr at the time of the scan and often even longer. Half of the patients, randomly selected, were tested first “OFF” and then “ON” medication while the other half were tested first “ON” and then “OFF.” The local ethics committee approved all protocols and all participants provided written informed consent in accordance with the Declaration of Helsinki.
Thirteen PD patients dropped out after the first session and were not included in further analysis. Additionally, one of the HC participants was excluded due to severe head motion artifacts in the structural MRI scan. To ensure relative homogeneity of the sample, our inclusion criteria were as follows: right‐handedness for all participants, left‐side symptom dominance (and left‐side symptom onset) and participation in both “OFF” and “ON” sessions for the PD patients (PD OFF and PD ON, respectively). Hand dominance was assessed using the Edinburgh Handedness Inventory (Oldfield, 1971). At each of the two sessions, the patients were examined using the UPDRS III motor rating scale by three board‐certified neurologists. UPDRS III scores were used to determine the dominant body side of symptoms and the main symptom type (see next section for details). The dominant symptom type for all PD patients was akineto‐rigidity rather than tremor, reinforcing the relative homogeneity of the sample.
Ten PD patients (five females) and seventeen HC participants (eight females) fulfilled the inclusion criteria. One additional HC participant had to be excluded due to a lack of significant task‐related activation in one of the volumes of interest (VOIs) used in the DCM analysis. Thus, 16 HC participants (7 females) were included in the study. For details see Table 1. There were no significant differences in age or handedness between the PD patients and HC groups.
Table 1.
Clinical details of study subject sample
| PD | HC | |
|---|---|---|
| Age (years) |
61.60 ± 9.03 (47 – 73) |
59.44 ± 8.88 (50 – 74) |
| Sex | 5 females, 5 males | 7 females, 9 males |
| Handedness | OFF: | |
|
91.70 ± 15.69 (52.38 – 100) |
76.61 ± 22.34 (27.27 – 100) |
|
| ON: | ||
|
92.46 ± 13.62 (60 – 100) |
||
| MoCA | OFF: | |
| 26.00 ± 2.75 | – | |
| ON: | ||
| 27.30 ± 1.89 | ||
| Hoehn and Yahr staging | OFF: | – |
| 1.72 ± 0.62 | ||
| ON: | ||
| 1.65 ± 0.63 | ||
| UPDRS III | OFF: | |
| 19.80 ± 8.34 | – | |
| ON: | ||
| 15.80 ± 8.07 | ||
| LED (mg/d) | OFF: | |
| – | – | |
| ON: | ||
| 681.90 ± 381.67 |
The levodopa equivalent dose (LED) was calculated for each Parkinson's disease participant as described in Tomlinson et al. (2010). Continuous and ordinal variable measures are given as (mean ± SD).
2.2. Clinical phenotype
We analyzed the clinical phenotype of PD participants using UPDRS III scores subdivided into three symptom categories — tremor, rigidity, bradykinesia (see Table S1 in Supporting Information for details about symptom categories and Table S2 for the resulting symptom‐specific subscores and laterality measures). We performed a linear mixed model (LMM) analysis of symptom‐specific subscores, using medication status (“OFF” and “ON”) and symptom type (rigidity, tremor, bradykinesia) as fixed effects and subject as a random effect. Planned comparisons were carried out to identify any significant between‐medication status (within‐symptom type) differences in subscores.
Besides calculating a symptom‐ and limb‐specific subscore, we also estimated the laterality of the given symptom type using a laterality index (LI) calculated according to Equation (1).
| (1) |
Subscore laterality varies between −1 for pure right‐side symptom dominance and +1 for pure left side symptom dominance. While we did not analyze symptom laterality further, we found that subscores were on average left‐lateralized for all symptom types individually and for the summary measure, as expected given our inclusion criteria of left‐side symptom dominance.
We also sought to confirm the expected effect of medication on clinical scores (i.e., a significant decrease in observed symptoms) and, in particular, to investigate whether there is a discrepancy in the effect of medication between the right and left body side and between hands and feet. Thus, we performed an LMM analysis of the dominating symptom (bradykinesia) subscores with medication status (“OFF” or “ON”), body side (right or left) and limb (hand or foot) as fixed effects and subject as a random effect. We modeled the main effects and all interactions of the three fixed effects factors. Planned comparisons were carried out to identify any significant between‐medication status (within‐body side and within‐limb) differences.
Throughout the study, analyses of mixed effects models were conducted using the lme4 library (Bates, Maechler, Bolker, & Walker, 2015) in RStudio (RStudio, 2012), the integrated development environment for R (R Core Team, 2018), using Satterthwaite approximations to degrees of freedom as implemented in the lmerTest library (Kuznetsova, Brockhoff, & Christensen, 2017). The p‐values obtained through planned comparisons were adjusted using the Bonferroni method, using an alpha value of .05. The number of tests that were corrected for corresponded to the total number of between‐group comparisons (within each combination of levels of the other factors in the given analysis).
2.3. MRI data acquisition
MRI data were acquired using a 3‐T whole‐body MRI system (Magnetom Prisma, Siemens Medical Systems, Germany), using a 64‐channel RF receive head coil and body coil for transmission. fMRI data were acquired using a 3D EPI protocol at 2‐mm isotropic resolution, with 3.328‐s repetition time, 30‐ms echo time and 15° flip angle (Lutti, Thomas, Hutton, & Weiskopf, 2013). A 96 × 96 base resolution was used, with 60 axial slices approximately parallel to the AC/PC line covering the entire cortex, with 192‐mm field of view. During the scan, participants lay supine in the scanner and performed an externally‐paced motor task.
Anatomical data consisted of 1.5‐mm isotropic multi‐parameter maps (Helms, Dathe, & Dechent, 2008; Helms, Dathe, Kallenberg, & Dechent, 2008; Lutti, Dick, Sereno, & Weiskopf, 2014) and included a magnetization transfer (MT) saturation image, which was used for fMRI data preprocessing.
2.4. Experimental design
Inside the scanner, participants performed cued movements of each of the four limbs in a block design, with 16‐s blocks alternating with 16‐s rest periods. A 3‐s countdown period preceded each block and consisted of written instructions displayed on the screen, indicating which limb was to be moved in the upcoming block. Within a block, movements were externally paced at a frequency of 0.5 Hz by means of visual cues in the form of symbols representing the limb to be moved. The experimental design comprised 5 blocks for each limb, with 8 cued movements per block, for a total of 40 cued movements per limb.
Hand movements involved squeezing a fist‐sized rubber ball, while foot movements entailed pressing a foot pedal with an equally‐sized rubber ball underneath. The rubber balls were connected to a custom MR‐compatible device, which, through a system of pneumatic tubes and air‐pressure sensors, recorded force levels in arbitrary units at a 500‐Hz sampling rate. The recorded force values were converted into Newtons using an empirically‐derived transfer function separately for the hand and foot recording systems.
It is important to note that our goal was not to elicit behavioral differences between healthy controls and patients; the motor execution task was physically and cognitively undemanding. Rather, we were interested in disease‐ and medication status‐related differences that were independent of between‐group differences in motor performance.
2.5. Behavioral data analysis
For each subject and each movement condition (right hand, left hand, right foot, left foot), we calculated the average percent correct and force of movements across all blocks. We conducted a multivariate LMM analysis of the behavioral data, including a dummy variable fixed effect corresponding to the type of behavioral measure (percent correct, force), modeled with random slopes. We used group (PD OFF, PD ON, HC), body side (right, left) and limb (hand, foot) as fixed effects and subject as a random effect. We modeled the main effects and all interactions of the dummy variable fixed effect and three nondummy fixed effects factors. Age, sex and handedness were also included as fixed effects and used as covariates. Planned comparisons were carried out to identify any significant between‐group (within‐body side and within‐limb) differences. The p‐values obtained through planned comparisons were adjusted using the Bonferroni method.
When comparing all three groups, we did not account for repeated measures between the PD OFF and PD ON groups. While this design is not strictly correct, we have assumed that the variance related to medication status is significantly higher than the intersubject variance.
2.6. MRI data preprocessing
Imaging data preprocessing, statistical analysis, and dynamic causal modeling were done using the statistical parametric mapping (SPM), software package (SPM12, Wellcome Trust Centre for Neuroimaging, London, UK, http://www.fil.ion.ucl.ac.uk) in MATLAB 9.1 (The MathWorks, Inc., Natick, MA). Functional images were spatially realigned to the mean of the whole time‐series using rigid‐body transformations to correct for head motion. A B0 field map image acquired during the session was then used to correct for EPI image distortion. The anatomical (MT) image was co‐registered to the mean fMRI volume using mutual information. A study‐specific template was built using the diffeomorphic spatial registration tool DARTEL (Ashburner, 2007). The realigned, bias‐corrected functional images were then spatially registered to the standardized Montreal Neurological Institute space using the parameters estimated in DARTEL. Finally, all images were spatially smoothed with a 6‐mm full‐width‐at‐half‐maximum kernel.
2.7. FMRI data analysis
First‐level analysis consisted of a general linear model (GLM) with one regressor for each “correct” and “incorrect” limb movement. “Incorrect” movements were defined to include both wrong one‐limb movements and simultaneous movements of more than one limb within the same 2‐s interval following the cued onset. The corresponding eight movement regressors modeled movements as events (0‐s duration) and timed them according to the presentation of visual cues. An additional regressor modeled the 3‐s countdown periods before each block. Six motion covariates that resulted from the motion correction preprocessing step were also included in the design to account for additional head motion‐related variance. The time‐series in each voxel was high‐pass filtered at 1/128 Hz to remove low‐frequency drifts, and regressors were convolved with a canonical hemodynamic response function.
The parameter estimates for the four “correct” movement conditions were used at the group level as the dependent variable in a full‐factorial two‐factor repeated‐measures analysis of variance (ANOVA), with body part moved as a within‐subject factor and group as a between‐subject factor. The purpose of this ANOVA was to find group activation maxima within anatomically predefined regions of interests (ROIs) to be used in the VOI definition procedure for the DCM analysis. Activation maxima found in three separate single‐group ANOVAs were not notably different from those identified in the general three‐group ANOVA.
Notably, we did not find any between‐group differences through the mass‐univariate ANOVA at p < .05, FWE‐corrected. The lack of significant between‐group differences is consistent with previous fMRI studies of PD (e.g., Michely et al., 2015). In terms of the commonalities between groups, results were perfectly consistent with the activations that have previously been reported during unilateral movement, that is, extensive activation in contralateral motor cortex (primary motor cortex, supplementary motor area, premotor cortex), as well as contralateral basal ganglia and ipsilateral cerebellum. We include the blood oxygen‐level dependent (BOLD) activation results in Supporting Information ( Figures S1 and S2 ).
We focused on key cortical regions of the motor network: the hand and foot regions of the primary motor cortex (hM1 and fM1, respectively), the supplementary motor area (SMA) and the ventral premotor cortex (vPMC). The model included eight bilateral ROIs: right and left hand and foot M1 (RhM1, LhM1, RfM1, LfM1, respectively), right and left supplementary motor area (RSMA, LSMA) and right and left ventral premotor cortex (RvPMC, LvPMC). For details see Figure 1 and Table 2 . Individual ROI locations can be found in Table S6.
Figure 1.
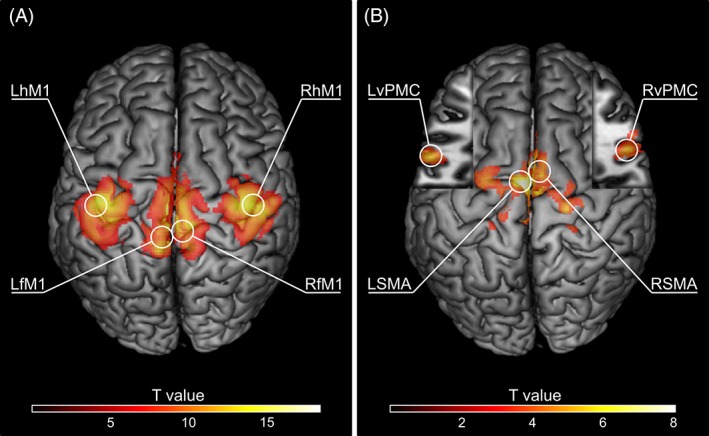
Topography of the clusters containing group‐level BOLD activation maxima within the regions of interest (ROIs) used in the current study. (A) Primary motor cortex ROI peak activation clusters for the four experimental conditions (right hand movement results in LhM1 activation, left hand movement results in RhM1 activation, right foot movement results in LfM1 activation, and left foot movement results in RfM1 activation; p < .05, FWE corrected). (B) SMA and vPMC peak activation clusters for two conjunction analyses (right hand movement ∩ right foot movement results in LSMA and LvPMC activation, left hand movement ∩ left foot movement results in RSMA and RvPMC activation; MNI z = 17 in cut‐outs; p < .001, uncorrected). Only those clusters containing group‐level peaks are shown. Maxima used for VOI extraction procedure are circled and labeled [Color figure can be viewed at http://wileyonlinelibrary.com]
Table 2.
Anatomical location descriptions of ROIs used in the present study and corresponding group‐level peak coordinates
| Region | Anatomical location | Coordinates (mm) | ||
|---|---|---|---|---|
| x | y | z | ||
| RhM1 | Right M1 (hand area), BA4 | 36 | −23 | 54 |
| LhM1 | Left M1 (hand area), BA4 | −38 | −23 | 54 |
| RfM1 | Right M1(foot area), BA4 | 4 | −31 | 67 |
| LfM1 | Left M1 (foot area), BA4 | −4 | −36 | 63 |
| RSMA | Right supplementary motor area | 6 | 1 | 59 |
| LSMA | Left supplementary motor area | −5 | −7 | 66 |
| RvPMC | Right ventral premotor cortex, BA6 | 57 | 12 | 17 |
| LvPMC | Left ventral premotor cortex, BA6 | −57 | 8 | 17 |
To establish a clear link between the parts of our hypothesis related to contra‐ and ipsilateral BOLD signal change and effective connectivity (hypotheses [3] and [4]) and to account for intersubject variability in motor activations (Nieto‐Castañón & Fedorenko, 2013), we used the same motor ROIs throughout our analysis.
2.8. Analysis of activation laterality
To address hypotheses (1) and (2), we estimated motor activation (a)symmetry using a threshold‐free LI measure (Matsuo, Chen, & Tseng, 2012). This method overcomes one of the key limitations of the classical LI, namely the critical dependence of LI estimates on the chosen statistical threshold (Seghier, 2008). In this method, one first calculates “subordinate‐LIs” (sub‐LIs) using the subject‐level SPM t‐value map corresponding to the pertinent condition, consecutively thresholding at each of the positive t‐values of the voxels within the given ROI, as given by Equation (2).
| (2) |
where t left and t right are the sums of the t‐values at and above the threshold in the left and right hemispheres, respectively. The final measure, the average LI (AveLI), is then calculated as the mean of all sub‐LIs for the given condition. Its value varies between −1 for pure right hemispheric dominance and +1 for pure left hemispheric dominance. We calculated the AveLI separately for each subject and for each of the four movement conditions. Since our goal in this step of analysis was to explore whether we could replicate previously reported results in drug‐naïve PD patients (Wu et al., 2015), we applied the same preprocessing step when calculating the LI. That is, to reflect the typical laterality of the motor system, the supra‐threshold t‐values in the right cerebellum were included in t left and those in the left cerebellum were included in t right in the above equation. This step is related to the fact that, whereas in the basal ganglia and the cortex, unilateral movements elicit contralateral activation, in the cerebellum, activation is primarily ipsilateral.
We conducted an LMM analysis of the AveLI, using group, body side and limb as fixed effects and subject as a random effect. We modeled the main effects and all interactions of the three fixed effects factors. Age, sex, and handedness were included as fixed effects and used as covariates. Planned comparisons were carried out to identify any significant between‐group (within‐body side, within‐limb) differences. The p‐values obtained through planned comparisons were adjusted using the Bonferroni method.
2.9. VOI definition
The VOI definition procedure was based on the work of Heim et al. (2009) and Pool, Rehme, Fink, Eickhoff, & Grefkes (2013). For each subject and each ROI, we identified the individual local maximum (p < .05, uncorrected) that was closest to the group maximum within a 2‐cm‐radius spherical search volume and within the same atlas‐defined anatomical region. Group maxima were identified using contralateral hand/foot movement contrast for right and left h/fM1 ROIs, respectively, and through a conjunction analysis of contralateral limb (hand and foot) conditions for the remaining ROIs (SMA, vPMC). For each VOI, time series were extracted as the first eigenvariate of the BOLD time series within an 8‐mm‐diameter sphere centered on the local maximum, adjusted for effects of interest (an F‐contrast over the “correct” limb movements). Two exclusive masks were used to further constrain the local maxima: a box mask of 8‐mm width centered on the midline was used to guarantee that VOIs did not overlap with the contralateral hemisphere; an eroded image of the ICV (intracranial volume) ensured that the VOI spheres did not fall outside of the brain.
If there was no significant activation within the 2‐cm‐radius search volume of the group peak for one or more of the ROIs, the subject was removed from further analysis. This was the case for one HC participant (no activation in bilateral vPMC).
2.10. Percent BOLD signal change analysis
To address hypothesis (3) by distinguishing between the various scenarios which could explain differences in laterality (Figure 2), we next quantified contralateral and ipsilateral activation magnitudes in percent BOLD signal change (PSC) using the Marsbar toolbox (http://marsbar.sourceforge.net; Brett, Anton, Valabregue, & Poline, 2002). For each subject and each movement condition, we estimated the mean contralateral and ipsilateral PSC within each cortical ROI.
Figure 2.
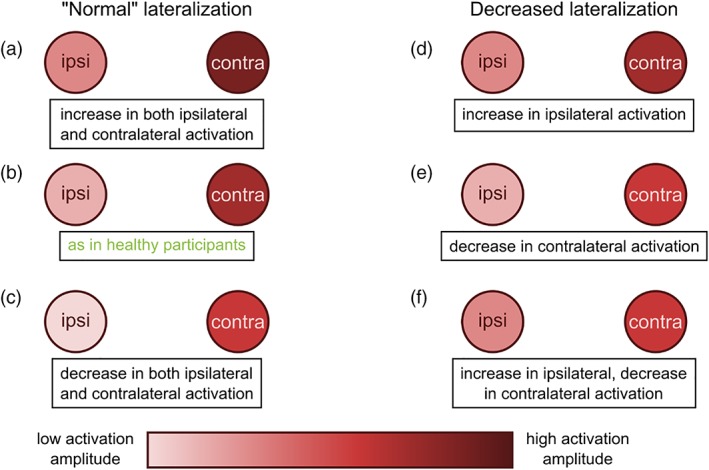
Possible contralateral‐ipsilateral activation scenarios leading to a decrease in activation laterality. “Normal” lateralization, that is, as seen in healthy participants (b), could also occur in participants with either concurrent increase (a) or concurrent decrease (c) in both contralateral and ipsilateral activation. On the other hand, a decrease in lateralization could arise from one of three possible scenarios: (d) an increase in ipsilateral activation, (e) a decrease in contralateral activation, or (f) a concurrent increase in ipsilateral and decrease in contralateral activation [Color figure can be viewed at http://wileyonlinelibrary.com]
We conducted an LMM analysis of the PSC analogous to the one for AveLI, using group, body side, limb, and laterality (contra‐ or ipsilateral) as fixed effects and subject as a random effect. Age, sex and handedness were included as fixed effects and used as covariates. Planned comparisons were carried out to identify any significant between‐group (within‐body side, within‐limb, within‐laterality) differences. The p‐values obtained through planned comparisons were adjusted using the Bonferroni method.
In a supplementary analysis, we constructed an analogous LMM on the differences between contralateral and ipsilateral PSC, using group, body side and limb as fixed effects and subject as a random effect.
2.11. Dynamic causal modeling
In dynamic causal modeling, the brain is considered to be a deterministic nonlinear input–state–output dynamic system of nodes in a predefined anatomical network (Friston, 2004; Friston et al., 2003). The model is defined by a set of neural parameters representing the effective connectivity of the network: the DCM.A matrix — endogenous connectivity between nodes, the DCM.B matrix — input‐dependent modulation of connectivity between nodes, and the DCM.C matrix — the direct driving effects of the input.
To address hypothesis (4), we computed the effective connectivity between key motor areas of the cortical nonmirroring network — RhM1, LhM1, RfM1, LfM1, RSMA, LSMA, RvPMC, LvPMC, using a bilinear DCM. Endogenous connectivity between the ROIs was based on previous DCM studies of upper and lower limb motor network connectivity (Grefkes, Eickhoff, Nowak, Dafotakis, & Fink, 2008; Pool, Rehme, Fink, Eickhoff, & Grefkes, 2014; Volz, Eickhoff, Pool, Fink, & Grefkes, 2015; Wang & Liu, 2015). For the full DCM, see Figure 3.
Figure 3.
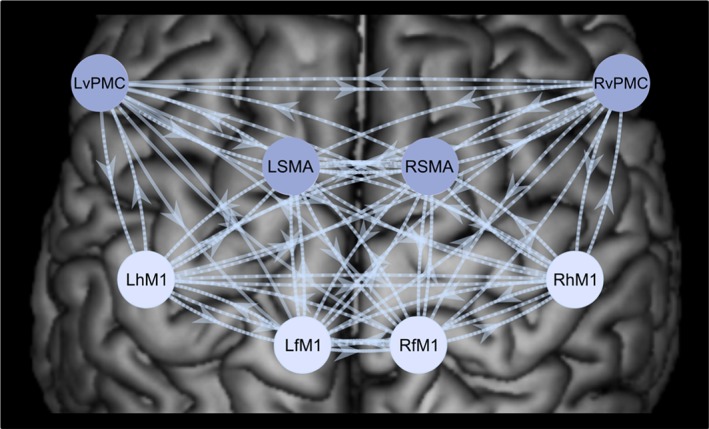
Full dynamic causal model (DCM), including eight nodes — bilateral hM1, fM1, SMA, and vPMC. The arrows between the nodes of the cortical motor network represent the endogenous connectivity (DCM.A matrix), as well as the modulatory influences (DCM.B matrix) of the full model, where all possible modulatory connections are present. The four darker shaded nodes represent the targets of the driving input (DCM.C matrix), consisting of right hand, left hand, right foot, and left foot movements [Color figure can be viewed at http://wileyonlinelibrary.com]
2.12. DCM model space
We designed the model space so as to characterize the laterality and structure of the input‐modulatory (DCM.B) motor network connectivity (Figure 4). The resulting model space consisted of 75 models, divided into five laterality model families and 15 structure model families, described below. Each of the 75 models belonged to one laterality model family and one structure model family.
Figure 4.
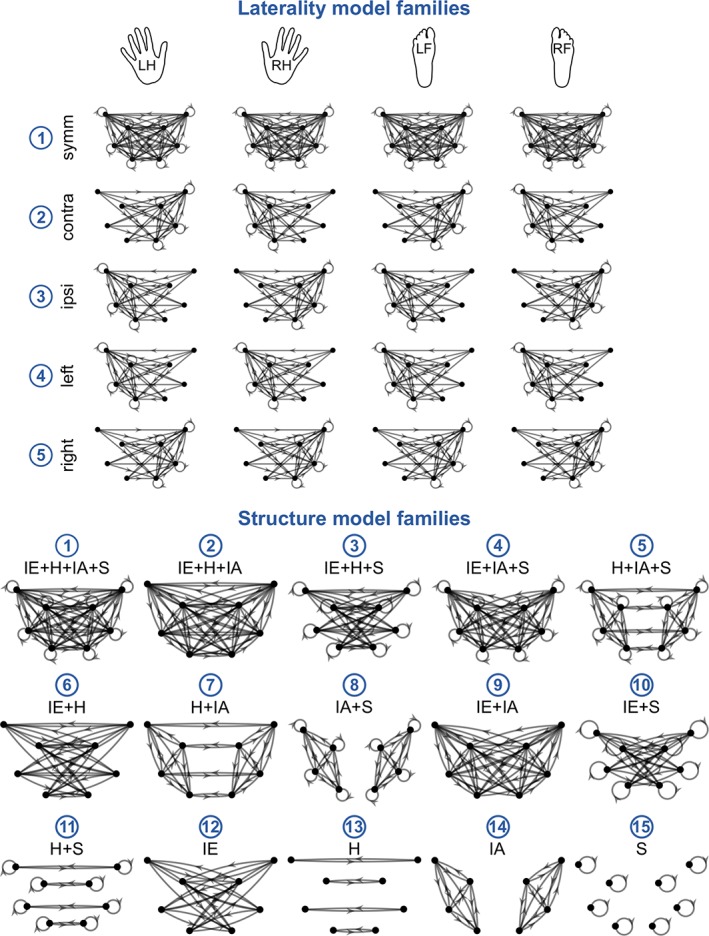
The architecture of models in the DCM model space could be described by two factors: laterality and structure, which were modeled by five laterality model families (top) and 15 structure model families (bottom). The two factors were fully crossed, yielding a total of 75 models. The DCM model space was designed to test hypotheses about the architecture of the DCM.B matrix of input‐modulatory connectivity for the four movement conditions: Left hand, right hand, left foot and right foot. We tested five laterality model families: (1) symmetrical, (2) contralaterally‐lateralized, (3) ipsilaterally‐lateralized, (4) left‐lateralized, and (5) right‐lateralized, and 15 structure model families, which varied according to the presence or absence of various types of connections: interhemispheric (IE), homotopic (H), intrahemispheric (IA), and self‐inhibitory (S) [Color figure can be viewed at http://wileyonlinelibrary.com]
In order to characterize the laterality of motor network connectivity, we considered five laterality model families: (1) symmetrical, (2) contralaterally‐lateralized, (3) ipsilaterally‐lateralized, (4) left‐lateralized, and (5) right‐lateralized. Symmetrical models contained connections targeting both hemispheres, whereas lateralized models contained connections targeting the contralateral/ipsilateral/left/right hemisphere. The reference for the contra‐ and ipsilaterally‐lateralized models was the input condition, i.e., the connections in the contralaterally‐lateralized model targeted the left hemisphere for the right hand and right foot movement conditions and, respectively, the right hemisphere for the left hand and left foot movement conditions.
We characterized the structure of the estimated connectivity networks by the presence or absence of the following types of connectivity: interhemispheric, homotopic, intrahemispheric, and self‐inhibitory. Interhemispheric connections were defined as those whose source and target nodes lay in different hemispheres, excluding homotopic connections, e.g., the connection RhM1 ➔ LSMA. Homotopic connections were defined as those connecting homologous ROIs, e.g., the connection RhM1 ➔ LhM1. Intrahemispheric connections were defined as those whose source and target nodes lay within the same hemisphere, excluding self‐inhibitory connections, e.g., the connection RSMA ➔ RhM1. Finally, self‐inhibitory connections were defined as those whose source and target nodes were one and the same, e.g., the connection RhM1 ➔ RhM1. While self‐inhibitory connections are a subset of intrahemispheric connections and homotopic connections are a subset of interhemispheric connections, we considered intrahemispheric connections to include all intrahemispheric connections except for those which are self‐inhibitory, and, analogously, interhemispheric connections were considered to be all interhemispheric connections with the exception of homotopic connections. We considered all possible combinations of the presence or absence of the four types of connectivity, which yielded 15 structure model families.
The two factors, laterality and structure, represented by the model families described above, were fully crossed, yielding 75 models in total. For a full representation of the model space, please refer to Figures S3–S5 in Supporting Information.
2.13. Parametric empirical BAYES
We used parametric empirical Bayes (PEB) to estimate between‐group commonalities and differences in connectivity strengths (Friston et al., 2015; Friston, Zeidman, & Litvak, 2015; Litvak, Garrido, Zeidman, & Friston, 2015). In this approach, one constructs a PEB model — a group‐level GLM, over the first‐level DCM parameter estimates, enabling the evaluation of group effects and between‐subject variability. Next, one can compare the full PEB model to nested PEB models in which some of the connections from the full model are absent. This can either be done by comparing specific hypotheses, as in the case of the standard approach which uses a predefined model space, or by pruning away parameters of the PEB based on their (lack of) contribution to the model evidence. This second approach is equivalent to searching over the models nested within the full model. The output of the PEB procedure is a group‐level PEB model, which contains estimates of group‐level connection strengths and their posterior probabilities (Pp). SPM12 includes an implementation of the PEB modeling approach.
We first estimated the full model (Figure 3) for all subjects and used Bayesian model reduction to estimate models 2 – 75 (Figure 4). We then built separate PEB models for the (full) DCM.A, DCM.B, and DCM.C connectivity matrices. In the group‐level GLM of each PEB model, we included three regressors, which modeled the between‐group commonalities, the effect of disease and the effect of medication, respectively. Between‐group commonalities were modeled as a column of ones. The effect of disease was modeled as the comparison between PD OFF and HC, with ones in rows corresponding to PD OFF patients, zeros in rows corresponding to PD ON patients and negative ones in the rows corresponding to HC subjects. The effect of medication was modeled as the comparison between PD OFF and PD ON, with ones in the rows corresponding to PD OFF patients, negative ones in rows corresponding to PD ON patients and zeros in the rows corresponding to HC subjects. The second and third regressors were then mean‐centered in order to endow the first (group mean) regressor with the interpretation of being the average across all subjects.
Here, we had to account for a practical consideration intrinsic to the PEB framework, i.e., that the model comparison procedure is only carried out on the first regressor (mean) and the second regressor (first group difference). Therefore, to ask which of the 75 models are the best explanations for disease and medication effects, we ran the model comparison procedure twice, with different orders of regressors in the design matrix (first: mean, disease status, medication status; and second: mean, medication status, disease status).
For the DCM.A and DCM.C PEB models, we did not have specific hypotheses regarding the structure of group‐level effects, thus we conducted a search over nested models using the PEB pruning algorithm. Meanwhile, for the DCM.B PEB model, we conducted Bayesian model family selection — selecting the winning model family in terms of both laterality (laterality model families) and structure (structure model families) — and Bayesian model selection — comparing all 75 models in the model space. In both the hypothesis‐free pruning and the model‐based approaches, we obtained Bayesian model averages (BMA), corresponding to connection strengths across models, weighted by the contributing models' probabilities. We used the BMA results to visualize the connectivity corresponding to the commonalities and disease‐ and medication‐related differences.
As a final analysis, we characterized the between‐group differences, classifying each connection into one of four categories: increased excitation, reduced excitation, increased inhibition and reduced inhibition. This characterization was done on the BMA results. The categorization was based on the concomitant statistical significance of both the parameter corresponding to the given between‐group difference and the parameter corresponding to commonalities between groups. Thus, the category increased excitation was applied to a connection if the commonalities parameter was significantly (Pp > 0.75 throughout) greater than zero and the between‐group difference parameter was also significantly greater than zero; the category reduced excitation was applied to a connection if the commonalities parameter was significantly greater than zero and the between‐group difference parameter was significantly smaller than zero; and so on for the remaining categories. Parameters with confidence intervals crossing zero were considered to have an indeterminate sign and were not included in the categorization.
3. RESULTS
3.1. Clinical phenotype results
LMM analysis of UPDRS III symptom type‐specific subscores revealed significant main effects of symptom type and medication status (Table S3). The main effect of symptom type reflects the findings that subscores for bradykinesia were higher than for the remaining symptom types, in accordance with bradykinesia being the main symptom type in our cohort. The main effect of medication status (PD OFF vs. PD ON) reflects the finding that symptom type‐specific subscores were higher in PD OFF than in PD ON, as would be expected given the effects of dopamine replacement. Moreover, we observed a significant symptom type × medication status interaction, driven by a significant between‐medication status difference in bradykinesia subscores as revealed through planned comparisons (p = 2.26E−3, t[33.33] = 3.31). Between‐medication status differences were not significant for the remaining two symptom types (rigidity and tremor).
A more detailed analysis of bradykinesia subscores (Table S4) revealed significant main effects of medication status (with higher scores in PD OFF), body side (higher scores on left side) and limb (higher scores for upper limbs). Planned comparisons did not reveal any significant between‐medication status (within‐body side, within‐limb) differences in the analysis of bradykinesia subscores. However, the finding of interest here was the main effect of medication status, confirming the effects of medication on clinical scores.
3.2. Behavioral results
Behavioral results, including percent correct and force of movements for each of the four limb movement conditions, can be found in Figure 5. Multivariate LMM analysis of percent correct of movements and force as registered during the fMRI session showed neither a main effect of group nor an interaction between group and any of the other factors (see Table S7). We did, however, observe a significant main effect of limb, with relatively fewer correct movements and weaker movements being carried out by the feet as compared to the hands. We also observed a significant interaction between behavioral measure (percent correct/force) and limb, related to the greater disparity in force levels between hand and foot movement conditions, as compared to that of accuracy levels. These findings were not of interest per se as we were not interested in comparing hand and foot movement‐related brain activation or connectivity but rather in the commonalities between them.
Figure 5.
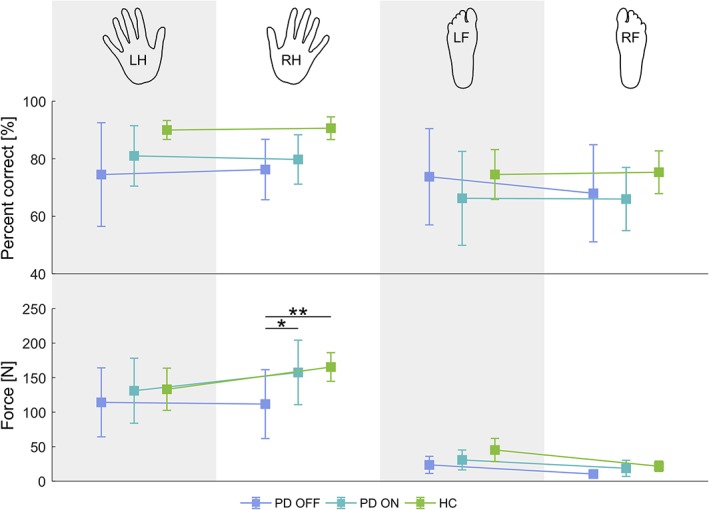
Behavioral results. The hand/foot icons at the top of the figure represent the body part (LH — left hand, RH — right hand, LF — left foot, RF — right foot) being moved in the corresponding condition. Top row: average percent correct of movements, per limb for each group. Values represent the percentage of correct movements of the total cued movements for the given limb. Bottom row: average force per limb for each group. Error bars represent 95% confidence intervals. Any significant between‐group (within‐body side, within‐limb) differences are indicated (* p < .05, ** p < .01, Bonferroni‐corrected) [Color figure can be viewed at http://wileyonlinelibrary.com]
Finally, we observed a significant three‐way interaction — behavioral measure × body side × limb — related to the fact that while accuracy levels where on average comparable across body side, force levels were higher during dominant (right) than left hand movements and vice versa for foot movements. We do not have a good explanation for this finding, as handedness and footedness should be ipsilateral.
Nevertheless, what interested us most was whether or not there were any between‐group differences. Planned comparisons revealed significant between‐group differences only in terms of the force of right hand movement, between PD OFF and HC (p = 3.92E−3, t[90.95] = 3.32) and between PD OFF and PD ON (p = 3.24E−2, t[88.83] = 2.60). These findings were related to decreased force of movement in the PD OFF group. As noted in Section 2, our goal was not to elicit behavioral differences between healthy controls and patients but rather to make the task simple enough so that PD patients could execute it at the same level as healthy controls. However, the patients included in the study all had bradykinesia as their main symptom type, meaning that the time from movement cue onset to peak force was longer than for healthy controls. We believe this to be the source of the observed decrease in right hand movement force in PD OFF and the reinstatement of force in PD ON.
Notably, the force of movement has been reported to correlate with both amplitude and extent of fMRI activation. It is unclear whether this finding affects our chosen ROIs. Some studies have reported widespread correlations with force across motor areas (Dai, Liu, Saghal, Brown, & Yue, 2001; Omrani, Kaufman, Hatsopoulos, & Cheney, 2017), while in other cases, the only reported region that overlapped with our ROIs was M1 (Ward & Frackowiak, 2003; Ward, Swayne, & Newton, 2008). To our knowledge, no study thus far has considered the effect of force of movement on effective connectivity within the cortical motor network. We addressed this issue in supplementary analyses of PSC and effective connectivity (see Supporting Information). In short, we did not find any significant correlations between force and PSC nor force and effective connectivity, and so we have omitted force from the rest of our analysis.
3.3. Activation laterality results
Addressing hypotheses (1) and (2), we estimated the AveLI for each of the four movement conditions, for each subject within the three groups — PD OFF, PD ON, and HC (Figure 6). Since right hemispheric dominance is represented by negative AveLI values, for presentation purposes in comparing AveLI amplitudes between body sides, the sign of AveLI values for left hand and foot movement has been changed to positive.
Figure 6.
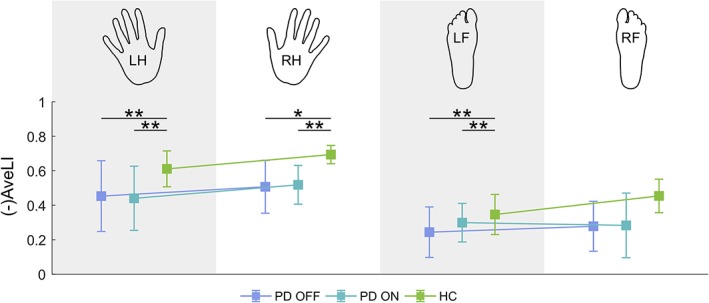
Average laterality index (AveLI) for each experimental condition. The hand/foot icons at the top of the figure represent the body part (LH — left hand, RH — right hand, LF — left foot, RF — right foot) being moved in the corresponding condition. Since right hemispheric dominance is represented by negative AveLI values, for the sake of clarity of the visual representation, the sign of AveLI values for left hand and foot movement has been changed. Error bars represent 95% confidence intervals. Any significant between‐group (within‐body side, within‐limb) differences are indicated (* p < .05, ** p < .01, Bonferroni‐corrected) [Color figure can be viewed at http://wileyonlinelibrary.com]
LMM analysis revealed significant main effects of group and limb (for details, see Table S8), with generally higher AveLI values observed in the HC group than in the PD groups and higher AveLI values in the hand than in the foot movement conditions. Planned comparisons revealed significant between‐group differences in the following instances: left hand movement — between PD OFF and HC (t[102.59] = 3.19, p = 5.66E−3) and between PD ON and HC (t[101.96] = 3.08, p = 8.09E−3), right hand movement — between PD OFF and HC (t[102.59] = 2.82, p = 1.72E−2) and PD ON and HC (t[101.96] = 3.02, p = 9.68E−3), left foot movement — between PD OFF and HC (t[102.59] = 3.05, p = 8.66E−3) and between PD ON and HC (t[101.96] = 3.02, p = 9.60E−3).
In summary, we found that AveLI measures of the PD participants were not restored to HC levels by dopamine substitution in the “ON” session. The AveLI measures of the PD ON group were consistently at similar levels to those of PD OFF across all movement conditions.
3.4. Percent bold signal change results
Addressing hypothesis (3), we estimated the PSC for each of the four movement conditions, within each ROI, for each subject within the three groups (Figure 7). The results of the multivariate LMM analysis of PSC are presented in Table S9. Here, we were most interested in the differential presence of between‐group differences across the four limb conditions and across ROIs. A significant full interaction — group × body side × limb × ROI × laterality, would indicate the differential presence of between‐group differences between the different combinations of the remaining fixed effects — right versus left body side, hands versus feet, M1 versus SMA versus vPMC, and contra‐ versus ipsilateral ROIs. The effect of “laterality” was not of interest per se, as it was evident that contra‐ and ipsilateral activations would be highly different, particularly in M1. While the full interaction was not significant, the four‐way group × body side × ROI × laterality interaction was.
Figure 7.
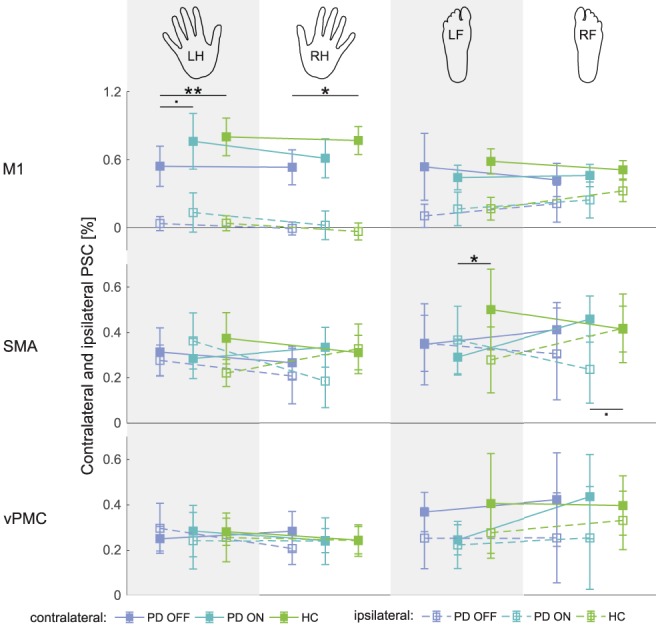
Percent BOLD signal change in contralateral and ipsilateral regions of interest for each experimental condition. The hand/foot icons at the top of the figure represent the body part (LH — left hand, RH — right hand, LF — left foot, RF — right foot) being moved in the corresponding condition. Error bars represent 95% confidence intervals. Any significant between‐group (within‐body side, within‐limb, within‐ROI) differences are indicated (. p < 0.1, * p < .05, ** p < .01, Bonferroni‐corrected) [Color figure can be viewed at http://wileyonlinelibrary.com]
Planned comparisons revealed significant between‐group differences in the left hand movement condition in contralateral M1 — between PD OFF and HC (t[268.04] = 3.37, p = 2.61E−3) and between PD OFF and PD ON (t[313.82] = 2.31, p = 6.39E−2), in the right hand movement condition in contralateral M1 — between PD OFF and HC (t[268.04] = 2.68, p = 2.32E−2), in the left foot movement condition in contralateral SMA — between PD ON and HC (t[264.41] = 2.51, p = 3.80E−2) and in the right foot movement condition in ipsilateral SMA — between PD ON and HC (t[264.41] = 2.37, p = 5.53E−2). In summary, we found significant between‐group differences primarily in terms of contralateral PSC, with dopamine substitution reinstating “normal” activation magnitude. However, there were also instances of medication‐related abnormalities in the absence of disease‐related alterations of PSC, that is, significant differences in PD ON versus HC but not PD OFF versus HC.
In a supplementary analysis, we examined the differences between contralateral and ipsilateral PSC across movement conditions and ROIs (Figure S6 and Table S10 in Supporting Information). The results are described in detail in the Supporting Information, but the key finding was that significant PD OFF versus HC differences were present only in the M1 and significant PD ON versus HC differences were present only in the SMA. Considering the results of the two PSC analyses (i.e., contra‐ and ipsilateral PSC separately and differences between contra‐ and ipsilateral PSC), we found that the decrease in laterality observed in the AveLI analysis may be the result of either a decrease in contralateral PSC or a simultaneous decrease in contralateral and increase in ipsilateral PSC. However, our results do not offer proof of an isolated increase in ipsilateral PSC in the considered ROIs.
3.5. DCM model comparison results
To address hypothesis (4), we estimated the effective connectivity corresponding to commonalities between groups and to between‐group differences representing the effect of the disease (PD OFF vs. HC) and the effect of medication (PD OFF vs. PD ON), using DCM. We then conducted model (family) comparisons, in order to determine the architecture of group‐level effects in terms of task‐specific modulation. In the case of model family comparisons, we separately compared the laterality model families and the structure model families (see Figure 4 for the definition of model families). Figures 8 and 9 show the model family and model comparison results, respectively.
Figure 8.
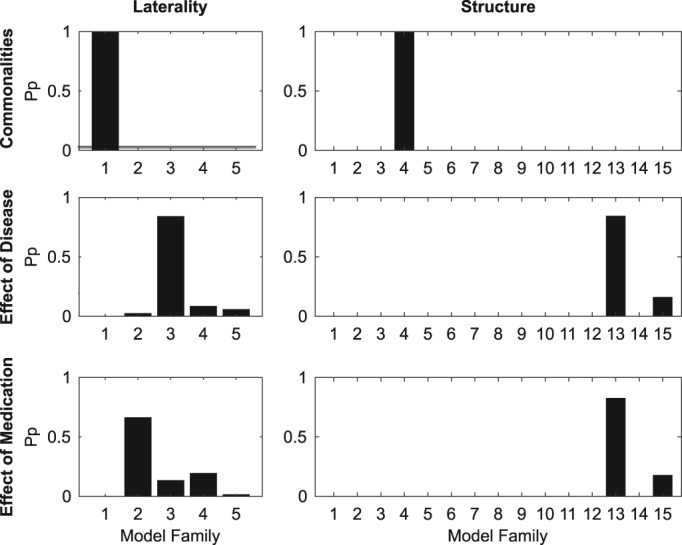
Results of Bayesian model family comparison for between‐group commonalities and differences. Left column of bar graphs: laterality model family, right column: structure model family. The y‐axis corresponds to the posterior probability, whereas the x‐axis corresponds to the model families within the given type of model family. Five laterality model families (1 — symmetrical, 2 — contralaterally‐lateralized, 3 — ipsilaterally‐lateralized, 4 — left‐lateralized, 5 — right‐lateralized) and 15 structure model families (see Figure 4) were compared
Figure 9.
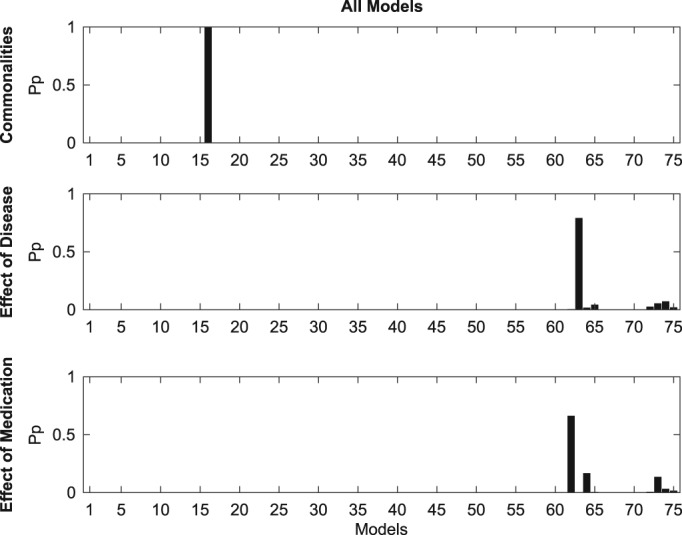
Results of Bayesian model comparison for between‐group commonalities and differences. The y‐axis corresponds to the posterior probability, whereas the x‐axis corresponds to the 75 models within the model space (see Figure 4)
For between‐group commonalities, the winning laterality model family was family 1 (Pp = 1), corresponding to a symmetrical network, while the winning structure model family was Family 4 (Pp = 1), corresponding to a network which includes interhemispheric, intrahemispheric and self‐inhibitory but not homotopic connections. Out of the 75 models in the full model space, model 16 was shown to best fit the data (Pp = 1). This model is at the intersection of the two model families — laterality and structure — which won the model family comparisons and corresponds to a symmetrical network made up of interhemispheric, intrahemispheric, and self‐inhibitory connections.
For the between‐group comparison corresponding to the effect of disease (PD OFF vs. HC), the winning laterality model family by far was Family 3 (Pp = 0.84), corresponding to an ipsilaterally‐lateralized network of connections. The winning structure model family was Family 13 (Pp = 0.84), corresponding to models containing only homotopic connections. The only other structure model family with a posterior probability above zero was Family 13 (Pp = 0.16), corresponding to models containing only self‐inhibitory connections. The overall winning model was Model 63 (Pp = 0.79), which was, again, at the intersection of the two winning model families. The model consists of an ipsilaterally‐lateralized network of homotopic connections.
The winning laterality model family for comparison corresponding to the effects of medication (PD OFF vs. PD ON) was Family 2 (Pp = 0.66), corresponding to a network of contralaterally‐lateralized connections. As in the PD OFF vs. HC comparison, the winning structure model family was Family 13 (Pp = 0.82). The overall winning model was Model 62 (Pp = 0.66), corresponding to a contralaterally‐lateralized network of homotopic connections.
In summary, between‐group commonalities were best described by a symmetrical network of connections which included interhemispheric, intrahemispheric and self‐inhibitory connectivity, that is, all connection types except for homotopic. The between‐group differences corresponding to both the effects of disease and of medication were characterized as networks of homotopic connections, albeit ipsilaterally‐lateralized in the case of the former and contralaterally‐lateralized in the case of the latter.
3.6. Effective connectivity results
We next characterized between‐group commonalities and differences in effective connectivity by conducting Bayesian model averaging — hypothesis‐free in the case of endogenous connectivity and task‐specific model input, and hypothesis‐driven in the case of task‐specific modulation (Figure 10). In order to aid with interpretation, we classified between‐group differences into the following categories: increased excitation, decreased excitation, increased inhibition, decreased inhibition (Figure 11).
Figure 10.
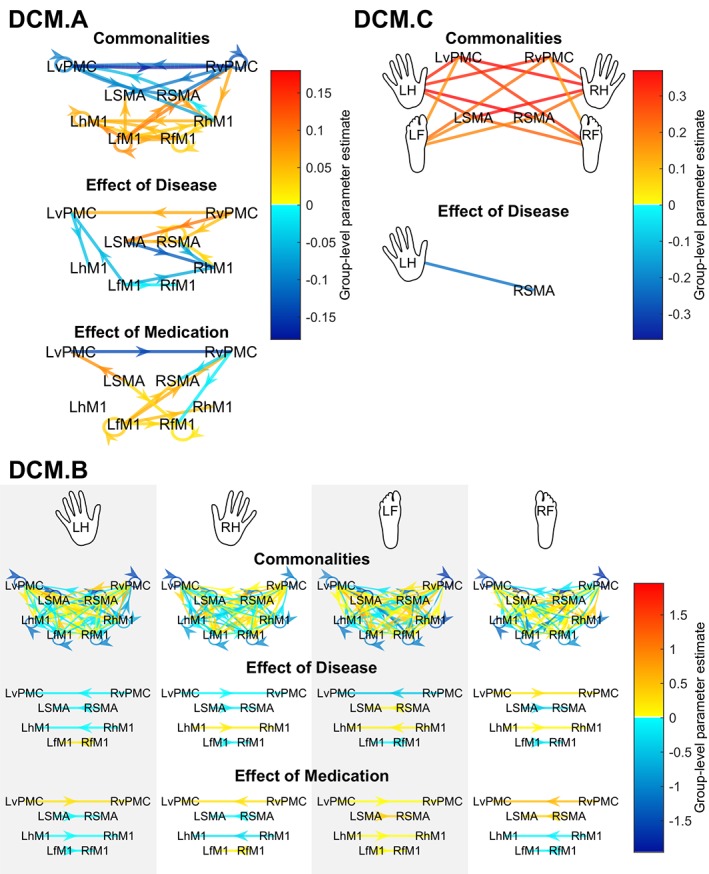
Between‐group commonalities and differences in effective connectivity patterns of the motor network, as estimated through Bayesian model averaging (BMA). Top left panel: Endogenous connectivity (DCM.A matrix). Top right panel: driving input (DCM.C matrix). Bottom panel: modulatory influences (DCM.B matrix). The color of the arrow colors designates the value of the group‐level parameter estimate, i.e., the contribution of the given effect (between‐group commonality or difference) to the variance of DCM connectivity strengths. Red arrows indicate positive group‐level parameter estimates, while blue arrows indicate negative group‐level parameter estimates. Only those connections with a posterior probability greater than 0.75 are shown. Arrows in the DCM.C panel have been omitted – all connections are unidirectional, from the hand/foot input toward the cortical node [Color figure can be viewed at http://wileyonlinelibrary.com]
Figure 11.
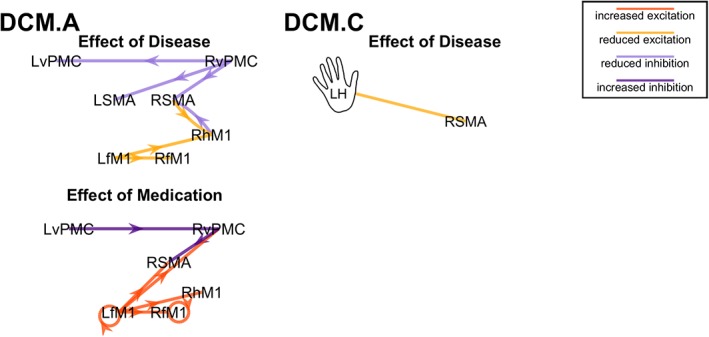
Characterization of between‐group differences in effective connectivity, as estimated through Bayesian model averaging (BMA). Left panel: Endogenous connectivity (DCM.A matrix). Right panel: driving input (DCM.C matrix). Arrows in the right panel (DCM.C) have been omitted – connections are unidirectional, from the hand/foot input toward the cortical node. Only those connections with a posterior probability – as estimated through BMA – greater than 0.75 are shown. Connections are characterized as “increased excitation” (dark orange), “reduced excitation” (light orange), “reduced inhibition” (light purple), “increased inhibition” (dark purple) [Color figure can be viewed at http://wileyonlinelibrary.com]
3.6.1. Endogenous connectivity
Endogenous connectivity, as estimated in the DCM.A matrix, refers to coupling that remains constant throughout the experimental time course regardless of the experimental condition. In terms of between‐group commonalities, the DCM.A matrix revealed a largely symmetrical network of connections, with excitatory connectivity between the primary motor areas and inhibitory connectivity between premotor and supplementary motor areas (Figure 10, top left panel).
The between‐group comparison corresponding to effect of disease revealed negative connections mostly targeting regions in the right hemisphere and positive connections originating, for the most part, in the right hemisphere. However, positive and negative connections (i.e., parameter estimates) should be interpreted in terms of increased excitation versus decreased inhibition and decreased excitation versus increased inhibition, respectively. Thus, interpreting the effect of disease in view of between‐group commonalities, differences could be classified as reduced inhibition — particularly for connections originating in the RvPMC — or decreased excitation — for connections targeting Rh/fM1 (Figure 11, left panel).
The between‐group comparison corresponding to effect of medication revealed a network of mostly positive connections. The network was mostly symmetrical, with the exception of the few negative connections, which targeted the right hemisphere. Our characterization analysis showed that the between‐group differences could be classified as either reduced inhibition or reduced excitation, with the former observed in premotor areas and the latter observed mainly in primary motor areas.
3.6.2. Task‐specific model input
We defined the premotor regions (bilateral SMA and vPMC) to be the input nodes, that is, the sites at which the motor task impact enters the network, estimated as the DCM.C matrix (Figure 10, top right panel). In terms of between‐group commonalities, all parameter estimates were significantly (Pp > 0.75) different from zero. All connections were positive.
The group‐level comparison corresponding to the effect of disease showed a negative parameter estimate from the most affected (left) hand to the RSMA, corresponding to reduced excitation (Figure 11, left panel). This finding makes sense given that the left hand was most affected by the disease and the cortical output of the basal ganglia is known to be reduced in PD (Blesa et al., 2011). The group‐level comparison corresponding to the effect of medication did not show any significant differences (even at Pp > 0.5).
3.6.3. Task‐specific modulation
The DCM.B matrix models the input‐dependent modulation of connectivity — in this case, the specific changes in neural coupling induced by right/left hand/foot movements (Figure 10, bottom panel). The between‐group commonalities could be modeled by a network which was symmetrical and almost fully connected, containing interhemispheric, intrahemispheric, and self‐inhibitory connections. Generally, the M1 contralateral to the given movement condition (e.g., LhM1 for right hand movement) was the target of positive connections from all or almost all secondary motor regions and was the source of mostly inhibitory connections to other regions. There were also positive connections targeting the M1 ipsilateral to the limb being moved, though they were not as numerous as those targeting the contralateral M1.
The effects of disease and medication could be modeled by networks of ipsilaterally‐ and contralaterally‐lateralized homotopic connections, respectively. Since the parameters of the BMA corresponding to between‐group commonalities did not contain significant homotopic connections, it was not possible to interpret the sign of the parameters in terms of increased/reduced excitation/inhibition. Thus, we interpret the findings solely based on whether parameter estimates were positive or negative.
In the case of the effect of disease, the connections between the relevant contralateral and ipsilateral M1s were negative in the case of all conditions except right hand movement, in which case the parameter estimate was positive. By “relevant” M1, we mean hM1 in the case of the hand movement condition and fM1 in the case of the foot movement condition. The connections from contra‐ to ipsilateral secondary motor regions were all negative in the case of the two hand movement conditions, whereas in the foot movement conditions, one of the parameter estimates — RSMA ➔ LSMA in the case of left foot movement and LvPMC ➔ RvPMC in the case of right foot movement — was positive. In summary, 9 out of 12 relevant homotopic connections (i.e., excluding connections between fM1's in the case of hand movement conditions and hM1's in the case of foot movements) were negative.
In the case of the effect of medication, the connections between the relevant contralateral and ipsilateral M1s were negative in the case of all conditions except right foot movement. The connection from ipsi‐ to contralateral vPMC was positive in the case of all four‐movement conditions. Meanwhile, the connection from ipsi‐ to contralateral SMA was negative in the hand movement conditions and positive in the foot movement conditions. In summary, 5 out of 12 relevant homotopic connections were negative.
4. DISCUSSION
We demonstrate that motor activation lateralization is decreased in non‐drug‐naïve PD and that “normal” laterality is not reinstated after dopamine substitution. Our analysis of contra‐ and ipsilateral activations shows that laterality decrease is the result of various hypo‐/hyperactivation scenarios across our regions of interest. Notably, the finding of decreased lateralization cannot be explained by increased ipsilateral activation alone. Decreased lateralization is rather concurrent with decreased contralateral activation.
In terms of cortical motor network dynamics, we found widespread disease‐ and medication‐related changes in endogenous connectivity (DCM.A matrix). Contrary to what would be expected given the compensatory mechanism of reduced inhibition ‐ increased facilitation previously identified in early PD (Rothwell & Edwards, 2013), we observed a disease‐related attenuation of both excitatory and inhibitory connectivity. However, medication‐related changes could be characterized as increased excitation and inhibition. Task‐specific model input (DCM.C) only showed a limited effect of disease, with a decrease in left hand input to RSMA. Model selection revealed that both disease‐ and medication‐related differences in movement‐specific modulation (DCM.B) are best captured by a network of homotopic connections — ipsilaterally‐lateralized in the case of disease effects and contralaterally‐lateralized in the case of medication effects.
4.1. Decreased laterality in non‐drug‐naïve PD
While PD begins with an asymmetric loss of dopaminergic nigrostriatal neurons leading to a progressive depletion of dopamine in the basal ganglia, secondary alterations in the basal ganglia‐cerebello‐thalamo‐cortical circuit act to stave off behavioral changes (Blesa et al., 2017). More specifically, it has been suggested that compensatory recruitment of homologous motor areas, as manifested by ipsilateral hyperactivation, contributes to a decrease in motor lateralization in drug‐naïve PD (Wu et al., 2015). Here, we demonstrate that this decrease in lateralization persists in non‐drug‐naïve PD, in accordance with hypothesis (1). However, our findings run counter to hypothesis (2), as dopamine substitution does not reinstate laterality to normal levels.
Moreover, our findings run counter to hypothesis (3), according to which laterality decrease is primarily the result of a compensatory ipsilateral hyperactivation. Rather, significant between‐group differences in activation can be explained primarily through decreases in contralateral activation. As we did not observe any significant increase in ipsilateral activation, this phenomenon could not explain the finding of decreased lateralization in our cohort. Instead, decreased laterality rather corresponds to an isolated decrease in contralateral activation.
Some caution is advised when linking the AveLI and PSC results, as we considered only cortical ROIs in the PSC analysis, whereas AveLI was computed across the whole brain. The observed decrease in laterality may rather be driven by sub‐cortical regions, particularly the basal ganglia or the cerebellum. Nevertheless, we offer proof of PD‐related alterations in primarily contralateral activation across multiple cortical regions. Our findings suggest that, in later stages of the disease, laterality decrease is no longer associated solely with compensatory ipsilateral hyperactivation as in drug‐naïve PD (Blesa et al., 2011; Wu et al., 2015). Instead, we observed contralateral hypoactivation, which suggests the appearance of maladaptive processes, related to chronic medication usage and/or to the spread of pathology throughout the motor circuit.
We further investigated motor activation lateralization in non‐drug‐naïve PD by analyzing the underlying neural connectivity changes (ad hypothesis [4]). Using dynamic causal modeling, we estimated effective connectivity within the cortical motor network and applied the novel PEB approach to identify between‐group differences corresponding to effects of disease and effects of medication. Model (family) comparisons for between‐group commonalities and for each of the between‐group comparisons revealed that disease‐related differences (modeled by the PD OFF vs. HC comparison) in movement‐specific modulation are best captured by a network of ipsilaterally‐lateralized homotopic connections. Meanwhile, medication‐related differences (modeled by the PD OFF vs. PD ON comparison) were found to be best characterized as contralaterally‐lateralized homotopic connections. Thus, as in the activation lateralization analysis, we did not find evidence for a restorative effect of levodopa on cortical motor network connectivity. Were the medication‐related changes to directly counteract disease‐related changes at the cortical level, we posit that they should be described by the same model structure but with an inverse sign of connections.
4.2. Disease‐ and medication‐related changes in endogenous connectivity
We observed widespread differences in endogenous connectivity, not only between the PD OFF and HC groups, corresponding to effects of disease, but also between the PD OFF and PD ON groups, corresponding to effects of medication. Disease‐related connectivity changes could be characterized as either reduced inhibition or reduced facilitation. While the former is compatible with the previously described potential cortical compensatory mechanism of reduced inhibition ‐ increased facilitation in early PD (Rothwell & Edwards, 2013), the latter finding seems rather to suggest maladaptive change resulting from disease progression and/or chronic levodopa administration. Meanwhile, medication‐related connectivity changes could be characterized as either increased excitation or increased inhibition. Again, the former is compatible with the aforementioned compensatory mechanism, while the latter is potentially a side‐effect of medication.
It is worth noting that our findings on between‐group commonalities in endogenous connectivity diverge from previous findings, which consisted of a network of excitatory connections among cortical motor areas apart from intra‐ and interhemispheric inhibitory influences between hand and foot M1s (Volz et al., 2015). We observed a mostly excitatory network, except for premotor connections originating from or targeting the vPMC. This divergence may be explained by the difference in age range between the two cohorts — 26 ± 4 years (Volz et al., 2015) versus 59.28 ± 8.46 years in our study. Indeed, an age‐related reduction in cortical excitability has previously been reported (Bhandari et al., 2016), as have age‐related changes in the effective connectivity within the motor system (Loehrer et al., 2016).
4.3. Abnormal homotopic connectivity disrupts motor network laterality
Given our findings of decreased laterality concurrent with disruptions in homotopic connectivity, we posit that there may generally be a causal relationship between these two phenomena. Wu et al. came to a similar conclusion in their study of drug‐naïve PD, in which they proposed that the recruitment of homologous motor areas leads to a disruption in the nonmirror transformation network which mediates unilateral movement, and that this disruption manifests itself as abnormal motor lateralization (Wu et al., 2015). In the case of drug‐naïve PD, the authors reported strengthened (positive) functional connectivity among homologous motor areas, interpreted as a compensatory mechanism. To the contrary, in our finding of disease‐related ipsilaterally‐lateralized homotopic connectivity, most parameter estimates were negative. While the lack of homotopic connections in the between‐group commonalities model makes it impossible to characterize these findings in terms of reduced facilitation versus increased inhibition, in either case this finding runs counter to that of strengthened connectivity in drug‐naïve PD. This, in turn, lends credence to our argument concerning disease‐related maladaptation in non‐drug‐naïve PD.
The acute variation in connectivity related to the administration of levodopa — modeled by the PD OFF versus PD ON comparison, is best captured by a contralaterally‐lateralized network of homotopic connections. We interpret these findings in light of the levodopa effect on beta oscillations that reduce movement‐related beta burst probability, amplitude and desynchronization to improve motor control in PD (Tinkhauser et al., 2017).
4.4. Limitations
One of the key limitations of our study is the relatively small sample size, particularly in the clinical cohort. Our priority was ensuring homogeneity of the sample, hence our strict inclusion criteria: right‐handedness for all participants, left side onset and left side dominance of PD symptoms. We insisted on these inclusion criteria because hand dominance is known to cause significant intersubject variability, in terms of anatomy, motor‐related neural activations and effective connectivity (Amunts et al., 1996; Joliot et al., 2016; Pool et al., 2014; Tzourio‐Mazoyer et al., 2015). Moreover, it has been suggested that there may be a correlation between handedness and side of PD symptom onset, as well as between handedness and persisting dominant symptom side of PD (Barrett, Wylie, Harrison, & Wooten, 2011; van der Hoorn, Burger, Leenders, & de Jong, 2012; Yust‐Katz, Tesler, Treves, Melamed, & Djaldetti, 2008). Nevertheless, some disease‐ and medication‐related heterogeneity in our sample was unavoidable — notably, there was considerable interpatient variability in terms of disease duration and medication type.
Another unavoidable limitation to our study was the missing level in the factorial design, that is, healthy participants “ON” medication. This makes it impossible to unequivocally interpret between‐group differences in terms of main effects of disease, main effects of medication or disease × medication interactions. A related issue is that the PD patients in our cohort had already been receiving pharmacological treatment for at least several years, leading to a significant confounding factor of long‐term dopamine administration. Thus, the between‐group differences we see in the PD versus HC comparisons cannot be interpreted simply as “effects of disease/medication status,” but rather as “effects of disease/medication status in interaction with effects of long‐term dopamine administration.”
A final methodological issue worth noting is the limitation of our motor network model to cortical regions. Several factors motivated our choice, not least among them the computational load associated with estimating large DCMs (with more than eight nodes; Seghier & Friston, 2013). Another factor contributing to our decision was the low fMRI SNR in the basal ganglia, which would have otherwise been an interesting site to include due to their status as the primary locus of PD. It may be possible to circumvent these issues with new developments in DCM (van Wijk, Cagnan, Litvak, Kühn, & Friston, 2018).
Our study offers an account of effective connectivity in PD which is complementary to previous studies (Michely et al., 2015; Rowe, Hughes, Barker, & Owen, 2010; van Wijk et al., 2018), all of which investigated only unilateral neural network dynamics, usually between a subset of our motor ROIs and regions in the prefrontal cortex and/or basal ganglia. In general, existing studies of effective connectivity in PD vary substantially in terms of the regions included in the analysis, specific inclusion criteria, imaging modality, choice of movement task, and so on, making it difficult to contextualize our results within previous findings. A recent EEG study on PD patients “ON” and “OFF” medication considered a bilateral network which included the prefrontal cortex, lateral premotor cortex, SMA, and M1 (Nettersheim et al., 2018). While this study is most directly comparable to ours, it is nevertheless difficult to relate our results to theirs, primarily because the motor task they employed was more complex and was meant to elicit between‐group differences.
5. CONCLUSIONS
Our results indicate that in non‐drug‐naïve PD, lateralization decrease is not the result of adaptive compensation, but rather that disease progression and/or long‐term dopamine replacement contribute to the appearance of maladaptive changes. We postulate that the maladaptive mechanism best corresponding to the laterality changes observed in non‐drug‐naïve PD is diaschisis — functional depression of neural activity in regions located remotely, though within the same circuit as, the original focal region (Fornito, Zalesky, & Breakspear, 2015). Thus, we propose that the compensatory adaptation, which characterizes the preclinical phase of PD develops into or is overtaken by maladaptive mechanisms related to disease progression, long‐term dopamine replacement and/or to interactions between the two.
In conclusion, this in‐depth investigation of motor laterality changes in non‐drug‐naïve PD gives us a better understanding of the way in which neuroplastic mechanisms are mobilized in later stages of the disease and in response to dopamine substitution. We shed light on the relation between motor lateralization and DA imbalance — a phenomenon implicated not only in PD but in a wide array of neurodegenerative, neurodevelopmental and neuropsychiatric disorders, including Tourette syndrome (Avanzino et al., 2011), Huntington's disease (Chen, Wang, Cepeda, & Levine, 2013), schizophrenia (Gruzelier, 1999; Hietala et al., 1999) and depression (Hsiao, Lin, Liu, & Schatz, 2013). Our findings elucidate the role of cortical mechanisms in the compensation for DA imbalances and (mal)adaptive plastic changes in response to disease progression and dopamine substitution. Given also the proposed reciprocity between motor behavior and interhemispheric imbalance in the DA system (Molochnikov & Cohen, 2014), we foresee a promising future for the development of noninvasive therapies — such as physio‐ or occupational therapy — for the treatment of disease‐related DA imbalance.
Supporting information
Data S1: Supporting Information
ACKNOWLEDGMENTS
The authors would like to thank the participants for their beneficial contribution to the study. The authors thank Drs. François Vingerhoets, Deepa Pothalil, Elisabeth Roggenhofer, and Christian Wider for their help with clinical evaluations.
Jastrzębowska MA, Marquis R, Melie‐García L, et al. Dopaminergic modulation of motor network compensatory mechanisms in Parkinson's disease. Hum Brain Mapp. 2019;40:4397–4416. 10.1002/hbm.24710
Funding information Fondation Leenaards; Fondation ROGER DE SPOELBERCH; H2020 Future and Emerging Technologies, Grant/Award Number: 720270; Partridge Foundation; Schweizerischer Nationalfonds zur Förderung der Wissenschaftlichen Forschung, Grant/Award Numbers: 32003B_135679, 32003B_159780, NCCR‐Synapsy 125759, NCCR‐Synapsy 565593
Contributor Information
Maya A. Jastrzębowska, Email: maya.jastrzebowska@epfl.ch.
Bogdan Draganski, Email: bogdan.draganski@chuv.ch.
DATA AVAILABILITY
The data that support the findings of this study are available on request from the corresponding author. The data are not publicly available due to privacy or ethical restrictions.
REFERENCES
- Amunts, K. , Schlaug, G. , Schleicher, A. , Steinmetz, H. , Dabringhaus, A. , Roland, P. E. , & Zilles, K. (1996). Asymmetry in the human motor cortex and handedness. NeuroImage, 4, 216–222. 10.1006/nimg.1996.0073 [DOI] [PubMed] [Google Scholar]
- Ashburner, J. (2007). A fast diffeomorphic image registration algorithm. NeuroImage, 38, 95–113. 10.1016/j.neuroimage.2007.07.007 [DOI] [PubMed] [Google Scholar]
- Avanzino, L. , Martino, D. , Bove, M. , De Grandis, E. , Tacchino, A. , Pelosin, E. , … Abbruzzese, G. (2011). Movement lateralization and bimanual coordination in children with Tourette syndrome. Movement Disorders, 26, 2114–2118. 10.1002/mds.23839 [DOI] [PubMed] [Google Scholar]
- Barrett, M. J. , Wylie, S. A. , Harrison, M. B. , & Wooten, G. F. (2011). Handedness and motor symptom asymmetry in Parkinson's disease. Journal of Neurology, Neurosurgery, and Psychiatry, 82, 1122–1124. 10.1136/jnnp.2010.209783 [DOI] [PMC free article] [PubMed] [Google Scholar]
- Bates, D. , Maechler, M. , Bolker, B. , & Walker, S. (2015). Fitting linear mixed‐effects models using lme4. Journal of Statistical Software, 67, 1–48. 10.18637/jss.v067.i01 [DOI] [Google Scholar]
- Bhandari, A. , Radhu, N. , Farzan, F. , Mulsant, B. H. , Rajji, T. K. , Daskalakis, Z. J. , & Blumberger, D. M. (2016). A meta‐analysis of the effects of aging on motor cortex neurophysiology assessed by Transcranial magnetic stimulation. Clinical Neurophysiology, 127, 2834–2845. 10.1016/j.clinph.2016.05.363.A [DOI] [PMC free article] [PubMed] [Google Scholar]
- Blesa, J. , Juri, C. , Garcia‐Cabezas, M. Á. , Adanez, R. , Sánchez‐González, M. Á. , Cavada, C. , & Obeso, J. A. (2011). Inter‐hemispheric asymmetry of nigrostriatal dopaminergic lesion: A possible compensatory mechanism in Parkinson's disease. Frontiers in Systems Neuroscience, 5, 1–7. 10.3389/fnsys.2011.00092 [DOI] [PMC free article] [PubMed] [Google Scholar]
- Blesa, J. , Trigo‐Damas, I. , Dileone, M. , del Rey, N. L. G. , Hernandez, L. F. , & Obeso, J. A. (2017). Compensatory mechanisms in Parkinson's disease: Circuits adaptations and role in disease modification. Experimental Neurology, 298, 148–161. 10.1016/j.expneurol.2017.10.002 [DOI] [PubMed] [Google Scholar]
- Brett, M. , Anton, J. L. , Valabregue, R. , & Poline, J. B. (2002). Region of interest analysis using an SPM toolbox [abstract]. Presented at the 8th International Conference on Functional Mapping of the Human Brain, Sendai, Japan Available on CD‐ROM in NeuroImage, Vol. 16, No 2, abstract 497. 10.1016/S1053-8119(02)90013-3 [DOI]
- Buetefisch, C. M. , Revill, K. P. , Shuster, L. , Hines, B. , & Parsons, M. (2014). Motor demand‐dependent activation of ipsilateral motor cortex. Journal of Neurophysiology, 112, 999–1009. 10.1152/jn.00110.2014 [DOI] [PMC free article] [PubMed] [Google Scholar]
- Carr, L. J. , Harrison, L. M. , Evans, A. L. , & Stephens, J. A. (1993). Patterns of central motor reorganization in hemiplegic cerebral palsy. Brain, 116, 1223–1247. 10.1093/brain/116.5.1223 [DOI] [PubMed] [Google Scholar]
- Chen, J. Y. , Wang, E. A. , Cepeda, C. , & Levine, M. S. (2013). Dopamine imbalance in Huntington's disease: A mechanism for the lack of behavioral flexibility. Frontiers in Neuroscience, 7, 1–14. 10.3389/fnins.2013.00114 [DOI] [PMC free article] [PubMed] [Google Scholar]
- Dai, T. H. , Liu, J. Z. , Saghal, V. , Brown, R. W. , & Yue, G. H. (2001). Relationship between muscle output and functional MRI‐measured brain activation. Experimental Brain Research, 140, 290–300. 10.1007/s002210100815 [DOI] [PubMed] [Google Scholar]
- Dassonville, P. , Zhu, X. H. , Uurbil, K. , Kim, S. G. , & Ashe, J. (1997). Functional activation in motor cortex reflects the direction and the degree of handedness. Proceedings of the National Academy of Sciences of the United States of America, 94, 14015–14018. 10.1073/pnas.94.25.14015 [DOI] [PMC free article] [PubMed] [Google Scholar]
- de la Fuente‐Fernández, R. , Kishore, A. , Calne, D. B. , Ruth, T. J. , & Stoessl, A. J. (2000). Nigrostriatal dopamine system and motor lateralization. Behavioural Brain Research, 112, 63–68. 10.1016/S0166-4328(00)00165-0 [DOI] [PubMed] [Google Scholar]
- Fearnley, J. M. , & Lees, A. J. (1991). Ageing and Parkinson's disease: Substantia Nigra regional selectivity. Brain, 114, 2283–2301. 10.1093/brain/114.5.2283 [DOI] [PubMed] [Google Scholar]
- Fornito, A. , Zalesky, A. , & Breakspear, M. (2015). The connectomics of brain disorders. [review]. Nature Reviews Neuroscience, 16, 159–172. 10.1038/nrn3901 [DOI] [PubMed] [Google Scholar]
- Friston, K. J. (2004). Dynamic causal modelling In Frackowiak R. S. J., Friston K. J., Frith C. D., Dolan R. J., Price C. J., Zeki S., et al. (Eds.), Human brain function (2nd ed., pp. 1273–1302). San Diego, CA: Elsevier Science (USA) 10.1016/B978-012264841-0/50054-8 [DOI] [Google Scholar]
- Friston, K. J. , Harrison, L. , & Penny, W. (2003). Dynamic causal modelling. NeuroImage, 19, 1273–1302. 10.1016/S1053-8119(03)00202-7 [DOI] [PubMed] [Google Scholar]
- Friston, K. J. , Litvak, V. , Oswal, A. , Razi, A. , Stephan, K. E. , van Wijk, B. C. M. , … Zeidman, P. (2015). Bayesian model reduction and empirical Bayes for group (DCM) studies. NeuroImage, 128, 413–431. 10.1016/j.neuroimage.2015.11.015 [DOI] [PMC free article] [PubMed] [Google Scholar]
- Friston, K. J. , Zeidman, P. , & Litvak, V. (2015). Empirical Bayes for DCM: A group inversion scheme. Frontiers in Systems Neuroscience, 9, 164 10.3389/fnsys.2015.00164 [DOI] [PMC free article] [PubMed] [Google Scholar]
- Grefkes, C. , Eickhoff, S. B. , Nowak, D. A. , Dafotakis, M. , & Fink, G. R. (2008). Dynamic intra‐ and interhemispheric interactions during unilateral and bilateral hand movements assessed with fMRI and DCM. NeuroImage, 41, 1382–1394. 10.1016/j.neuroimage.2008.03.048 [DOI] [PubMed] [Google Scholar]
- Gruzelier, J. H. (1999). Functional neuropsychophysiological asymmetry in schizophrenia: A review and reorientation. Schizophrenia Bulletin, 25, 91–120. [DOI] [PubMed] [Google Scholar]
- Guzzetta, A. , Bonanni, P. , Biagi, L. , Tosetti, M. , Montanaro, D. , Guerrini, R. , & Cioni, G. (2007). Reorganisation of the somatosensory system after early brain damage. Clinical Neurophysiology, 118, 1110–1121. 10.1016/j.clinph.2007.02.014 [DOI] [PubMed] [Google Scholar]
- Heim, S. , Eickhoff, S. B. , Ischebeck, A. K. , Friederici, A. D. , Stephan, K. E. , & Amunts, K. (2009). Effective connectivity of the left BA 44, BA 45, and inferior temporal gyrus during lexical and phonological decisions identified with DCM. Human Brain Mapping, 30, 392–402. 10.1002/hbm.20512 [DOI] [PMC free article] [PubMed] [Google Scholar]
- Helms, G. , Dathe, H. , & Dechent, P. (2008). Quantitative FLASH MRI at 3 T using a rational approximation of the Ernst equation. Magnetic Resonance in Medicine, 59, 667–672. 10.1002/mrm.21542 [DOI] [PubMed] [Google Scholar]
- Helms, G. , Dathe, H. , Kallenberg, K. , & Dechent, P. (2008). High‐resolution maps of magnetization transfer with inherent correction for RF inhomogeneity and T1 relaxation obtained from 3D FLASH MRI. Magnetic Resonance in Medicine, 60, 1396–1407. 10.1002/mrm.21732 [DOI] [PubMed] [Google Scholar]
- Hietala, J. , Syvälahti, E. , Vilkman, H. , Vuorio, K. , Räkköläinen, V. , Bergman, J. , … Salokangas, R. K. (1999). Depressive symptoms and presynaptic dopamine function in neuroleptic‐naive schizophrenia. Schizophrenia Research, 35, 41–50. 10.1016/S0920-9964(98)00113-3 [DOI] [PubMed] [Google Scholar]
- Hsiao, M. C. , Lin, K. J. , Liu, C. Y. , & Schatz, D. B. (2013). The interaction between dopamine transporter function, gender differences, and possible laterality in depression. Psychiatry Research, 211, 72–77. 10.1016/j.pscychresns.2012.06.004 [DOI] [PubMed] [Google Scholar]
- Joliot, M. , Tzourio‐Mazoyer, N. , & Mazoyer, B. (2016). Intra‐hemispheric intrinsic connectivity asymmetry and its relationships with handedness and language Lateralization. Neuropsychologia, 93, 437–447. 10.1016/j.neuropsychologia.2016.03.013 [DOI] [PubMed] [Google Scholar]
- Kim, S. , Ashe, J. J. , Hendrich, K. M. , Ellermann, J. , Merkle, H. , Ugurbil, K. , & Georgopoulos, A. P. (1993). Functional magnetic resonance imaging of motor cortex: Hemispheric asymmetry and handedness. Science, 261, 615–617. [DOI] [PubMed] [Google Scholar]
- Kobayashi, M. , Hutchinson, S. , & Schlaug, G. (2003). Ipsilateral motor cortex activation on functional magnetic resonance imaging during unilateral hand movements is related to interhemispheric interactions. NeuroImage, 20, 2259–2270. 10.1016/S1053-8119(03)00220-9 [DOI] [PubMed] [Google Scholar]
- Kuznetsova, A. , Brockhoff, P. B. , & Christensen, R. H. B. (2017). lmerTest package: Tests in linear mixed effects models. Journal of Statistical Software, 82, 1–26. 10.18637/jss.v082.i13 [DOI] [Google Scholar]
- Litvak, V. , Garrido, M. , Zeidman, P. , & Friston, K. (2015). Empirical Bayes for group (DCM) studies: A reproducibility study. Frontiers in Human Neuroscience, 9, 1–12. 10.3389/fnhum.2015.00670 [DOI] [PMC free article] [PubMed] [Google Scholar]
- Loehrer, P. A. , Nettersheim, F. S. , Jung, F. , Weber, I. , Huber, C. , Dembek, T. A. , … Timmermann, L. (2016). Ageing changes effective connectivity of motor networks during bimanual finger coordination. NeuroImage, 143, 325–342. 10.1016/j.neuroimage.2016.09.014 [DOI] [PubMed] [Google Scholar]
- Lutti, A. , Dick, F. , Sereno, M. I. , & Weiskopf, N. (2014). Using high‐resolution quantitative mapping of R1 as an index of cortical myelination. NeuroImage, 93, 176–188. 10.1016/j.neuroimage.2013.06.005 [DOI] [PubMed] [Google Scholar]
- Lutti, A. , Thomas, D. L. , Hutton, C. , & Weiskopf, N. (2013). High‐resolution functional MRI at 3 T: 3D/2D echo‐planar imaging with optimized physiological noise correction. Magnetic Resonance in Medicine, 69, 1657–1664. 10.1002/mrm.24398 [DOI] [PMC free article] [PubMed] [Google Scholar]
- Matsuo, K. , Chen, S. H. A. , & Tseng, W. Y. I. (2012). AveLI: A robust lateralization index in functional magnetic resonance imaging using unbiased threshold‐free computation. Journal of Neuroscience Methods, 205, 119–129. 10.1016/j.jneumeth.2011.12.020 [DOI] [PubMed] [Google Scholar]
- Michely, J. , Volz, L. J. , Barbe, M. T. , Hoffstaedter, F. , Viswanathan, S. , Timmermann, L. , … Grefkes, C. (2015). Dopaminergic modulation of motor network dynamics in Parkinson's disease. Brain, 138, 664–678. 10.1093/brain/awu381 [DOI] [PMC free article] [PubMed] [Google Scholar]
- Molochnikov, I. , & Cohen, D. (2014). Hemispheric differences in the mesostriatal dopaminergic system. Frontiers in Systems Neuroscience, 8, 1–14. 10.3389/fnsys.2014.00110 [DOI] [PMC free article] [PubMed] [Google Scholar]
- Naccarato, M. , Calautti, C. , Jones, P. S. , Day, D. J. , Carpenter, T. A. , & Baron, J. C. (2006). Does healthy aging affect the hemispheric activation balance during paced index‐to‐thumb opposition task? An fMRI study. NeuroImage, 32, 1250–1256. 10.1016/j.neuroimage.2006.05.003 [DOI] [PubMed] [Google Scholar]
- Nettersheim, F. S. , Loehrer, P. A. , Weber, I. , Dembek, T. A. , Pelzer, E. A. , Dafsari, H. S. , … Timmermann, L. (2018). Dopamine substitution alters effective connectivity of cortical prefrontal, premotor, and motor regions during complex bimanual finger movements in Parkinson's disease. NeuroImage, 190, 118–132. 10.1016/j.neuroimage.2018.04.030 [DOI] [PubMed] [Google Scholar]
- Ni, Z. , Bahl, N. , Gunraj, C. A. , Mazzella, F. , & Chen, R. (2013). Increased motor cortical facilitation and decreased inhibition in Parkinson disease. Neurology, 80, 1746–1753. 10.1212/WNL.0b013e3182919029 [DOI] [PMC free article] [PubMed] [Google Scholar]
- Nieto‐Castañón, A. , & Fedorenko, E. (2013). Subject‐specific functional localizers increase sensitivity and functional resolution of multi‐subject analyses. NeuroImage, 63, 1646–1669. 10.1016/j.neuroimage.2012.06.065 [DOI] [PMC free article] [PubMed] [Google Scholar]
- Oldfield, R. C. (1971). The assessment and analysis of handedness: The Edinburgh inventory. Neuropsychologia, 9, 97–113. 10.1016/0028-3932(71)90067-4 [DOI] [PubMed] [Google Scholar]
- Omrani, M. , Kaufman, M. T. , Hatsopoulos, N. G. , & Cheney, P. D. (2017). Perspectives on classical controversies about the motor cortex. Journal of Neurophysiology, 118, 1828–1848. 10.1152/jn.00795.2016 [DOI] [PMC free article] [PubMed] [Google Scholar]
- Pool, E. M. , Rehme, A. K. , Fink, G. R. , Eickhoff, S. B. , & Grefkes, C. (2013). Network dynamics engaged in the modulation of motor behavior in healthy subjects. NeuroImage, 82, 68–76. 10.1002/hbm.23872 [DOI] [PubMed] [Google Scholar]
- Pool, E. M. , Rehme, A. K. , Fink, G. R. , Eickhoff, S. B. , & Grefkes, C. (2014). Handedness and effective connectivity of the motor system. NeuroImage, 99, 451–460. 10.1016/j.neuroimage.2014.05.048 [DOI] [PMC free article] [PubMed] [Google Scholar]
- R Core Team (2018). R: A language and environment for statistical computing Vienna, Austria: R Foundation for Statistical Computing. Retrieved from https://www.r-project.org/.
- Rehme, A. K. , Fink, G. R. , Von Cramon, D. Y. , & Grefkes, C. (2011). The role of the contralesional motor cortex for motor recovery in the early days after stroke assessed with longitudinal fMRI. Cerebral Cortex, 21, 756–768. 10.1093/cercor/bhq140 [DOI] [PubMed] [Google Scholar]
- Rothwell, J. C. , & Edwards, M. J. (2013). Parkinson's disease In Lozano A. M. & Hallett M. (Eds.), Handbook of clinical neurology Brain Stimulation (Vol. 116, pp. 535–542). Amsterdam: Elsevier B.V; 10.1016/B978-0-444-53497-2.00042-5 [DOI] [PubMed] [Google Scholar]
- Rowe, J. B. , Hughes, L. E. , Barker, R. A. , & Owen, A. M. (2010). Dynamic causal modelling of effective connectivity from fMRI: Are results reproducible and sensitive to Parkinson's disease and its treatment? NeuroImage, 52, 1015–1026. 10.1016/j.neuroimage.2009.12.080 [DOI] [PMC free article] [PubMed] [Google Scholar]
- RStudio (2012). RStudio: Integrated development environment for R (version 0.96.122).
- Samii, A. , Nutt, J. G. , & Ransom, B. R. (2004). Parkinson's disease. Lancet, 363, 1783–1793. 10.1016/S0140-6736(04)16305-8 [DOI] [PubMed] [Google Scholar]
- Seghier, M. L. (2008). Laterality index in functional MRI: Methodological issues. Magnetic Resonance Imaging, 26, 594–601. 10.1016/j.mri.2007.10.010 [DOI] [PMC free article] [PubMed] [Google Scholar]
- Seghier, M. L. , & Friston, K. J. (2013). Network discovery with large DCMs. NeuroImage, 68, 181–191. 10.1016/j.neuroimage.2012.12.005 [DOI] [PMC free article] [PubMed] [Google Scholar]
- Shimizu, T. , Hosaki, A. , Hino, T. , Sato, M. , Komori, T. , Hirai, S. , & Rossini, P. M. (2002). Motor cortical disinhibition in the unaffected hemisphere after unilateral cortical stroke. Brain, 125, 1896–1907. 10.1093/brain/awf183 [DOI] [PubMed] [Google Scholar]
- Tinkhauser, G. , Pogosyan, A. , Tan, H. , Herz, D. M. , Kühn, A. A. , & Brown, P. (2017). Beta burst dynamics in Parkinson's disease OFF and ON dopaminergic medication. Brain, 140, 2968–2981. 10.1093/brain/awx252 [DOI] [PMC free article] [PubMed] [Google Scholar]
- Tomlinson, C. L. , Stowe, R. , Patel, S. , Rick, C. , Gray, R. , & Clarke, C. E. (2010). Systematic review of levodopa dose equivalency reporting in Parkinson's disease. [review]. Movement Disorders, 25, 2649–2653. 10.1002/mds.23429 [DOI] [PubMed] [Google Scholar]
- Tzourio‐Mazoyer, N. , Petit, L. , Zago, L. , Crivello, F. , Vinuesa, N. , Joliot, M. , … Mazoyer, B. (2015). Between‐hand difference in ipsilateral deactivation is associated with hand lateralization: fMRI mapping of 284 volunteers balanced for handedness. Frontiers in Human Neuroscience, 9(5), 1–12. 10.3389/fnhum.2015.00005 [DOI] [PMC free article] [PubMed] [Google Scholar]
- van der Hoorn, A. , Burger, H. , Leenders, K. L. , & de Jong, B. M. (2012). Handedness correlates with the dominant parkinson side: A systematic review and meta‐analysis. Movement Disorders, 27, 206–210. 10.1002/mds.24007 [DOI] [PubMed] [Google Scholar]
- van Wijk, B. C. M. , Cagnan, H. , Litvak, V. , Kühn, A. A. , & Friston, K. J. (2018). Generic dynamic causal modelling: An illustrative application to Parkinson's disease. NeuroImage, 181, 818–830. 10.1016/j.neuroimage.2018.08.039 [DOI] [PMC free article] [PubMed] [Google Scholar]
- Verstynen, T. , Diedrichsen, J. , Albert, N. , Aparicio, P. , & Ivry, R. B. (2004). Ipsilateral motor cortex activity during unimanual hand movements relates to task complexity. Journal of Neurophysiology, 93, 1209–1222. 10.1152/jn.00720.2004 [DOI] [PubMed] [Google Scholar]
- Volz, L. J. , Eickhoff, S. B. , Pool, E. M. , Fink, G. R. , & Grefkes, C. (2015). Differential modulation of motor network connectivity during movements of the upper and lower limbs. NeuroImage, 119, 44–53. 10.1016/j.neuroimage.2015.05.101 [DOI] [PubMed] [Google Scholar]
- Wang, D. , & Liu, H. (2015). Functional connectivity architecture of the human brain: Not all the same. The Neuroscientist, 20, 432–438. 10.1177/1073858414543290 [DOI] [PMC free article] [PubMed] [Google Scholar]
- Ward, N. S. , & Frackowiak, R. S. J. (2003). Age‐related changes in the neural correlates of motor performance. Brain, 126, 873–888. 10.1093/brain/awg071 [DOI] [PMC free article] [PubMed] [Google Scholar]
- Ward, N. S. , Swayne, O. B. C. , & Newton, J. M. (2008). Age‐dependent changes in the neural correlates of force modulation: An fMRI study. Neurobiology of Aging, 29, 1434–1446. 10.1016/j.neurobiolaging.2007.04.017 [DOI] [PMC free article] [PubMed] [Google Scholar]
- Wu, T. , & Hallett, M. (2005). The influence of normal human ageing on automatic movements. The Journal of Physiology, 562, 605–615. 10.1113/jphysiol.2004.076042 [DOI] [PMC free article] [PubMed] [Google Scholar]
- Wu, T. , Hou, Y. , Hallett, M. , Zhang, J. , & Chan, P. (2015). Lateralization of brain activity pattern during unilateral movement in Parkinson's disease. Human Brain Mapping, 36, 1878–1891. 10.1002/hbm.22743 [DOI] [PMC free article] [PubMed] [Google Scholar]
- Yust‐Katz, S. , Tesler, D. , Treves, T. A. , Melamed, E. , & Djaldetti, R. (2008). Handedness as a predictor of side of onset of Parkinson's disease. Parkinsonism and Related Disorders, 14, 633–635. 10.1016/j.parkreldis.2008.01.017 [DOI] [PubMed] [Google Scholar]
Associated Data
This section collects any data citations, data availability statements, or supplementary materials included in this article.
Supplementary Materials
Data S1: Supporting Information
Data Availability Statement
The data that support the findings of this study are available on request from the corresponding author. The data are not publicly available due to privacy or ethical restrictions.