

Abstract
Increasing spatial working memory (SWM) load is generally associated with declines in behavioral performance, but the neural correlates of load‐related behavioral effects remain poorly understood. Herein, we examine the alterations in oscillatory activity that accompany such performance changes in 22 healthy adults who performed a two‐ and four‐load SWM task during magnetoencephalography (MEG). All MEG data were transformed into the time‐frequency domain and significant oscillatory responses were imaged separately per load using a beamformer. Whole‐brain correlation maps were computed using the load‐related beamformer difference images and load‐related accuracy effects on the SWM task. The results indicated that load‐related differences in left inferior frontal alpha activity during encoding and maintenance were negatively correlated with load‐related accuracy differences on the SWM task. That is, individuals who had more substantial decreases in prefrontal alpha during high‐relative to low‐load SWM trials tended to have smaller performance decrements on the high‐load condition (i.e., they performed more accurately). The same pattern of neurobehavioral correlations was observed during the maintenance period for right superior temporal alpha activity and right superior parietal beta activity. Importantly, this is the first study to employ a voxel‐wise whole‐brain approach to significantly link load‐related oscillatory differences and load‐related SWM performance differences.
Keywords: magnetoencephalography (MEG), oscillatory activity, posterior parietal cortex (PPC), prefrontal cortex (PFC), superior temporal cortex
1. INTRODUCTION
Spatial working memory (SWM) refers to the temporary online maintenance and/or manipulation of spatial information to be used towards a specific goal, and is typically divided into three subprocesses: encoding, maintenance, and retrieval (Baddeley, 1992). Encoding involves the loading of information into working memory (WM), while maintenance encompasses the active rehearsal of that information for a brief period of time. Finally, retrieval refers to the recall and application of the information to achieve a cognitive goal. Previous functional magnetic resonance imaging (fMRI) and positron emission tomography (PET) investigations have demonstrated that a bilateral network of predominantly frontal and parietal brain regions is implicated in SWM processes, and that activity within this network tends to scale with WM load (i.e., the number of items held in WM; Bauer, Sammer, & Toepper, 2015; Blacker & Courtney, 2016; Bollmann et al., 2015; Cabeza & Nyberg, 2000; Curtis, 2006; Fusser et al., 2011; Glahn et al., 2002; Harrison, Jolicoeur, & Marois, 2010; Huang et al., 2016; Leung, Seelig, & Gore, 2004; Magen, Emmanouil, McMains, Kastner, & Treisman, 2009; Nagel et al., 2009; Nee et al., 2013; Rottschy et al., 2012; Srimal & Curtis, 2008; Todd & Marois, 2004; Toepper et al., 2014). Additionally, studies investigating oscillatory activity during SWM performance have largely corroborated the aforementioned body of literature by showing the recruitment of a similar network of cortical regions during SWM in the alpha and beta bands, and activity in these regions is also sensitive to load modulations (Boonstra, Powell, Mehrkanoon, & Breakspear, 2013; Crespo‐Garcia et al., 2013; Gevins & Smith, 2000; Gevins, Smith, McEvoy, & Yu, 1997; Grimault et al., 2009; Honkanen, Rouhinen, Wang, Palva, & Palva, 2015; Medendorp et al., 2007; Roux, Wibral, Mohr, Singer, & Uhlhaas, 2012).
Surprisingly, although load‐related differences in task performance (i.e., poorer performance as SWM load increased) are also generally reported (Boonstra et al., 2013; Crespo‐Garcia et al., 2013; Gevins & Smith, 2000; Gevins et al., 1997; Roux et al., 2012), few studies have directly investigated how such behavioral differences are linked to load‐related differences in neural activity. Broadly speaking, fMRI research has demonstrated that better SWM performance on a single‐load task is tied to the greater recruitment of bilateral prefrontal cortices (PFC), frontal eye fields, and posterior parietal cortices (Bauer et al., 2015; Curtis, Rao, & D'Esposito, 2004; Leung et al., 2004; Leung, Oh, Ferri, & Yi, 2007; Nagel et al., 2009; Sakai, Rowe, & Passingham, 2002), and a magnetoencephalography (MEG) study found that stronger decreases in beta oscillatory activity within prefrontal and superior temporal regions were associated with better accuracy on a SWM task (Proskovec, Wiesman, Heinrichs‐Graham, & Wilson, 2018). Additionally, using a delayed‐recall spatial navigation task, Crespo‐Garcia et al. (2016) found that decreased theta activity within hippocampal, insular, and occipitotemporal regions during encoding was related to greater accuracy during recall. Concerning SWM load effects, there is some evidence that individuals who perform better on SWM tasks recruit left prefrontal regions more strongly as SWM load increases, relative to individuals who perform worse on such tasks (Bauer et al., 2015; Nagel et al., 2009). However, only one study has attempted to identify the oscillatory responses underlying such load‐related behavioral differences. Though informative, this study limited its analyses to gamma activity within two regions of interest, and showed that the number of behaviorally relevant items maintained in SWM could be predicted by gamma activity within the left medial PFC with a 59% probability (Roux et al., 2012). Overall, these studies have made important contributions to understanding how neural responses relate to load‐related behavioral differences in SWM performance, but much remains unknown.
The goal of the present SWM study was to identify the relationship between load‐related differences in oscillatory activity and behavioral performance utilizing a whole‐brain, multispectral oscillatory analysis approach and MEG. Participants completed a SWM task that varied in load demand (i.e., two vs. four locations), and it was hypothesized that performance would be worse on the high‐relative to the low‐load variant of the task. Additionally, it was anticipated that individuals who recruit prefrontal and superior temporal cortices more strongly during high‐relative to low‐load SWM trials, as evidenced by greater decreases in alpha/beta activity, would perform better (i.e., demonstrate less of a behavioral decrement between loads) than individuals who exhibit less of a difference in oscillatory activity between loads.
2. MATERIALS AND METHODS
2.1. Subject selection
We studied 22 healthy adults (11 females; mean age: 26.05, SD: 4.02, range: 21–35) who had normal or corrected‐to‐normal vision and were recruited from the local community. Exclusionary criteria included any medical illness affecting central nervous system function, neurological or psychiatric disorder, history of head trauma, current substance abuse, and ferromagnetic implants. After providing a complete description of the study, written informed consent was obtained from all participants following the guidelines of the University of Nebraska Medical Center's Institutional Review Board.
2.2. Experimental paradigm
During MEG recording, participants performed a visual SWM task (Figure 1) within a magnetically shielded room. Each trial consisted of the presentation of an empty 7 × 9 grid for 1.5 s, followed by two (low‐load condition) or four (high‐load condition) black squares displayed within the grid for 1.5 s (encoding), then an empty grid for 2.5 s (maintenance), and finally a probe of either two or four black squares, respectively, presented within the grid for 1.0 s (retrieval). In 50% of trials, the probe was identical to the previous encoding stimulus, while in the remaining trials the location of one square had moved within the grid. Participants responded via button press as to whether the probe was identical to the previous encoding stimulus (yes or no) using their right index and middle fingers. The two conditions were presented in separate runs, separated by a brief (~4 min) break, and the order of conditions was counter‐balanced across participants. Each trial lasted 6.5 s, and there were a total of 128 trials per condition, resulting in a total run‐time of ~14 min per condition.
Figure 1.
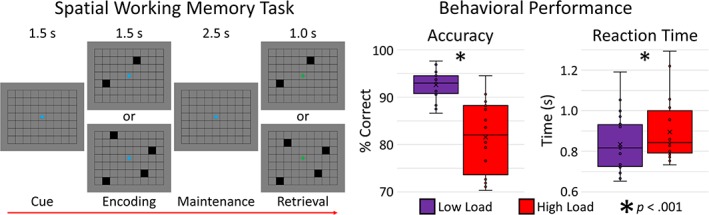
Left panel: Load‐varying spatial working memory (SWM) task. Right panel: Behavioral results for the SWM task with accuracy (% correct) depicted to the left, and reaction time (s) to the right. Performance differed between loads, such that participants were more accurate and faster to respond during low‐load (purple) relative to high‐load (red) performance (p < .001) [Color figure can be viewed at http://wileyonlinelibrary.com]
2.3. MEG data acquisition
Recordings occurred in a one‐layer magnetically shielded room with active shielding engaged. Neuromagnetic responses were sampled continuously at 1 kHz, using an acquisition bandwidth of 0.1–330 Hz and a 306‐sensor Elekta system (Elekta, Helsinki, Finland). MEG data from each participant were individually corrected for head motion and noise reduced using the signal space separation method with a temporal extension (Taulu & Simola, 2006; Taulu, Simola, & Kajola, 2005).
2.4. MEG coregistration and structural MRI acquisition and processing
Preceding MEG measurement, four coils were attached to the participant's head and localized, together with the three fiducial points and scalp surface, with a 3‐D digitizer (Fastrak 3SF0002, Polhemus Navigator Sciences, Colchester, VT). During MEG recording, an electric current with a unique frequency label (e.g., 322 Hz) was fed to each coil, inducing a measurable magnetic field which allowed each coil to be localized in reference to the sensors throughout the recording session. Since coil locations were also known in head coordinates, all MEG measurements could be transformed into a common coordinate system. With this coordinate system, each participant's MEG data were coregistered with a high‐resolution structural T1‐weighted template brain using BESA MRI (Version 2.0; BESA GmbH, Gräfelfing, Germany). The structural MRI data were in standardized space and aligned parallel to the anterior and posterior commissures.
2.5. MEG time‐frequency transformation and statistics
Cardiac and eye‐blink artifacts were removed from the data using signal‐space projection (SSP), which was accounted for during source reconstruction (Uusitalo & Ilmoniemi, 1997). The continuous magnetic time series was divided into epochs of 6.5 s duration, with the onset of the encoding stimulus being defined as 0.0 s and the baseline defined as the −0.4 to 0.0 s time window. Given our task and epoch design, maintenance onset occurred at 1.5 s and retrieval onset occurred at 4.0 s. Epochs containing artifacts were rejected based on a fixed threshold method, supplemented with visual inspection, and two participants were excluded from all statistical analyses due to excessive artifacts in their MEG data. This reduced the final sample size to 20 participants. Additionally, nonartifactual trials were randomly excluded per participant so that the total number of accepted trials used in the final analyses did not differ between loads. All trials where the participant responded incorrectly were also excluded from analysis. On average, 84.35 (SD = 7.69) and 83.95 (SD = 8.26) trials per participant were used from the low‐ and high‐load conditions, respectively, and this was not significantly different between conditions, t(19) = 1.17, p = .26.
Artifact‐free epochs were transformed into the time‐frequency domain using complex demodulation with a resolution of 1.0 Hz and 50 ms for frequencies spanning from 4 to 90 Hz. Briefly, complex demodulation is a windowed Fourier time‐frequency analysis that reduces spectral leakage, is computationally efficient, and thus is oftentimes preferable to other transforms (Kovach & Gander, 2016). Essentially, for each frequency of interest, the original signal was multiplied by a pair of complex sinusoids, and the two resulting signals were low‐pass filtered using a finite impulse response (FIR) filter to recover the real and imaginary components of the complex signal as a function of time (Hoechstetter et al., 2004). The resulting power estimations per gradiometer sensor were averaged across all trials (low + high load) to generate time‐frequency plots of mean spectral density (i.e., spectrograms), and normalized using the mean power during the baseline period. Each data point per spectrogram was initially evaluated using a mass univariate approach based on the general linear model (GLM). To reduce the risk of false positive results while maintaining reasonable sensitivity, a two‐stage procedure was followed. In the first stage, one‐sample t‐tests were conducted on each data point and the output spectrogram of t‐values was thresholded at p < .05 to identify time‐frequency bins containing potentially significant oscillatory activity across all participants. In stage two, time‐frequency bins that survived this threshold were clustered with temporally and/or spectrally neighboring bins that were also significant, and a cluster value was computed by summing the t‐values of all data points in the cluster. Nonparametric permutation testing was then used to derive a distribution of cluster‐values and the significance level of the observed clusters (from stage one) were tested directly using this distribution (Ernst, 2004; Maris & Oostenveld, 2007). For each comparison, at least 10,000 permutations were computed to build a distribution of cluster values. Based on these analyses, only the time‐frequency windows within the encoding and maintenance periods that contained significant oscillatory events across all participants and both conditions were subjected to the beamforming (i.e., imaging) analysis. Thus, a data driven approach was adopted to identify the significant oscillatory responses on which to focus the neurobehavioral analysis.
2.6. MEG source imaging
Cortical networks were imaged for each condition independently through an extension of the linearly constrained minimum variance vector beamformer (Gross et al., 2001; Hillebrand, Singh, Holliday, Furlong, & Barnes, 2005), which calculates source power for the entire brain volume by employing spatial filters in the time‐frequency domain. The single images were derived from the cross‐spectral densities of all combinations of MEG gradiometers averaged over the time‐frequency range of interest, and the solution of the forward problem for each location on a grid specified by input voxel space. The source power in these images was normalized per participant using a separately averaged prestimulus noise period (i.e., baseline) of equal duration and bandwidth (Hillebrand et al., 2005). MEG preprocessing and imaging used the Brain Electrical Source Analysis (version 6.1) software. Normalized source power per condition was computed for the selected time‐frequency bands over the entire brain volume per participant at 4.0 × 4.0 × 4.0 mm resolution. Each participant's functional images were then transformed into standardized space and spatially resampled.
2.7. Neurobehavioral correlation analyses
To identify brain regions in which load‐related differences in oscillatory activity were related to load‐related differences in SWM performance, we utilized the data from the individual whole‐brain maps computed in the previous step. That is, for each participant, we first computed difference maps for encoding and maintenance separately by subtracting the baseline‐normalized low‐load map from the respective baseline‐normalized high‐load map. Specifically, load‐related difference maps were computed for “alpha encoding” (8–11 Hz activity spanning from 0.4 to 1.6 s), “alpha maintenance” (8–11 Hz activity spanning from 1.6 to 4.0 s), “beta encoding” (15–20 Hz activity spanning from 0.4 to 1.6 s), and “beta maintenance” (15–20 Hz activity spanning from 1.6 to 4.0 s). Additionally, we calculated the load‐related difference in accuracy (high – low) for each participant. Specifically, the percentage of correct trials when performing the low‐load condition was subtracted from the percentage of correct trials when performing the high‐load condition. Thereafter, we performed a series of Pearson correlations using each participant's difference maps and their respective behavioral difference on the task. Specifically, we computed whole‐brain correlation maps between load‐related differences in SWM accuracy and the alpha encoding difference maps, and repeated this procedure to compute whole‐brain correlations between load‐related accuracy differences and each of the other three difference maps (i.e., alpha maintenance, beta encoding, and beta maintenance). These whole‐brain correlation maps were displayed as a function of alpha level, and adjusted for multiple comparisons using a cluster criterion (k = 200 contiguous voxels).
3. RESULTS
3.1. Behavioral results
Task performance differed between conditions, such that participants were significantly more accurate when performing the low‐load condition (M = 92.60%, SD = 3.05%) relative to the high‐load condition (M = 81.57%, SD = 7.46%), t(19) = 7.29, p < .001 (Figure 1). Participants also responded significantly faster during low‐load (M = 835.13 ms, SD = 139.93 ms) relative to high‐load trials (M = 895.31 ms, SD = 153.11 ms), t(19) = −4.67, p < .001.
3.2. MEG results
Statistical analyses of the sensor‐level time‐frequency spectrograms revealed significant clusters of decreased alpha (8–11 Hz) and beta (15–20 Hz) oscillatory activity in gradiometers near temporal, parietal, and occipital cortices across all participants and loads (p < .001, corrected using permutation testing), with the spectrogram from the peak sensor located near the parietal cortices shown in Figure 2 (see Figure S1 in the Supporting Information for a grand average spectrogram across all relevant sensors). These responses began about 0.4 s after encoding onset, and persisted throughout the remainder of the encoding and maintenance periods. Significant oscillatory responses in higher frequencies were not observed (see Figure S1).
Figure 2.
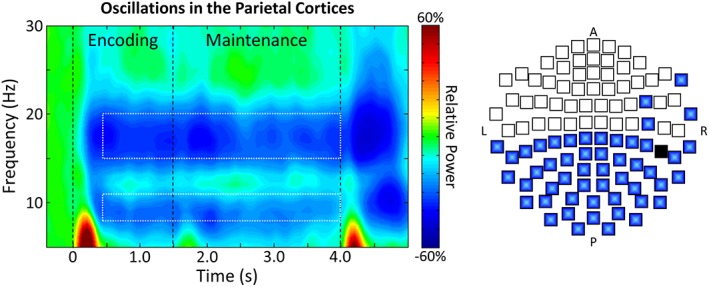
Left: Time‐frequency spectrogram with time (s) shown on the x‐axis and frequency (Hz) denoted on the y‐axis. Percent power change was computed for each time‐frequency bin relative to the respective bin's baseline power (−0.4 to 0.0 s). The color legend is displayed to the right of the spectrogram. Data represent a peak sensor, collapsed across loads and participants, located near the parietal cortices. Strong decreases in alpha and beta activity were observed following encoding onset, which were sustained throughout the remainder of encoding and maintenance. The time‐frequency windows containing significant oscillatory responses relative to baseline activity (i.e., those selected for beamforming) are depicted by the white‐dashed boxes. Right: A 2D map of the sensor array is shown, with blue sensors denoting those in which significant decreases in alpha and beta oscillations (i.e., the responses bounded by the white‐dashed boxes) were observed. As shown, these responses were detected in gradiometers near occipital, parietal, and temporal regions. Note that the black sensor was not included in the sensor‐level statistical analysis, as it was noisy in most participants [Color figure can be viewed at http://wileyonlinelibrary.com]
To investigate how load‐related oscillatory differences related to load‐related behavioral performance differences on the SWM task, whole‐brain correlation maps were computed separately using the alpha and beta encoding and maintenance difference images (high load – low load) and accuracy differences between loads. This revealed that, during both encoding and maintenance, load‐related alpha differences in two regions of the left inferior frontal gyrus (IFG) were negatively correlated with load‐related differences on the SWM task (Figure 3; p < .01, cluster‐corrected). Additionally, during only the maintenance period, load‐related alpha differences in the right superior temporal sulcus (STS) and beta differences in the right superior parietal lobule (SPL) were negatively correlated with load‐related accuracy differences (Figure 3; p < .01, cluster‐corrected). That is, throughout encoding and maintenance, the greater the decrease in left IFG alpha activity during high‐ relative to low‐load SWM trials, the smaller the difference in accuracy between loads. Similarly, during the maintenance period, the stronger the decrease in right STS alpha activity and SPL beta activity during high‐ relative to low‐load SWM trials, the smaller the decrement in high‐ relative to low‐load accuracy.
Figure 3.
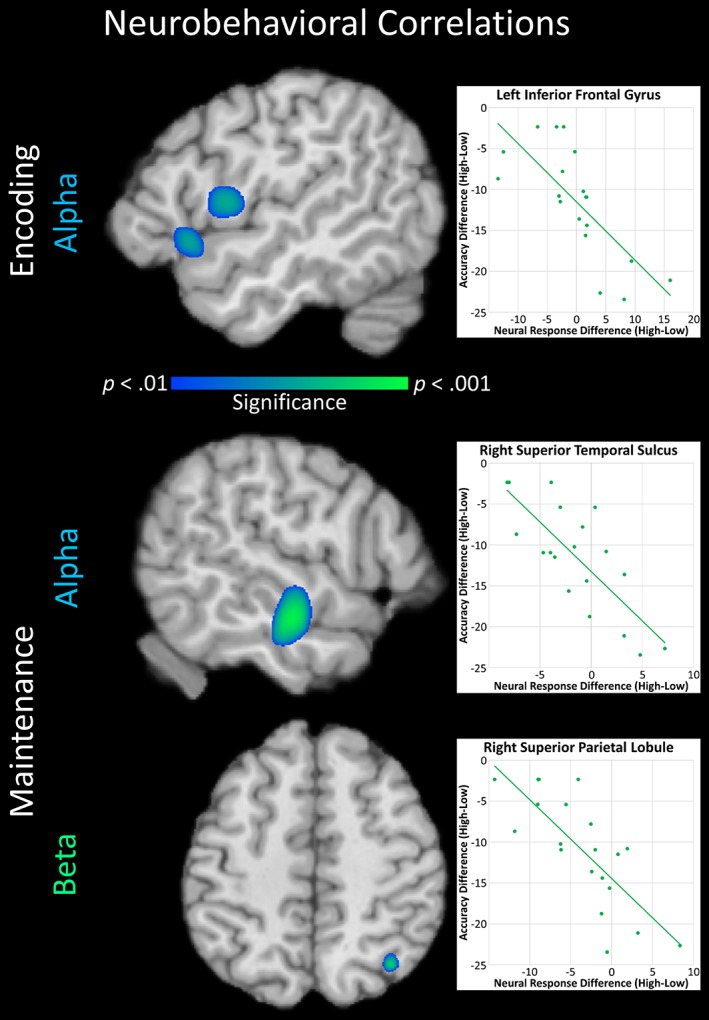
Top: Load‐related differences (high–low) in alpha (8–11 Hz) activity in two regions of the left inferior frontal gyrus (IFG) during encoding were negatively correlated with load‐related differences in accuracy. A scatterplot representing the relationship is presented to the right utilizing the data from the peak voxel of the posterior IFG cluster. The scatterplot of the anterior IFG cluster was very similar. Values on the x‐axis represent the difference between the magnitudes of the response (expressed in pseudo‐t units) during the high‐load relative to low‐load condition. Specifically, a negative value denotes a stronger decrease in alpha activity during the high‐ relative to low‐load condition, while a positive value denotes a stronger decrease in alpha activity during the low‐ relative to high‐load condition. Values on the y‐axis represent the difference between the percentages of correct trials (high – low condition). Specifically, a negative value denotes lower accuracy in the high‐ relative to low‐load condition. The relationship between activity in these two IFG clusters and accuracy persisted throughout maintenance (not pictured). Bottom: Load‐related differences in alpha activity in the right superior temporal sulcus and load‐related differences in beta (15–20 Hz) activity in the right superior parietal lobule during maintenance were negatively correlated with load‐related differences in accuracy. Scatterplots representing these relationships are presented to the right utilizing the data from the peak voxels of the whole‐brain correlation maps, and the axis values should be interpreted in the same manner as that described above. All maps are shown at a threshold of p < .01, cluster‐corrected [Color figure can be viewed at http://wileyonlinelibrary.com]
4. DISCUSSION
In this study, we examined whether load‐related differences in oscillatory activity were related to differences in SWM accuracy between loads. Our results demonstrated that stronger decreases in left IFG alpha activity during encoding and maintenance, as well as greater decreases in right STS alpha and right superior parietal beta activity during maintenance, during high‐ relative to low‐load SWM trials were tied to smaller accuracy decrements between loads. These findings are discussed in further detail below.
Our data indicated that, while individuals generally performed worse on the high‐load variant of the task, those who recruited the left IFG more strongly as load increased tended to have more preserved SWM performance, despite the increasing task difficulty. Previous studies have implicated the ventrolateral PFC (VLPFC; including the IFG) in the selection, comparison, and judgment of task‐relevant information (Glahn et al., 2002; Owen, McMillan, Laird, & Bullmore, 2005), and this region is further believed to support storage processes during WM performance (Bauer et al., 2015; Glahn et al., 2002; Owen, 2000; Owen et al., 1999; Wager & Smith, 2003). Considering these putative VLPFC functions, and provided that decreased alpha and/or beta oscillations within a neural region are thought to reflect the active recruitment of that region in ongoing processes (Jensen & Mazaheri, 2010; Klimesch, 2012; Klimesch, Sauseng, & Hanslmayr, 2007; Medendorp et al., 2007), the pattern of neurobehavioral correlations that we observed in this region was not surprising, and also aligned with previous fMRI research (Bauer et al., 2015; Nagel et al., 2009).
In addition, our findings are the first, to the best of our knowledge, to suggest that load‐sensitive alpha oscillations within superior temporal cortices and beta oscillations within superior parietal cortices are central to successfully meeting the increased demands of high‐load SWM processing. Similar parietal regions have been tied to the top‐down control of spatial attention, and the retention of spatial features (Corbetta, Kincade, & Shulman, 2002; Honkanen et al., 2015; Rizzolatti & Matelli, 2003; Rottschy et al., 2013), while comparable superior temporal regions have been linked to the processing of relations between simultaneously presented stimuli (Kwok & Macaluso, 2015; Park et al., 2011; Raabe, Fischer, Bernhardt, & Greenlee, 2013). As previously mentioned, the stronger engagement of prefrontal, posterior parietal, and superior temporal regions during SWM has been directly tied to better SWM performance in single load paradigms, and our results extend upon this work by demonstrating that activity in these regions is critical to maintaining performance with increasing SWM demands.
Finally, our data have important implications for an influential theory in cognitive neuroscience: the compensation‐related utilization of neural circuits hypothesis (CRUNCH; Reuter‐Lorenz & Cappell, 2008). This theory posits that at low cognitive demands, younger adults will not engage all of the neural resources which are available to them. However, with increasing cognitive demands, younger adults will recruit compensatory neural mechanisms, allowing them to maintain behavioral performance (Reuter‐Lorenz & Cappell, 2008). Our findings may shed light on some of the oscillatory mechanisms supporting this hypothesis, as it was the flexible recruitment of inferior frontal regions throughout encoding and maintenance, via decreased alpha activity, and superior temporal and parietal regions during maintenance, via decreased alpha and beta activity, that predicted how well individuals maintained behavioral performance on the high‐load SWM task. It is important to note that CRUNCH also encapsulates a prominent aging component (Reuter‐Lorenz & Cappell, 2008), and age has been shown to modulate the oscillatory dynamics serving WM performance (Proskovec, Heinrichs‐Graham, & Wilson, 2016). Thus, while our study only utilized healthy younger adults, future work should investigate the interaction between age and load in this context.
In conclusion, the present study offers novel insight into the relationship between load‐related oscillatory differences and load‐related SWM performance differences, and is the first to utilize a multispectral voxel‐wise whole‐brain approach in this regard. Taken together, our results implicate the flexible recruitment of a distributed network of frontal, temporal, and parietal regions in preserving SWM accuracy in the face of increasing demands, and further reinforce the functional significance of such regions in visuospatial encoding and retention processes.
CONFLICT OF INTERESTS
The authors report no competing financial or other interests.
AUTHOR CONTRIBUTIONS
A.L.P., E.H‐G., and T.W.W. contributed to experimental design. A.L.P., A.I.W., and E.H‐G. assisted in participant recruitment, and A.L.P. collected data. A.L.P., A.I.W., E.H‐G., and T.W.W. contributed to data analysis and interpretation. A.L.P. and T.W.W. drafted the article. A.L.P., A.I.W., E.H‐G., and T.W.W. contributed to article revisions. All authors take responsibility for the contents of this article.
Supporting information
Figure S1 Time‐frequency spectrograms with time (s) shown on the x‐axis and frequency (Hz) denoted on the y‐axis. For each gradiometer in the sensor array, percent power change was computed for each time‐frequency bin relative to the respective bin's baseline power (−0.4 to 0.0 s) for frequencies ranging from 4 to 90 Hz. Left: The spectrogram from the peak sensor, which was located near the parietal cortices. Note that this spectrogram is from the same sensor as that shown in Figure 2 of the main text; the only difference is that the y‐axis is expressed all the way to 90 Hz (Figure 2 stops at 30 Hz to highlight the response). Significant decreases in alpha (8–11 Hz) and beta (15–20 Hz) activity spanned from 0.4 s to 4.0 s. These significant responses were observed in multiple sensors located near occipital, parietal, and temporal regions (see 2D sensor map included in Figure 2 of the main text). Right: A grand average spectrogram is shown. This spectrogram was computed by collapsing across all sensors in which the significant responses of interest were observed (see 2D sensor map included in Figure 2 of the main text). Relative to the peak sensor spectrogram, the alpha and beta responses shown in the grand average spectrogram were of reduced magnitude (note the color scale bar change). This, of course, was to be expected, as the peak sensor was that in which these responses were of greatest magnitude, whereas the grand average was the average of all sensors in which these responses were significant but of varying magnitudes. Importantly, the responses shown in the peak and grand average spectrograms were remarkably similar with regards to direction, frequency, and temporal characteristics. Thus, these data demonstrate that the peak sensor spectrogram provided an accurate representation of the data at large.
ACKNOWLEDGMENTS
This work was supported by the National Institutes of Health (grants R01 MH103220 [TWW], R01 MH116782 [TWW], R01 MH118013 [TWW], and F31 AG055332 [AIW]) and the National Science Foundation (grant #1539067 [TWW]). This work was also supported by a Research Support Fund grant from the Nebraska Health System and the University of Nebraska Medical Center (TWW), as well as a University of Nebraska at Omaha Graduate Research and Creative Activity Award (ALP). The funders had no role in study design, data collection and analysis, decision to publish, or preparation of the manuscript.
Proskovec AL, Wiesman AI, Heinrichs‐Graham E, Wilson TW. Load effects on spatial working memory performance are linked to distributed alpha and beta oscillations. Hum Brain Mapp. 2019;40:3682–3689. 10.1002/hbm.24625
Data Availability Statement: The data that support the findings of this study are available from the corresponding author upon reasonable request.
Funding information National Institute of Mental Health, Grant/Award Numbers: MH103220, MH116782, MH118013; National Institute on Aging, Grant/Award Number: AG055332; National Science Foundation, Grant/Award Number: 1539067; University of Nebraska Medical Center; Nebraska Health System
Data Availability Statement
The data that support the findings of this study are available from the corresponding author upon reasonable request.
REFERENCES
- Baddeley, A. (1992). Working memory. Science, 255(5044), 556–559. [DOI] [PubMed] [Google Scholar]
- Bauer, E. , Sammer, G. , & Toepper, M. (2015). Trying to put the puzzle together: Age and performance level modulate the neural response to increasing task load within left rostral prefrontal cortex. BioMed Research International, 2015, 415458 10.1155/2015/415458 [DOI] [PMC free article] [PubMed] [Google Scholar]
- Blacker, K. J. , & Courtney, S. M. (2016). Distinct neural substrates for maintaining locations and spatial relations in working memory. Frontiers in Human Neuroscience, 10, 594 10.3389/fnhum.2016.00594 [DOI] [PMC free article] [PubMed] [Google Scholar]
- Bollmann, S. , Ghisleni, C. , Poil, S.‐S. , Martin, E. , Ball, J. , Eich‐Höchli, D. , … Brandeis, D. (2015). Age‐dependent and ‐independent changes in attention‐deficit/hyperactivity disorder (ADHD) during spatial working memory performance. The World Journal of Biological Psychiatry: The Official Journal of the World Federation of Societies of Biological Psychiatry, 18, 1–12. 10.3109/15622975.2015.1112034 [DOI] [PubMed] [Google Scholar]
- Boonstra, T. W. , Powell, T. Y. , Mehrkanoon, S. , & Breakspear, M. (2013). Effects of mnemonic load on cortical activity during visual working memory: Linking ongoing brain activity with evoked responses. International Journal of Psychophysiology: Official Journal of the International Organization of Psychophysiology, 89(3), 409–418. 10.1016/j.ijpsycho.2013.04.001 [DOI] [PubMed] [Google Scholar]
- Cabeza, R. , & Nyberg, L. (2000). Imaging cognition II: An empirical review of 275 PET and fMRI studies. Journal of Cognitive Neuroscience, 12(1), 1–47. [DOI] [PubMed] [Google Scholar]
- Corbetta, M. , Kincade, J. M. , & Shulman, G. L. (2002). Neural systems for visual orienting and their relationships to spatial working memory. Journal of Cognitive Neuroscience, 14(3), 508–523. 10.1162/089892902317362029 [DOI] [PubMed] [Google Scholar]
- Crespo‐Garcia, M. , Pinal, D. , Cantero, J. L. , Díaz, F. , Zurrón, M. , & Atienza, M. (2013). Working memory processes are mediated by local and long‐range synchronization of alpha oscillations. Journal of Cognitive Neuroscience, 25(8), 1343–1357. 10.1162/jocn_a_00379 [DOI] [PubMed] [Google Scholar]
- Crespo‐Garcia, M. , Zeiller, M. , Leupold, C. , Kreiselmeyer, G. , Rampp, S. , Hamer, H. M. , & Dalal, S. S. (2016). Slow‐theta power decreases during item‐place encoding predict spatial accuracy of subsequent context recall. NeuroImage, 142, 533–543. 10.1016/j.neuroimage.2016.08.021 [DOI] [PubMed] [Google Scholar]
- Curtis, C. E. (2006). Prefrontal and parietal contributions to spatial working memory. Neuroscience, 139(1), 173–180. 10.1016/j.neuroscience.2005.04.070 [DOI] [PubMed] [Google Scholar]
- Curtis, C. E. , Rao, V. Y. , & D'Esposito, M. (2004). Maintenance of spatial and motor codes during oculomotor delayed response tasks. The Journal of Neuroscience, 24(16), 3944–3952. 10.1523/JNEUROSCI.5640-03.2004 [DOI] [PMC free article] [PubMed] [Google Scholar]
- Ernst, M. D. (2004). Permutation methods: A basis for exact inference. Statistical Science, 19(4), 676–685. 10.1214/088342304000000396 [DOI] [Google Scholar]
- Fusser, F. , Linden, D. E. J. , Rahm, B. , Hampel, H. , Haenschel, C. , & Mayer, J. S. (2011). Common capacity‐limited neural mechanisms of selective attention and spatial working memory encoding. The European Journal of Neuroscience, 34(5), 827–838. 10.1111/j.1460-9568.2011.07794.x [DOI] [PMC free article] [PubMed] [Google Scholar]
- Gevins, A. , & Smith, M. E. (2000). Neurophysiological measures of working memory and individual differences in cognitive ability and cognitive style. Cerebral Cortex, 10(9), 829–839. [DOI] [PubMed] [Google Scholar]
- Gevins, A. , Smith, M. E. , McEvoy, L. , & Yu, D. (1997). High‐resolution EEG mapping of cortical activation related to working memory: Effects of task difficulty, type of processing, and practice. Cerebral Cortex, 7(4), 374–385. [DOI] [PubMed] [Google Scholar]
- Glahn, D. C. , Kim, J. , Cohen, M. S. , Poutanen, V. P. , Therman, S. , Bava, S. , … Cannon, T. D. (2002). Maintenance and manipulation in spatial working memory: Dissociations in the prefrontal cortex. NeuroImage, 17(1), 201–213. [DOI] [PubMed] [Google Scholar]
- Grimault, S. , Robitaille, N. , Grova, C. , Lina, J. M. , Dubarry, A. S. , & Jolicoeur, P. (2009). Oscillatory activity in parietal and dorsolateral prefrontal cortex during retention in visual short‐term memory: Additive effects of spatial attention and memory load. Human Brain Mapping, 30(10), 3378–3392. 10.1002/hbm.20759 [DOI] [PMC free article] [PubMed] [Google Scholar]
- Gross, J. , Kujala, J. , Hamalainen, M. , Timmermann, L. , Schnitzler, A. , & Salmelin, R. (2001). Dynamic imaging of coherent sources: Studying neural interactions in the human brain. Proceedings of the National Academy of Sciences of the United States of America, 98(2), 694–699. 10.1073/pnas.98.2.694 [DOI] [PMC free article] [PubMed] [Google Scholar]
- Harrison, A. , Jolicoeur, P. , & Marois, R. (2010). "What" and "where" in the intraparietal sulcus: An FMRI study of object identity and location in visual short‐term memory. Cerebral Cortex, 20(10), 2478–2485. 10.1093/cercor/bhp314 [DOI] [PMC free article] [PubMed] [Google Scholar]
- Hillebrand, A. , Singh, K. D. , Holliday, I. E. , Furlong, P. L. , & Barnes, G. R. (2005). A new approach to neuroimaging with magnetoencephalography. Human Brain Mapping, 25(2), 199–211. 10.1002/hbm.20102 [DOI] [PMC free article] [PubMed] [Google Scholar]
- Hoechstetter, K. , Bornfleth, H. , Weckesser, D. , Ille, N. , Berg, P. , & Scherg, M. (2004). BESA source coherence: A new method to study cortical oscillatory coupling. Brain Topography, 16(4), 233–238. [DOI] [PubMed] [Google Scholar]
- Honkanen, R. , Rouhinen, S. , Wang, S. H. , Palva, J. M. , & Palva, S. (2015). Gamma oscillations underlie the maintenance of feature‐specific information and the contents of visual working memory. Cerebral Cortex, 25(10), 3788–3801. 10.1093/cercor/bhu263 [DOI] [PubMed] [Google Scholar]
- Huang, R.‐R. , Jia, B.‐H. , Xie, L. , Ma, S.‐H. , Yin, J.‐J. , Sun, Z.‐B. , … Luo, D.‐X. (2016). Spatial working memory impairment in primary onset middle‐age type 2 diabetes mellitus: An ethology and BOLD‐fMRI study. Journal of Magnetic Resonance Imaging: JMRI, 43(1), 75–87. 10.1002/jmri.24967 [DOI] [PubMed] [Google Scholar]
- Jensen, O. , & Mazaheri, A. (2010). Shaping functional architecture by oscillatory alpha activity: Gating by inhibition. Frontiers in Human Neuroscience, 4, 186. 10.3389/fnhum.2010.00186 [DOI] [PMC free article] [PubMed] [Google Scholar]
- Klimesch, W. (2012). Alpha‐band oscillations, attention, and controlled access to stored information. Trends in Cognitive Sciences, 16(12), 606–617. 10.1016/j.tics.2012.10.007 [DOI] [PMC free article] [PubMed] [Google Scholar]
- Klimesch, W. , Sauseng, P. , & Hanslmayr, S. (2007). EEG alpha oscillations: The inhibition‐timing hypothesis. Brain Research Reviews, 53(1), 63–88. 10.1016/j.brainresrev.2006.06.003 [DOI] [PubMed] [Google Scholar]
- Kovach, C. K. , & Gander, P. E. (2016). The demodulated band transform. Journal of Neuroscience Methods, 261, 135–154. 10.1016/j.jneumeth.2015.12.004 [DOI] [PMC free article] [PubMed] [Google Scholar]
- Kwok, S. C. , & Macaluso, E. (2015). Immediate memory for "when, where and what": Short‐delay retrieval using dynamic naturalistic material. Human Brain Mapping, 36(7), 2495–2513. 10.1002/hbm.22787 [DOI] [PMC free article] [PubMed] [Google Scholar]
- Leung, H.‐C. , Oh, H. , Ferri, J. , & Yi, Y. (2007). Load response functions in the human spatial working memory circuit during location memory updating. NeuroImage, 35(1), 368–377. 10.1016/j.neuroimage.2006.12.012 [DOI] [PubMed] [Google Scholar]
- Leung, H.‐C. , Seelig, D. , & Gore, J. C. (2004). The effect of memory load on cortical activity in the spatial working memory circuit. Cognitive, Affective, & Behavioral Neuroscience, 4(4), 553–563. [DOI] [PubMed] [Google Scholar]
- Magen, H. , Emmanouil, T.‐A. , McMains, S. A. , Kastner, S. , & Treisman, A. (2009). Attentional demands predict short‐term memory load response in posterior parietal cortex. Neuropsychologia, 47(8–9), 1790–1798. 10.1016/j.neuropsychologia.2009.02.015 [DOI] [PMC free article] [PubMed] [Google Scholar]
- Maris, E. , & Oostenveld, R. (2007). Nonparametric statistical testing of EEG‐ and MEG‐data. Journal of Neuroscience Methods, 164(1), 177–190. 10.1016/j.jneumeth.2007.03.024 [DOI] [PubMed] [Google Scholar]
- Medendorp, W. P. , Kramer, G. F. I. , Jensen, O. , Oostenveld, R. , Schoffelen, J.‐M. , & Fries, P. (2007). Oscillatory activity in human parietal and occipital cortex shows hemispheric lateralization and memory effects in a delayed double‐step saccade task. Cerebral Cortex, 17(10), 2364–2374. 10.1093/cercor/bhl145 [DOI] [PubMed] [Google Scholar]
- Nagel, I. E. , Preuschhof, C. , Li, S.‐C. , Nyberg, L. , Bäckman, L. , Lindenberger, U. , & Heekeren, H. R. (2009). Performance level modulates adult age differences in brain activation during spatial working memory. Proceedings of the National Academy of Sciences of the United States of America, 106(52), 22552–22557. 10.1073/pnas.0908238106 [DOI] [PMC free article] [PubMed] [Google Scholar]
- Nee, D. E. , Brown, J. W. , Askren, M. K. , Berman, M. G. , Demiralp, E. , Krawitz, A. , & Jonides, J. (2013). A meta‐analysis of executive components of working memory. Cerebral Cortex, 23(2), 264–282. 10.1093/cercor/bhs007 [DOI] [PMC free article] [PubMed] [Google Scholar]
- Owen, A. M. (2000). The role of the lateral frontal cortex in mnemonic processing: The contribution of functional neuroimaging. Experimental Brain Research, 133(1), 33–43. 10.1007/s002210000398 [DOI] [PubMed] [Google Scholar]
- Owen, A. M. , Herrod, N. J. , Menon, D. K. , Clark, J. C. , Downey, S. P. , Carpenter, T. A. , … Pickard, J. D. (1999). Redefining the functional organization of working memory processes within human lateral prefrontal cortex. The European Journal of Neuroscience, 11(2), 567–574. [DOI] [PubMed] [Google Scholar]
- Owen, A. M. , McMillan, K. M. , Laird, A. R. , & Bullmore, E. (2005). N‐back working memory paradigm: A meta‐analysis of normative functional neuroimaging studies. Human Brain Mapping, 25(1), 46–59. 10.1002/hbm.20131 [DOI] [PMC free article] [PubMed] [Google Scholar]
- Park, H. , Kang, E. , Kang, H. , Kim, J. S. , Jensen, O. , Chung, C. K. , & Lee, D. S. (2011). Cross‐frequency power correlations reveal the right superior temporal gyrus as a hub region during working memory maintenance. Brain Connectivity, 1(6), 460–472. 10.1089/brain.2011.0046 [DOI] [PubMed] [Google Scholar]
- Proskovec, A. L. , Heinrichs‐Graham, E. , & Wilson, T. W. (2016). Aging modulates the oscillatory dynamics underlying successful working memory encoding and maintenance. Human Brain Mapping, 37, 2348–2361. 10.1002/hbm.23178 [DOI] [PMC free article] [PubMed] [Google Scholar]
- Proskovec, A. L. , Wiesman, A. I. , Heinrichs‐Graham, E. , & Wilson, T. W. (2018). Beta oscillatory dynamics in the prefrontal and superior temporal cortices predict spatial working memory performance. Scientific Reports, 8(1), 8488 10.1038/s41598-018-26863-x [DOI] [PMC free article] [PubMed] [Google Scholar]
- Raabe, M. , Fischer, V. , Bernhardt, D. , & Greenlee, M. W. (2013). Neural correlates of spatial working memory load in a delayed match‐to‐sample saccade task. NeuroImage, 71, 84–91. 10.1016/j.neuroimage.2013.01.002 [DOI] [PubMed] [Google Scholar]
- Reuter‐Lorenz, P. A. , & Cappell, K. A. (2008). Neurocognitive aging and the compensation hypothesis. Current Directions in Psychological Science, 17(3), 177–182. 10.1111/j.1467-8721.2008.00570.x [DOI] [Google Scholar]
- Rizzolatti, G. , & Matelli, M. (2003). Two different streams form the dorsal visual system: Anatomy and functions. Experimental Brain Research, 153(2), 146–157. 10.1007/s00221-003-1588-0 [DOI] [PubMed] [Google Scholar]
- Rottschy, C. , Caspers, S. , Roski, C. , Reetz, K. , Dogan, I. , Schulz, J. B. , … Eickhoff, S. B. (2013). Differentiated parietal connectivity of frontal regions for "what" and "where" memory. Brain Structure & Function, 218(6), 1551–1567. 10.1007/s00429-012-0476-4 [DOI] [PMC free article] [PubMed] [Google Scholar]
- Rottschy, C. , Langner, R. , Dogan, I. , Reetz, K. , Laird, A. R. , Schulz, J. B. , … Eickhoff, S. B. (2012). Modelling neural correlates of working memory: A coordinate‐based meta‐analysis. NeuroImage, 60(1), 830–846. 10.1016/j.neuroimage.2011.11.050 [DOI] [PMC free article] [PubMed] [Google Scholar]
- Roux, F. , Wibral, M. , Mohr, H. M. , Singer, W. , & Uhlhaas, P. J. (2012). Gamma‐band activity in human prefrontal cortex codes for the number of relevant items maintained in working memory. The Journal of Neuroscience, 32(36), 12411–12420. 10.1523/JNEUROSCI.0421-12.2012 [DOI] [PMC free article] [PubMed] [Google Scholar]
- Sakai, K. , Rowe, J. B. , & Passingham, R. E. (2002). Active maintenance in prefrontal area 46 creates distractor‐resistant memory. Nature Neuroscience, 5(5), 479–484. 10.1038/nn846 [DOI] [PubMed] [Google Scholar]
- Srimal, R. , & Curtis, C. E. (2008). Persistent neural activity during the maintenance of spatial position in working memory. NeuroImage, 39(1), 455–468. 10.1016/j.neuroimage.2007.08.040 [DOI] [PMC free article] [PubMed] [Google Scholar]
- Taulu, S. , & Simola, J. (2006). Spatiotemporal signal space separation method for rejecting nearby interference in MEG measurements. Physics in Medicine and Biology, 51(7), 1759–1768. 10.1088/0031-9155/51/7/008 [DOI] [PubMed] [Google Scholar]
- Taulu, S. , Simola, J. , & Kajola, M. (2005). Applications of the signal space separation method. IEEE Transactions on Signal Processing, 53(9), 3359–3372. 10.1109/TSP.2005.853302 [DOI] [Google Scholar]
- Todd, J. J. , & Marois, R. (2004). Capacity limit of visual short‐term memory in human posterior parietal cortex. Nature, 428(6984), 751–754. 10.1038/nature02466 [DOI] [PubMed] [Google Scholar]
- Toepper, M. , Gebhardt, H. , Bauer, E. , Haberkamp, A. , Beblo, T. , Gallhofer, B. , … Sammer, G. (2014). The impact of age on load‐related dorsolateral prefrontal cortex activation. Frontiers in Aging Neuroscience, 6, 9 10.3389/fnagi.2014.00009 [DOI] [PMC free article] [PubMed] [Google Scholar]
- Uusitalo, M. A. , & Ilmoniemi, R. J. (1997). Signal‐space projection method for separating MEG or EEG into components. Medical & Biological Engineering & Computing, 35(2), 135–140. [DOI] [PubMed] [Google Scholar]
- Wager, T. D. , & Smith, E. E. (2003). Neuroimaging studies of working memory: A meta‐analysis. Cognitive, Affective, & Behavioral Neuroscience, 3(4), 255–274. [DOI] [PubMed] [Google Scholar]
Associated Data
This section collects any data citations, data availability statements, or supplementary materials included in this article.
Supplementary Materials
Figure S1 Time‐frequency spectrograms with time (s) shown on the x‐axis and frequency (Hz) denoted on the y‐axis. For each gradiometer in the sensor array, percent power change was computed for each time‐frequency bin relative to the respective bin's baseline power (−0.4 to 0.0 s) for frequencies ranging from 4 to 90 Hz. Left: The spectrogram from the peak sensor, which was located near the parietal cortices. Note that this spectrogram is from the same sensor as that shown in Figure 2 of the main text; the only difference is that the y‐axis is expressed all the way to 90 Hz (Figure 2 stops at 30 Hz to highlight the response). Significant decreases in alpha (8–11 Hz) and beta (15–20 Hz) activity spanned from 0.4 s to 4.0 s. These significant responses were observed in multiple sensors located near occipital, parietal, and temporal regions (see 2D sensor map included in Figure 2 of the main text). Right: A grand average spectrogram is shown. This spectrogram was computed by collapsing across all sensors in which the significant responses of interest were observed (see 2D sensor map included in Figure 2 of the main text). Relative to the peak sensor spectrogram, the alpha and beta responses shown in the grand average spectrogram were of reduced magnitude (note the color scale bar change). This, of course, was to be expected, as the peak sensor was that in which these responses were of greatest magnitude, whereas the grand average was the average of all sensors in which these responses were significant but of varying magnitudes. Importantly, the responses shown in the peak and grand average spectrograms were remarkably similar with regards to direction, frequency, and temporal characteristics. Thus, these data demonstrate that the peak sensor spectrogram provided an accurate representation of the data at large.
Data Availability Statement
The data that support the findings of this study are available from the corresponding author upon reasonable request.