

Abstract
Hippocampal atrophy is one of the main hallmarks of Alzheimer's disease (AD). However, there is still controversy about whether this sign is a robust finding during the early stages of the disease, such as in mild cognitive impairment (MCI) and subjective cognitive decline (SCD). Considering this background, we proposed a new marker for assessing hippocampal atrophy: the local surface roughness (LSR). We tested this marker in a sample of 307 subjects (normal control (NC) = 70, SCD = 87, MCI = 137, AD = 13). In addition, 97 patients with MCI were followed‐up over a 3‐year period and classified as stable MCI (sMCI) (n = 61) or progressive MCI (pMCI) (n = 36). We did not find significant differences using traditional markers, such as normalized hippocampal volumes (NHV), between the NC and SCD groups or between the sMCI and pMCI groups. However, with LSR we found significant differences between the sMCI and pMCI groups and a better ability to discriminate between NC and SCD. The classification accuracy of the LSR for NC and SCD was 68.2%, while NHV had a 57.2% accuracy. In addition, the classification accuracy of the LSR for sMCI and pMCI was 74.3%, and NHV had a 68.3% accuracy. Cox proportional hazards models adjusted for age, sex, and education were used to estimate the relative hazard of progression from MCI to AD based on hippocampal markers and conversion times. The LSR marker showed better prediction of conversion to AD than NHV. These results suggest the relevance of considering the LSR as a new hippocampal marker for the AD continuum.
Keywords: Alzheimer's disease continuum, hippocampal biomarkers, hippocampal segmentation, local surface roughness, progression to AD
1. INTRODUCTION
The study of the hippocampus is a relevant area of interest because it is one of the first structures that is affected early in Alzheimer's disease (AD) pathology (Jack et al., 2004). Different T1‐weighted magnetic resonance imaging (MRI) measurements of the hippocampus (e.g., volume) are useful markers for the diagnosis of prodromal AD, such as mild cognitive impairment (MCI) (Dubois et al., 2007; Frisoni, Fox, Jack, Scheltens, & Thompson, 2010). In fact, the hippocampal volume has been proposed as a biomarker of neuronal injury to establish the diagnosis of AD (Chupin et al., 2009; Cuingnet et al., 2011; Dubois et al., 2007; Leung et al., 2010). However, it has been reported that this biomarker can distinguish between AD subjects and normal controls (NC) with accuracy of 75%, based on an analysis of the entire Alzheimer's Disease Neuroimaging Initiative (ADNI) database (Cuingnet et al., 2011). In a longitudinal study based on 568 images from the ADNI dataset, Wolz et al. (2010) reported a correct classification rate of 82% for NC versus AD subjects using hippocampal volumes. This limited capability to classify AD patients using only the whole hippocampal volume may be due to simplification of the atrophic patterns to a global measurement and to the discrepancies caused by manual protocols. Notwithstanding, volumetric analyses of the hippocampus as a whole do not provide information about the precise locations of the morphological changes that characterize and occur during the progression of AD within this structure.
For this reason, several approaches based on hippocampal shape analysis have recently been proposed (Chételat et al., 2008; Csernansky et al., 2005; La Joie et al., 2010; Perrotin et al., 2015). These methods attempt to capture detailed hippocampal structural modifications to obtain a more accurate classification. In fact, these techniques based on shape analysis (Gerardin et al., 2009) have yielded slightly better classifications than procedures that are focused on volumetric measures alone (Cuingnet et al., 2011). Furthermore, shape analysis approaches have allowed the identification of atrophic regions in the hippocampus when comparing elderly controls and patients with MCI or AD, contributing to better prediction of the progression of the AD (Csernansky et al., 2005; Gutman, Wang, Morra, Toga, & Thompson, 2009; Kim, Valdes‐Hernandez, Royle, & Park, 2015).
A promising method for segmenting subfields of the hippocampus has recently emerged (De Flores et al., 2015; Iglesias et al., 2015; Khan et al., 2015; Yushkevich et al., 2015). This approach is potentially able to detect atrophic patterns in more detail. However, it requires a high‐resolution MRI, which has not been implemented in standard clinical practice yet; thus, its application is restricted. Therefore, the development of new methods that are able to detect subtle anatomical modifications of the hippocampus are critical for obtaining a better classification rate.
Although hippocampal volume has been evaluated as a measure for discriminating between symptomatic predementia (MCI) or dementia (AD) and healthy aging, in subjective cognitive decline (SCD) (Jessen et al., 2014; Reisberg, Shulman, Torossian, Leng, & Zhu, 2010), hippocampal volume is insufficiently sensitive for distinguishing between SCD and NC subjects. Few studies have described hippocampal atrophy in subjects with SCD compared with controls (Saykin et al., 2006; Scheef et al., 2012). Using a semi‐automated surface‐based approach, Tepest et al., (2008) observed patterns of hippocampal surface deformation that were preferentially located in the area of the CA1 subfield in SCD, MCI, and AD subjects, but there were no significant differences between SCD subjects and healthy controls. In addition, some studies that have explored hippocampal differences between those MCI subjects who remained stable after a follow‐up period (stable MCI, sMCI) and those who finally developed AD (progressive MCI, pMCI) have found differences in the left hippocampal volume (Douaud et al., 2013; López et al., 2016), while others have reported no differences (López et al., 2014).
Considering this background, in the present study we focused on exploring group differences in hippocampal atrophy at different stages and conditions of the disease: (1) healthy elderly individuals and SCD and MCI subjects and (2) sMCI and pMCI subjects. For this purpose, T1‐weighted MRI images of the whole brain with typical clinical resolutions were used. The hippocampus was extracted using an automatic approach with the Harmonized Hippocampal Protocol (HarP) (Boccardi et al., 2011; Frisoni et al., 2015) (http://www.hippocampal-protocol.net). Once the left and right hippocampus were segmented, volumetric and shape analyses were performed, and a new marker was calculated from the mean curvatures in specific regions of the hippocampal surfaces. This new marker may increase the ability to discriminate between clinical groups at different stages along the AD continuum.
2. MATERIALS AND METHODS
2.1. Participants
A total of 307 subjects were included in the present study (NC = 70, SCD = 87, MCI = 137, and AD = 13). Participants were recruited from the Hospital Universitario San Carlos (Madrid, Spain), the Centre for Prevention of Cognitive Impairment (Madrid, Spain), and the Seniors Center of the district of Chamartín (Madrid, Spain). All subjects underwent an extensive neuropsychological assessment in order to explore their cognitive status (for a review of the protocol see López et al., 2016). The demographics and clinical details from the database are shown in Table 1. SCD and MCI subjects were diagnosed according to the Subjective Cognitive Decline Initiative (SCD‐I) Working Group (Jessen et al., 2014) and the National Institute on Aging‐Alzheimer Association (NIA‐AA) (Albert et al., 2011), respectively. The clinical diagnosis of MCI included the following features: (1) self‐ or informant‐reported cognitive complaints; (2) objective evidence of impairment in one or more cognitive domains; (3) preserved independence in functional abilities; and (4) not demented (McKhann et al., 2011). In addition to meeting the clinical criteria, MCI subjects showed signs of loss of the hippocampal volume compared with controls. As they fulfilled the criteria for both clinical and neuronal injury, MCI participants can be categorized as “MCI due to AD” with an intermediate likelihood (Albert et al., 2011). It should be noted that hippocampal volumes were not used to establish any of the different diagnoses that were explored, since clinical and cognitive performance were used for this purpose.
Table 1.
Demographic and clinical details of the used database
| Variable (N. subjects) | NC (70) | SCD (87) | MCI (137) | AD (13) | F | p |
|---|---|---|---|---|---|---|
| Gender male (%) | 25 (36%) | 19 (22%) | 50 (37%) | 7 (54%) | – | .037 |
| Age | 70.3 (4.5) | 71.7 (5.1) | 73.9 (5.0)a , b | 75.6 (5.0)a , b | 10.86 | <.001 |
| Years of education | 13.9 (5.5) | 12.9 (5.5) | 8.8 (4.5)a , b | 9.5 (6.4)a , b | 20.06 | <.001 |
| MMSE | 28.9 (1.2) | 28.2 (1.9) | 26.5 (2.7)a , b | 22.6 (5.5)a , b , c | 49.99 | <.001 |
| Immediate recall | 24.8 (8.2) | 20.1 (8.6)a | 6.7 (7.2)a , b | 3.2 (4.9)a , b | 111.89 | <.001 |
| Delayed recall | 40.9 ( 11.3) | 34.3 (11.1)a | 16.6 (8.9)a , b | 7.6 (7.5)a , b , c | 123.36 | <.001 |
NC = Normal control; SCD = subjective cognitive decline; MCI = mild cognitive impairment; AD = Alzheimer's disease.
Data is represented as mean and standard deviation (SD) unless specific otherwise. anova with Bonferroni post hoc test is used for age, years of education and neuropsychological scores, except for gender where the chi‐square test is used.
Significant differences compared with the NC group.
Significant differences compared with the SCD group.
Significant differences compared with the MCI group.
Additionally, 97 of the 137 MCI subjects were followed‐up for a period of 3 years to determine if they remained stable or progressed to AD. Therefore, at the end of this follow‐up period, they were split into two subgroups according to their clinical outcomes: (1) 61 sMCI subjects who met the diagnostic criteria for MCI; and (2) 36 pMCI subjects who fulfilled the criteria for probable AD according to the NIA‐AA (McKhann et al., 2011) (see Table 2).
Table 2.
Demographic and clinical details of the sMCI and pMCI subjects from the used database followed during 3 years
| Variable (N. subjects) | sMCI (61) | pMCI (36) | F | p |
|---|---|---|---|---|
| Gender male (%) | 22 (36%) | 14 (39%) | – | .781 |
| Age | 73.2 (5.2) | 75.6 (4.9) | 5.31 | .023 |
| Years of education | 8.77 (4.36) | 7.94 (4.07) | 0.87 | .353 |
| MMSE | 27.0 (2.3) | 25.8 (3.1) | 4.45 | .037 |
| Immediate recall | 7.4 (7.2) | 3.1 (6.2)a | 10.02 | .002 |
| Delayed recall | 17.5 (8.5) | 11.7 (9.1)a | 10.81 | .001 |
sMCI = stable mild cognitive impairment; pMCI = progressive mild cognitive impairment.
Data are represented as mean and standard deviation (SD) unless specific otherwise. anova was used for age, education, and neuropsychological scores, except for gender where the chi‐square test was used.
Significant differences compared with the stable MCI group.
All the participants did not have other severe medical conditions or psychiatric, medical or neurological pathologies (other than MCI or AD). The exclusion criteria were as follows: an age outside of the range of 65–85 years, a modified Hachinski score ≥4 (Rosen, Terry, Fuld, Katzman, & Peck, 1980), a geriatric depression scale immediate recall score ≥5 (Yesavage et al., 1982), and a T2‐weighted MRI performed within 12 months before the clinical evaluation with indications of infection, infarction or focal lesions.
The study was approved by the local ethics committee, and all subjects or their legal representatives signed an informed consent that explained the technical and ethical considerations of the investigation.
2.2. MRI acquisition
3D T1‐weighted scans were performed with a General Electric 1.5‐T magnetic resonance scanner, using a high resolution antenna and a homogenization PURE filter [Fast Spoiled Gradient Echo (FSPGR) sequence with the following parameters: TR/TE/TI = 11.2/4.2/450 ms, flip angle 12°, 1 mm slice thickness, 256 × 256 matrix, and FOV 25 cm).
2.3. Segmentation method
We have recently proposed a fast label fusion method for segmenting anatomical structures, such as the hippocampus, with low intensity contrast using T1‐weighted MRI images (Platero & Tobar, 2015, 2017). The approach was based on a patch‐based labeling method combined with atlas‐warping using nonrigid registrations. The proposed segmentation scheme involved the following principal steps: (1) MRI preprocessing; (2) spatial normalization; (3) first labeling based on atlas‐warping using nonrigid registration; and (4) final patch‐based labeling based on similarity measures in intensity and labeling.
During preprocessing of the MR images, nonbrain regions were removed, and intracranial volumes were estimated. Removing nonbrain tissue prior to registration is generally accepted to simplify the inter‐subject registration problem and thus increase the quality of the registrations (Battaglini, Smith, Brogi, & De Stefano, 2008; Klein et al., 2009). The images were skull‐stripped using Brain Extraction Tool (BET) (Smith, 2002). To improve the results of BET, we followed the protocol proposed by Stein et al. (2012). First, a coarse skull‐stripping was performed, and then, the bias field correction was calculated and applied to the image. Finally, the corrected images were reapplied with BET, and all of them were spatially normalized to the same stereotactic space (Evans, Janke, Collins, & Baillet, 2012). The MNI‐152 template (Evans et al., 2012) was selected as a reference for coregistering the images with an affine transformation using FMRIB's Linear Image Registration Tool (FLIRT) with 12° of freedom (Jenkinson, Bannister, Brady, & Smith, 2002). The intracranial volume (ICV) was calculated by registration of each skull‐stripped MRI to the MNI‐152 template using the same affine transformation (Buckner et al., 2004).
A set of atlases were built using the HarP annotations on 134 images from the ADNI database (Boccardi et al., 2011; Frisoni et al., 2015). The atlases were normalized to the MNI‐152 space and then, a subset of normalized atlases was nonrigidly registered to the normalized subject image. Next, the registered atlases were fused, and the labeling was calculated using graph cuts based on minimizing an energy function (Platero & Tobar, 2015). Then, a patch‐based labeling method was applied; the patches and weights for this method were computed with a combination of similarity measures between patches using intensity‐based distances and labeling‐based distances (Platero & Tobar, 2017). The labeling distances were calculated from the previous segmentation of the target image by means of atlas‐warping using nonrigid registrations. The average computational time for hippocampal segmentation from a T1‐weighted MRI was less than 17 min (see more details in Supporting Information Materials).
2.4. Markers
The markers were extracted from the automated hippocampal segmentations and were used to characterize four clinical groups: NC, SCD, MCI, and AD. The following markers were used to discriminate among the groups: normalized hippocampal volume, hippocampal surface roughness and a new marker called local surface roughness (LSR). We explored these measures because recent studies have shown that a decrease in hippocampal volume and an increase in surface roughness are good markers for the progression of AD (Kim et al., 2015). Moreover, the values of these features are scalar, showing higher robustness for generalization and avoiding overfitting when the size of the samples is limited.
2.4.1. Volume
We first tested the classification accuracy using the hippocampal volume which was normalized by the total ICV. This kind of normalization reduces the variability in the volume measurements of nearly all brain regions (Keihaninejad et al., 2010). Compared with other commonly used constants, ICV is less vulnerable to pathological changes (Pengas, Pereira, Williams, & Nestor, 2009). For more robustness in terms of hippocampal segmentation errors, both left and right volumes were averaged and normalized with ICV. This marker was called the normalized hippocampal volume (NHV).
2.4.2. Surface roughness
We used the surface roughness (SR) of the hippocampus as a marker to detect significant differences among the groups (Kim et al., 2015). The hippocampal surface roughness measures atrophy associated with the progression of AD using a single scan. The surface roughness was calculated using the mean curvature as follows:
where, n is the number of the voxels belonging to the hippocampal surface, and K(x i) is the mean curvature at each voxel x i. These voxels were extracted from the automated hippocampal segmentation in the standard space, that is, K(x i) was calculated with the isotropic spacing (1 × 1 × 1 mm3 from the MNI 152 domain). The left and right hippocampal segmentations were embedded in a level set formulation, and the mean curvature was estimated using the following equation:
where, Γ = {x|φ(x) = 0} is the hippocampal surface, and φ(x) is a signed distance function, which assigns positive distances to the inside of the object and negative distances to the outside (Osher & Fedkiw, 2006). The estimation of the mean curvature on each x i was controlled using Gaussian derivatives. In our experiments, a Gaussian kernel of 5 mm FWHM was applied to the images to calculate the mean curvatures. This parameter was tuned by maximizing the discrimination capacity of the SR biomarker between NC and AD populations. For more robustness in terms of segmentation errors, the left and right surface roughness was averaged to determine the shape marker.
2.4.3. Local surface roughness
A new marker based on the statistical significance maps between two clinical groups being compared from the mean curvature measures was introduced. With the normalized mean curvature maps of all participants, which were generated using volume‐to‐volume correspondence into a template (Heimann & Meinzer, 2009) and for each voxel belonging to the hippocampal surface, the statistical significance between two groups being compared was estimated via permutation tests (Pantazis, Leahy, Nichols, & Styner, 2004). Group differences were assessed using the Wilcoxon signed‐rank test, which does not require normality of the data. We defined LSR as a measurement of the SR on local regions of the hippocampal surface, which exhibited significant differences when two groups of subjects were compared.
The NHV or SR markers were based on the hippocampal segmentation. The LSR marker also requires statistical significance maps between two clinical groups, that is, this atrophy measure is not unique for a given hippocampal segmentation.
Let X = {xi|αk,l(xi) < αth} be the set of voxels of the hippocampal surface with significant differences in the measures of their mean curvatures between the k and l clinical groups, where αk,l(xi) is the p‐value in the i‐voxel for comparing its measures between the subjects belonging to the k and l clinical groups and αth is the threshold of statistical significance, then
2.5. Statistical analysis
The effects of demographics and clinical measurements were tested using anova with Bonferroni post hoc comparisons for continuous variables, while categorical variables were analyzed using the Chi‐square test. The hippocampal markers were first analyzed using mancova and Bonferroni corrections by adopting a general linear model procedure, adjusting for age and years of education as covariates. Bonferroni pairwise comparisons were performed to determine hippocampal marker differences between the groups. Homoscedasticity, normality and independence were verified in all the tests of analysis of variance. Statistical analysis was performed using SPSS v. 22.
The hippocampal markers were subsequently analyzed using linear discrimination, which fits a normal density to each group, with a pooled estimate of covariance. The use of a simple, linear classifier ensured that the classification accuracy was primarily determined by the quality of the input data rather than by stochastic variations in the classifier.
For each comparison between two clinical groups, we computed the sensitivity (SEN), the specificity (SPE) and the accuracy value (ACC) (Cuingnet et al., 2011). Note that the number of subjects in each group was not exactly the same. The classification accuracy did not enable comparisons of the performances between the different classification experiments. Instead, we considered both the specificity and the sensitivity.
Receiver operating characteristic (ROC) curves were calculated for each hippocampal marker and for each group pairwise comparison. The discriminant value of the corresponding ROC curve was estimated using the area under curve (AUC). DeLong's test was applied to compare the AUCs between methods (DeLong, DeLong, & Clarke‐Pearson, 1998).
A resampling approach was used to evaluate the statistical maps and classification rate between pairs of clinical groups. A nested cross‐validation (CV) procedure is used to avoid model overfitting and optimistically‐biased estimates of model performance (Korolev, Symonds, Bozoki, & Alzheimer's Disease Neuroimaging Initiative, 2016). The procedure consisted of two nested CV loops: an inner loop, designed to generate statistical maps and to train classifiers, and an outer loop, designed to obtain an unbiased estimate of linear discrimination model performance. Therefore, our approach, which relies on statistical maps of LSR markers, avoids double‐dipping by excluding the samples belonging to the test subjects in the designs of the statistical maps and classifiers. Both the outer and inner CV loops used a k‐fold CV design. For better replicability, the nested k‐fold CV procedure was repeated with different partitions of the data, generating multiple performance estimate values. The classification scores and confidence interval for the different groups are displayed in Table 5 after 5,000 runs.
Table 5.
Results of the classifications between groups of patients with different diagnosis using the normalized hippocampal volume (NHV), surface roughness (SR), and local surface roughness (LSR)
| Groups | Marker | SEN (%) | SPE (%) | ACC (%) | AUC |
|---|---|---|---|---|---|
| NC vs. SCD | NHV | 57.4 (57.1–57.6) | 57.1 (56.8–57.4) | 57.2 (57.0–57.4) | 0.589 (0.587–0.591) |
| SR | 57.3 (54.0–54.6) | 55.8 (55.4–56.1) | 55.0 (54.8–55.2) | 0.581 (0.579–0.583) | |
| LSR | 63.5 (63.2–63.8) | 74.1 (73.8–74.4) | 68.2 (68.1–68.4) | 0.770 (0.768–0.772)a , b | |
| NC vs. MCI | NHV | 68.6 (68.4–68.8) | 73.6 (73.4–73.9) | 70.3 (70.1–70.5) | 0.772 (0.771–0.774) |
| SR | 66.9 (66.6–67.1) | 80.9 (80.7–81.2) | 71.7 (71.5–71.8) | 0.791 (0.790–0.793) | |
| LSR | 68.8 (68.6–69.0) | 82.6 (82.4–82.9) | 73.5 (73.3–73.6) | 0.804 (0.803–0.806) | |
| NC vs. AD | NHV | 84.4 (83.8–85.0) | 81.8 (81.5–82.0) | 82.2 (82.0–82.4) | 0.923 (0.920–0.926) |
| SR | 83.7 (83.1–84.3) | 88.4 (88.2–88.6) | 87.6 (87.4–87.7) | 0.961 (0.959–0.962) | |
| LSR | 71.9 (71.2–72.7) | 89.6 (89.4–89.7) | 86.8 (86.7–87.0) | 0.942 (0.940–0.944) | |
| SCD vs. MCI | NHV | 63.7 (63.5–63.9) | 67.3 (67.0–67.5) | 65.1 (64.9–65.2) | 0.693 (0.692–0.695) |
| SR | 59.8 (59.5–60.0) | 69.6 (69.3–69.8) | 63.6 (63.4–63.7) | 0.707 (0.705–0.709) | |
| LSR | 64.6 (64.4–64.9) | 70.8 (70.5–71.1) | 67.0 (66.9–67.2) | 0.734 (0.732–0.735) | |
| SCD vs. AD | NHV | 84.6 (84.1–85.2) | 76.7 (76.5–77.0) | 77.8 (77.6–78.0) | 0.856 (0.852–0.859) |
| SR | 77.6 (76.9–78.3) | 80.8 (80.6–81.1) | 80.4 (80.2–80.6) | 0.882 (0.880–0.884) | |
| LSR | 70.7 (69.9–71.4) | 80.2 (79.9–80.4) | 78.9 (78.7–79.1) | 0.853 (0.850–0.856) | |
| sMCI vs. pMCI | NHV | 68.1 (67.7–68.5) | 68.4 (68.1–68.8) | 68.3 (68.1–68.5) | 0.754 (0.752–0.757) |
| SR | 67.5 (67.0–67.9) | 68.5 (68.3–68.8) | 68.1 (67.9–68.3) | 0.755 (0.753–0.757) | |
| LSR | 77.4 (77.0–77.9) | 72.3 (72.0–72.6) | 74.3 (74.1–74.5) | 0.831 (0.829–0.833)a , b | |
| sMCI vs. AD | NHV | 79.4 (78.7–80.1) | 67.8 (67.5–68.2) | 69.9 (69.6–70.2) | 0.755 (0.752–0.759) |
| SR | 66.5 (65.7–67.2) | 71.5 (71.2–71.9) | 70.6 (70.3–70.9) | 0.750 (0.747–0.753) | |
| LSR | 84.0 (83.5–84.6) | 80.5 (80.2–80.8) | 81.2 (80.9–81.4) | 0.873 (0.870–0.875)a , b | |
| pMCI vs. AD | NHV | 35.6 (34.9–36.6) | 46.8 (46.4–47.3) | 43.6 (43.3–43.9) | 0.375 (0.371–0.378) |
| SR | 32.9 (32.2–33.6) | 54.7 (54.2–55.2) | 48.8 (48.5–49.2) | 0.404 (0.399–0.408) | |
| LSR | 70.0 (69.3–70.7) | 73.0 (72.6–73.4) | 72.1 (71.8–72.4) | 0.775 (0.771–0.780)a , b |
NC = Normal control; SCD = subjective cognitive decline; MCI = mild cognitive impairment; AD = Alzheimer's disease; sMCI = stable mild cognitive impairment; pMCI = progressive mild cognitive impairment; SEN = sensitivity; SPE = specificity; ACC = accuracy; AUC = area under curve.
Confidence intervals are presented within parenthesis.
Significant differences compared with NHV.
Significant differences compared with SR. The p‐value of paired DeLong's test is used for calculating the significant differences between markers (p < .001).
3. RESULTS
3.1. Demographic and cognitive results
The cognitive measurements applied (i.e., MMSE; Folstein, Folstein, & McHugh, 1975) and immediate and delayed recall (Wechsler Memory Scale III, WMS‐III; Wechsler, 1997); indicated that cognitive scores were the lowest in the AD group and the highest in the control group (see Table 1). No significant differences in MMSE scores were observed between NC and SCD subjects, but there were significant differences in both episodic memory measurements between these groups. Additionally, SCD subjects had statistically higher scores on the MMSE and immediate and delayed recall than MCI and AD subjects, while there were only differences in MMSE scores and delayed recall between MCI and AD subjects.
After the 3‐year follow‐up period involving 97 patients with MCI, no significant differences in age, gender, years of education and MMSE score were observed between sMCI and pMCI subjects. However, pMCI subjects had significantly lower scores in immediate and delayed recall than sMCI subjects (see Table 2) (see more details in Supporting Information Materials).
3.2. Hippocampal markers
An analysis of the variance of hippocampal markers was carried out in relation to all the clinical groups (Table 3 and Figure 1). Unlike NHV or SR measurements of the hippocampus, LSR marker depended on the statistical significance map between pairs of groups. To proceed with this analysis, we used the threshold map defined in the comparison between the NC and MCI groups to set the LSR measurement, which is denoted as LSR*. This prevented a stratified analysis between pairs of clinical groups. mancova with Bonferroni pairwise comparisons were used to analyze the markers. Age and years of education were used as covariates. No significant differences were found in ICV values. Comparisons of the hippocampal markers were significant across all groups (p < .001). However, multiple comparisons showed different results in the pairwise comparison. The LSR marker was the most discriminative (F = 26.07, p < .001), with significant differences between the NC and MCI groups, the NC and AD groups, the SCD and MCI groups, the SCD and AD groups and the MCI and AD groups. Worse results were obtained with SR (F = 19.65, p < .001). For the volume markers, no significant differences were observed between the MCI and AD groups. The raw volumetric measures, that is, the left and right hippocampal volumes, and the normalized hippocampal volume revealed significant differences between the NC and MCI groups, the NC and AD groups, the SCD and MCI groups and the SCD and AD groups.
Table 3.
The normalized volume was scaled using intracranial volume (ICV) in cm3
| Variable (N. subjects) | NC (70) | SCD (87) | MCI (137) | AD (13) | F | p |
|---|---|---|---|---|---|---|
| ICV (cm3) | 1,456 (144) | 1,406 (145) | 1,402 (145) | 1,401 (163) | 1.30 | .274 |
| LH (mm3) | 2,810 (348) | 2,651 (303) | 2,466 (383)a , b | 2,209 (326)a , b | 10.57 | <.001 |
| RH (mm3) | 2,909 (323) | 2,729 (371) | 2,526 (382)a , b | 2,356 (387)a , b | 9.63 | <.001 |
| NHV | 3.93 (0.31) | 3.83 (0.37) | 3.57 (0.44)a , b | 3.27 (0.37)a , b | 16.28 | <.001 |
| SR | 0.322 (0.011) | 0.326 (0.013) | 0.337 (0.017)a , b | 0.348 (0.017)a , b , c | 19.65 | <.001 |
| LSR* | 0.331 (0.014) | 0.339 (0.018) | 0.354 (0.022)a , b | 0.370 (0.020)a , b , c | 26.07 | <.001 |
LH = left hippocampus; RH = right hippocampus; NHV = normalized hippocampal volume; SR = surface roughness; LSR = local surface roughness; NC = Normal control; SCD = subjective cognitive decline; MCI = mild cognitive impairment; AD = Alzheimer's disease.
Data is represented as mean and standard deviation (SD). mancova with Bonferroni pairwise comparisons are used for analyzing the different markers. Age and years of education are used as covariates. LSR* means that this measurement is based on using the threshold map of statistical significance between the NC vs. MCI groups.
Significant differences compared with normal control.
Significant differences compared with subjective cognitive decline.
Significant differences compared with mild cognitive impairment.
Figure 1.
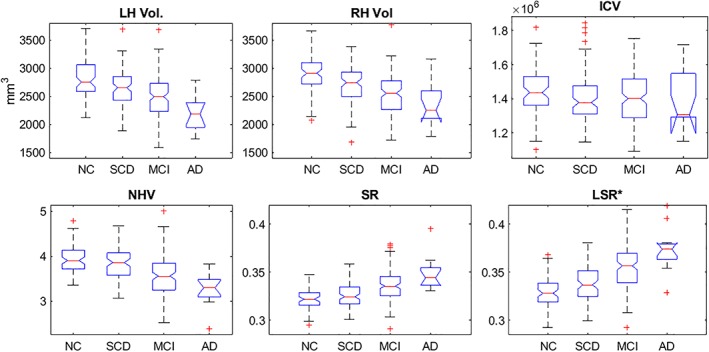
The first row shows the left and right hippocampal volume distribution and the ICV using the proposed method. The second row illustrates the hippocampal markers of the progression of AD using the proposed method. LSR* indicates that this measurement is based on the thresholded map of statistical significance between the NC versus MCI groups. ICV = intracranial volume; LH = left hippocampus; RH = right hippocampus; NHV = normalized hippocampal volume; SR = surface roughness; LSR = local surface roughness; NC = normal control; SCD = subjective cognitive decline; MCI = mild cognitive impairment; AD = Alzheimer's disease
Table 4 and Figure 2 show the hippocampal markers between the sMCI and pMCI groups. mancova was used for analyzing the markers. Age and education were used as covariates. No significant differences were found in ICV or in left and right hippocampal volumes. The LSR marker was the most discriminative of all of the markers (F = 34.62, p < .001). Significant differences were also observed between sMCI and pMCI subjects using the NHV (F = 15.09, p < .001) and SR (F = 13.892, p < .001) markers.
Table 4.
Marker details of the sMCI and pMCIs subjects followed during 3 years
| Variable (number of subjects) | sMCI (61) | pMCI (36) | F | p |
|---|---|---|---|---|
| ICV (cm3) | 1,392 (141) | 1,397 (155) | 0.16 | .690 |
| LH (mm3) | 2,522 (405) | 2,251 (378) | 8.0 | .006 |
| RH (mm3) | 2,584 (399) | 2,332 (373) | 6.59 | .012 |
| NHV | 3.67 (0.48) | 3.29 (0.36)a | 15.09 | <.001 |
| SR | 0.337 (0.017) | 0.346 (0.014)a | 13.89 | <.001 |
| LSR | 0.351 (0.027) | 0.377 (0.019)a | 34.62 | <.001 |
LH = left hippocampus; RH = right hippocampus; NHV = normalized hippocampal volume; SR = surface roughness; LSR = local surface roughness; sMCI = stable mild cognitive impairment; pMCI = progressive mild cognitive impairment.
The normalized volume is scaled using intracranial volume (ICV) in cm3. Data are represented as mean and standard deviation (SD). mancova is used for analyzing the markers. Age and education are used as covariates.
Significant differences compared with sMCI.
Figure 2.
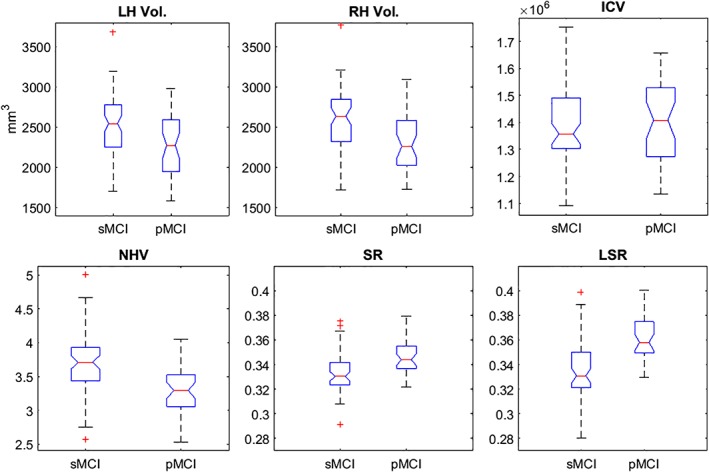
The first row shows the left and right hippocampal volume distribution and ICV for images of the sMCI and pMCI subjects. The second row illustrates the hippocampal markers (NHV = normalized hippocampal volume; SR = surface roughness; LSR = local surface roughness) in both groups. In both cases, we used the proposed method. sMCI = stable mild cognitive impairment; pMCI = progressive mild cognitive impairment
3.3. Classification results
A resampling approach was used to determine the robustness of all the linear classification models. Left and right hippocampal volumes were not considered markers in the final classification because they showed less reliability than the NHV marker.
To control for the effects of age on the hippocampal markers, they were corrected using linear regression models (Dukart, Schroeter, Mueller, & The Alzheimer's Disease Neuroimaging Initiative, 2011). The control group alone was used to estimate the age‐related effect. Then, the markers were corrected for age and the corresponding linear model.
The results of the classification are summarized in Table 5 and in Figure 3. For each group pairwise comparison, the following guidelines were observed: a) the highest scores were obtained between those groups that were more distant in the AD continuum (i.e., NC and AD subjects), and b) the classification scores of the LSR marker were generally higher than the scores of the NHV and SR markers.
Figure 3.
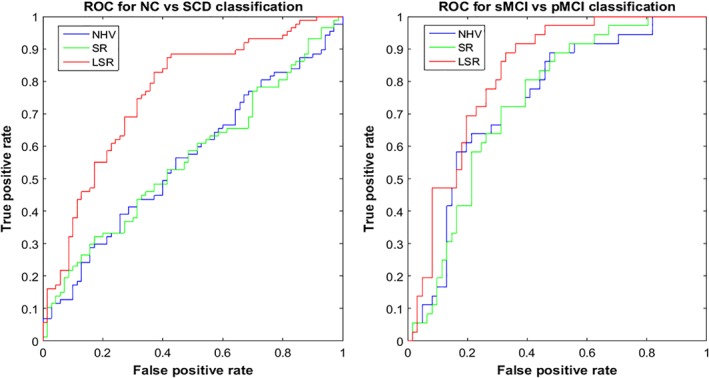
The left graph shows an ROC curve for NC versus SCD classification using the hippocampal markers (NHV = normalized hippocampal volume; SR = surface roughness; LSR = local surface roughness), and the right graph illustrates an ROC curve for sMCI versus pMCI classification using the hippocampal markers. NC = normal control; SCD = subjective cognitive decline; sMCI = stable mild cognitive impairment; pMCI = progressive mild cognitive impairment
The results for NC versus SCD showed that the LSR marker had the highest classification accuracy of 68.2% (sensitivity = 63.5%, specificity = 74.1%, AUC = 0.770) compared with the NHV or SR markers (see Table 5). Moreover, the AUC of the LSR marker showed significant improvements compared with the AUCs of the NHV and SR markers. In the comparison between NC and MCI patients, the LSR marker yielded the highest classification accuracy of 73.5% compared with the other two markers (sensitivity = 68.8%, specificity = 82.6%, AUC = 0.804). In terms of the comparison between sMCI and pMCI subjects, the LSR marker had the highest classification accuracy of 74.3% (sensitivity = 77.4%, specificity = 72.3%, AUC = 0.831) compared with the NHV or SR markers (see more details in Supporting Information Materials).
3.4. Follow‐up
In those MCI patients who completed the 3‐year follow‐up, Cox survival analyses were conducted. The Cox proportional hazards model is a very flexible and powerful method for demonstrating that atrophy on hippocampal measurements is associated with an increased risk of progression to AD (Desikan et al., 2009; Devanand et al., 2007; Sabuncu, Bernal‐Rusiel, Reuter, Greve, & Fischl, 2014; Vemuri et al., 2011).
A set of univariate and multivariable Cox models were used. The first Cox model for each hippocampal measure was crude. The second multivariable model was adjusted for sex, age, and years of education. These variables were added to determine whether the inclusion of demographic data provided redundant or complementary information to the markers concerned with predicting progression.
In the univariate Cox models, smaller volumes and higher surface roughness of the hippocampus, such as SR and LSR, were highly significant predictors of the time to conversion to AD (see Table 6). Those subjects with MCI whose NHV markers were 1 SD below the mean of this clinical group had an increased risk of progression to AD. In contrast, when MCI patients had 1 SD above the mean value of the SR or LSR marker, these measures also showed an increased risk of AD conversion. After adjusting for sex, education, and age, in the multivariate Cox analyses, a smaller NHV remained a strong predictor, but the level of statistical significance was decreased by the inclusion of the age adjustment. However, the LSR marker remained highly significant even after controlling for age and education (hazard ratio, HR = 1.25 NHV, HR = 3.36 LSR). From these results we concluded that changes in the LSR marker were less associated with age‐related atrophy and more associated with AD‐related changes in hippocampal volume. The multivariable model reiterated the importance of including both MR imaging and demographic variables in the final model.
Table 6.
Risk of progression to AD in subjects with MCI at baseline (n = 97) using the normalized hippocampal volume (NHV), surface roughness (SR), and local surface roughness (LSR)
| Hippocampal Markers | Crude | Adjusted | ||||
|---|---|---|---|---|---|---|
| HR | 95% CI | p‐value | HR | 95% CI | p‐value | |
| NHV | 1.87 | 1.33–2.62 | .0003 | 1.25 | 0.42–2.38 | .0007 |
| SR | 1.68 | 1.24–2.28 | .0008 | 2.49 | 0.88–7.02 | .002 |
| LSR | 2.31 | 1.64–3.22 | <.0001 | 3.36 | 1.14–9.98 | <.0001 |
HR = Hazard ratio; CI = confidence intervals.
Hazard ratio based on comparing the 1 SD above and below the mean.
4. DISCUSSION
In the present study, a new marker based on the local surface roughness (LSR) of the hippocampus was presented. We showed that the capacity of discrimination of this marker was more powerful than the normalized hippocampal volume (NHV) or its surface roughness (SR) when applied during different stages of the AD continuum, such as subjective cognitive decline (SCD) or mild cognitive impairment (MCI). The hippocampus was extracted from T1‐weighted MRI images of 307 participants using an automatic approach with HarP annotation. The segmentation algorithm was based on a multiple‐atlas segmentation technique, which combined a patch‐based labeling method with atlas‐warping using nonrigid registration. The segmentation results showed that the algorithm preserved the global shape learned from the HarP annotations, smoothing the hippocampal surface and characterizing the volume and surface roughness of the different groups of subjects. The performance of the automatic hippocampal segmentation was used to robustly estimate with the mean curvature at points of the hippocampal surface. This property was applied to improve the capacity of this marker to discriminate between the clinical groups during the progression to AD. Moreover, the method allowed a fast analysis of the imaging data. The average time to perform hippocampal segmentation from a T1‐weighted MRI was less than 17 min. The scripts used in this study are available at https://www.nitrc.org/projects/lf_patches/ .
The hippocampal segmentation algorithm estimated the values of the surface roughness and normalized hippocampal volume with a high linear correlation. The classification results showed that these markers were complementary. The SR marker generally had higher specificity than the normalized hippocampal volume, while the sensitivity of the hippocampal volume was typically higher than that of the surface roughness. We considered both the procedure for estimating the mean curvature and the smoothing of the hippocampal surface obtained by the hippocampal segmentation algorithm to determine the SR marker with high reliability. Furthermore, the SR marker had a similar ability to determine the hippocampal volume and also had the advantage of providing a local analysis, which generated atrophy maps of the progression of AD. As shown in the maps of the mean curvature of each group, the atrophy patterns extended to large parts of the hippocampus, particularly in the CA1 and subiculum subfields (see more details in Supporting Information Materials). These subfields have typically been reported as the earliest and most significant atrophic regions in AD (Chételat et al., 2008; Csernansky et al., 2005; Frankó & Joly, 2013). A new marker that was based on the SR and statistical significance maps was introduced to compare two different groups. The LSR marker is a measurement of the SR based on local regions of the surface that were identified as statistically significant by a pairwise comparison.
The LSR marker was developed from the same idea reported by other authors about the massive use of anatomical structures measurements. The neurodegenerative patterns of those areas that showed greater atrophy during the progression of the disease did not correspond to predefined anatomical areas. With the popular two‐group approach, maps of statistical significance provided information about those areas (at the voxel or cluster level) of greater atrophy in two clinical groups. Subsequently, markers for predicting disease were proposed from these zones. This method has been used for diagnosing AD using cortical thickness (Dickerson et al., 2009; Landin‐Romero et al., 2017; Li et al., 2012) or shape analysis of the hippocampus obtained from the hippocampal thickness (Frankó & Joly, 2013; Kim et al., 2015; Yushkevich et al., 2015).
We reported that the normalized hippocampal volume decreased, and the SR or LSR markers were increased in SCD and MCI subjects compared with healthy elderly subjects. Hippocampal atrophy was found to be less pronounced in SCD subjects than in MCI subjects. Our results demonstrated that SCD subjects showed a differential pattern of atrophy of the hippocampal curvature compared with the NC group. Although we did not find significant differences between the SCD and NC participants in any of the analyzed markers, the LSR presented the highest classification accuracy with 68.2%. As previously described, the NHV marker does not seem to be a sufficiently sensitive measure for differentiating between SCD and NC. However, the LRS marker may be a promising measure for distinguishing these stages. In addition, it should be noted that the pattern of atrophy observed here increased during the progression of Alzheimer's disease, since greater areas of atrophy were observed in the MCI subjects than in the NC or SCD participants. Additionally, in all groups, lower NHV values were related to lower MMSE and episodic memory scores, while higher SR and LSR values were inversely related with these cognitive measures, and the strongest correlations were found with the LSR marker.
Although the pMCI subjects exhibited lower NHV and higher SR and LSR values than the sMCI subjects, LSR achieved higher classification accuracy of 74.3% than the other markers (sensitivity = 77.4%, specificity = 72.3%, AUC = 0.831). These results suggest the relevance of this new marker for classifying those MCI subjects who will ultimately progress to AD, since some studies have reported no differences in hippocampal volume measurements, which is the most employed marker (López et al., 2014).
According to Delong's test, the classification improvements were significant using LSR compared with the NHV and SR markers when the following groups were compared: NC versus SCD, sMCI versus pMCI, sMCI versus AD, and pMCI versus AD. In contrast, when the pair of groups being compared were very different in terms of the degree of the disease (i.e., NC vs. AD, SCD vs. AD, NC vs. MCI, or SCD vs. MCI), classification scores using the LSR marker were similar to the results determined by the SR marker. This is because the statistical significance map between these two groups covers almost the whole left and right hippocampal surface; thus, the LSR and SR values are similar.
The atrophic regions marked by statistical significance maps are consistent with those identified in other publications that used other methodologies, such as high dimensional diffeomorphic mapping (Chételat et al., 2008; Csernansky et al., 2005; La Joie et al., 2010; Perrotin et al., 2015), spherical harmonic representation (Gerardin et al., 2009; Kim et al., 2015) radial distance mapping (Apostolova et al., 2012) or longitudinal deformation fields (Frankó & Joly, 2013).
In the two‐group comparison approach (sMCI vs. pMCI) and the Cox survival analysis, the LSR marker showed better prediction of the progression to AD than the classic marker hippocampal volume.
All these results provide evidence that the LSR marker may be a useful measure to include in AD studies since it is related to cognition and provides higher accuracy classification scores than the NHV or SR markers for comparing different clinical groups, such as NC versus SCD or sMCI versus pMCI.
Supporting information
Appendix S1: Supporting Information
ACKNOWLEDGMENTS
This study was supported by two projects from the Spanish Ministry of Economy and Competitiveness (PSI2009‐14415‐C03‐01 and PSI2012‐38375‐C03‐01) and by a postdoctoral fellowship from the Spanish Ministry of Economy and Competitiveness (IJCI‐2016‐30662).
Platero C, López ME, Carmen Tobar María del, Yus M, Maestu F. Discriminating Alzheimer's disease progression using a new hippocampal marker from T1‐weighted MRI: The local surface roughness. Hum Brain Mapp. 2019;40:1666–1676. 10.1002/hbm.24478
Funding information Spanish Ministry of Economy and Competitiveness, Grant/Award Numbers: IJCI‐ 2016‐30662, PSI2012‐38375‐C03‐01, PSI2009‐14415‐C03‐01
REFERENCES
- Albert, M. S. , DeKosky, S. T. , Dickson, D. , Dubois, B. , Feldman, H. H. , Fox, N. C. , … Phelps, C. H. (2011). The diagnosis of mild cognitive impairment due to Alzheimer's disease: Recommendations from the National Institute on Aging‐Alzheimer's Association workgroups on diagnostic guidelines for Alzheimer's disease. Alzheimer's & Dementia, 7, 270–279. [DOI] [PMC free article] [PubMed] [Google Scholar]
- Apostolova, L. G. , Green, A. E. , Babakchanian, S. , Hwang, K. S. , Chou, Y.‐Y. , Toga, A. W. , & Thompson, P. M. (2012). Hippocampal atrophy and ventricular enlargement in normal aging, mild cognitive impairment and Alzheimer's disease. Alzheimer Disease and Associated Disorders, 26(1), 17–27. [DOI] [PMC free article] [PubMed] [Google Scholar]
- Battaglini, M. , Smith, S. M. , Brogi, S. , & De Stefano, N. (2008). Enhanced brain extraction improves the accuracy of brain atrophy estimation. NeuroImage, 40, 583–589. [DOI] [PubMed] [Google Scholar]
- Boccardi, M. , Ganzola, R. , Bocchetta, M. , Pievani, M. , Redolfi, A. , Bartzokis, G. , … Frisoni, G. B. (2011). Survey of protocols for the manual segmentation of the hippocampus: Preparatory steps towards a joint EADC‐ADNI harmonized protocol. The Journal of Alzheimer's Disease, 26, 61–75. [DOI] [PMC free article] [PubMed] [Google Scholar]
- Buckner, R. L. , Head, D. , Parker, J. , Fotenos, A. F. , Marcus, D. , Morris, J. C. , & Snyder, A. Z. (2004). A unified approach for morphometric and functional data analysis in young, old, and demented adults using automated atlas‐based head size normalization: Reliability and validation against manual measurement of total intracranial volume. NeuroImage, 23, 724–738. [DOI] [PubMed] [Google Scholar]
- Chételat, G. , Fouquet, M. , Kalpouzos, G. , Denghien, I. , De La Sayette, V. , Viader, F. , … Desgranges, B. (2008). Three‐dimensional surface mapping of hippocampal atrophy progression from MCI to AD and over normal aging as assessed using voxel‐based morphometry. Neuropsychologia, 46, 1721–1731. [DOI] [PubMed] [Google Scholar]
- Chupin, M. , Gérardin, E. , Cuingnet, R. , Boutet, C. , Lemieux, L. , Lehéricy, S. , … Colliot, O. (2009). Fully automatic hippocampus segmentation and classification in Alzheimer's disease and mild cognitive impairment applied on data from ADNI. Hippocampus, 19, 579–587. [DOI] [PMC free article] [PubMed] [Google Scholar]
- Csernansky, J. G. , Wang, L. , Swank, J. , Miller, J. P. , Gado, M. , McKeel, D. , … Morris, J. C. (2005). Preclinical detection of Alzheimer's disease: Hippocampal shape and volume predict dementia onset in the elderly. NeuroImage, 25, 783–792. [DOI] [PubMed] [Google Scholar]
- Cuingnet, R. , Gerardin, E. , Tessieras, J. , Auzias, G. , Lehéricy, S. , Habert, M.‐O. , … Alzheimer's Disease Neuroimaging Initiative . (2011). Automatic classification of patients with Alzheimer's disease from structural MRI: A comparison of ten methods using the ADNI database. NeuroImage, 56, 766–781. [DOI] [PubMed] [Google Scholar]
- DeLong, E. R. , DeLong, D. M. , & Clarke‐Pearson, D. L. (1998). Comparing the areas under two or more correlated receiver operating characteristic curves: A nonparametric approach. Biometrics, 44, 837–845. [PubMed] [Google Scholar]
- Desikan, R. S. , Cabral, H. J. , Fischl, B. , Guttmann, C. R. G. , Blacker, D. , Hyman, B. T. , … Killiany, R. J. (2009). Temporoparietal MRI measures of atrophy in subjects with mild cognitive impairment that predict subsequent diagnosis of Alzheimer's disease. AJNR American Journal of Neuroradiology, 30(3), 532–538. 10.3174/ajnr.A1397 [DOI] [PMC free article] [PubMed] [Google Scholar]
- Devanand, D. P. , Pradhaban, G. , Liu, X. , Khandji, A. , De Santi, S. , Segal, S. , … De Leon, M. J. (2007). Hippocampal and entorhinal atrophy in mild cognitive impairment: Prediction of Alzheimer disease. Neurology, 68(11), 828–836. 10.1212/01.wnl.0000256697.20968.d7 [DOI] [PubMed] [Google Scholar]
- Dickerson, B. C. , Bakkour, A. , Salat, D. H. , Feczko, E. , Pacheco, J. , Greve, D. N. , … Buckner, R. L. (2009). The cortical signature of Alzheimer's disease: Regionally specific cortical thinning relates to symptom severity in very mild to mild AD dementia and is detectable in asymptomatic amyloid‐positive individuals. Cerebral Cortex, 19(3), 497–510. 10.1093/cercor/bhn113 [DOI] [PMC free article] [PubMed] [Google Scholar]
- Douaud, G. , Menke, R. a. L. , Gass, A. , Monsch, A. U. , Rao, A. , Whitcher, B. , … Smith, S. (2013). Brain microstructure reveals early abnormalities more than two years prior to clinical progression from mild cognitive impairment to Alzheimer's disease. The Journal of Neuroscience, 33, 2147–2155. [DOI] [PMC free article] [PubMed] [Google Scholar]
- Dubois, B. , Feldman, H. H. , Jacova, C. , DeKosky, S. T. , Barberger‐Gateau, P. , Cummings, J. , et al. (2007). Research criteria for the diagnosis of Alzheimer's disease: Revising the NINCDS‐ADRDA criteria. Lancet Neurology, 6, 734–746. [DOI] [PubMed] [Google Scholar]
- Dukart, J. , Schroeter, M. L. , Mueller, K. , & The Alzheimer's Disease Neuroimaging Initiative . (2011). Age correction in dementia‐‐matching to a healthy brain. PLoS One, e22193, 6. [DOI] [PMC free article] [PubMed] [Google Scholar]
- Evans, A. C. , Janke, A. L. , Collins, D. L. , & Baillet, S. (2012). Brain templates and atlases. NeuroImage, 62, 911–922. [DOI] [PubMed] [Google Scholar]
- De Flores, R. , La Joie, R. , Landeau, B. , Perrotin, A. , Mezenge, F. , de La Sayette, V. , … Chetelat, G. (2015). Effects of age and Alzheimer's disease on hippocampal subfields. Human Brain Mapping, 36, 463–474. [DOI] [PMC free article] [PubMed] [Google Scholar]
- Folstein, M. F. , Folstein, S. E. , & McHugh, P. R. (1975). “Mini‐mental state”. A practical method for grading the cognitive state of patients for the clinician. Journal of Psychiatric Research, 12, 189–198. [DOI] [PubMed] [Google Scholar]
- Frankó, E. , & Joly, O. (2013). Evaluating Alzheimer's disease progression using rate of regional hippocampal atrophy. PLoS One, 8, e71354. [DOI] [PMC free article] [PubMed] [Google Scholar]
- Frisoni, G. B. , Fox, N. C. , Jack, C. R. , Scheltens, P. , & Thompson, P. M. (2010). The clinical use of structural MRI in Alzheimer disease. Nature Reviews Neurology, 6, 67–77. [DOI] [PMC free article] [PubMed] [Google Scholar]
- Frisoni, G. B. , Jack, C. R. , Bocchetta, M. , Bauer, C. , Frederiksen, K. S. , Liu, Y. , … EADC‐ADNI Working Group on The Harmonized Protocol for Manual Hippocampal Volumetry and for the Alzheimer's Disease Neuroimaging Initiative . (2015). The EADC‐ADNI harmonized protocol for manual hippocampal segmentation on magnetic resonance: Evidence of validity. Alzheimer's & Dementia, 11, 111–125. [DOI] [PMC free article] [PubMed] [Google Scholar]
- Gerardin, E. , Chételat, G. , Chupin, M. , Cuingnet, R. , Desgranges, B. , Kim, H.‐S. , … Alzheimer's Disease Neuroimaging Initiative . (2009). Multidimensional classification of hippocampal shape features discriminates Alzheimer's disease and mild cognitive impairment from normal aging. NeuroImage, 47, 1476–1486. [DOI] [PMC free article] [PubMed] [Google Scholar]
- Gutman, B. , Wang, Y. , Morra, J. , Toga, A. W. , & Thompson, P. M. (2009). Disease classification with hippocampal shape invariants. Hippocampus, 19, 572–578. [DOI] [PMC free article] [PubMed] [Google Scholar]
- Heimann, T. , & Meinzer, H.‐P. (2009). Statistical shape models for 3D medical image segmentation: A review. Medical Image Analysis, 13, 543–563. [DOI] [PubMed] [Google Scholar]
- Iglesias, J. E. , Augustinack, J. C. , Nguyen, K. , Player, C. M. , Player, A. , Wright, M. , … Alzheimer's Disease Neuroimaging Initiative . (2015). A computational atlas of the hippocampal formation using ex vivo, ultra‐high resolution MRI: Application to adaptive segmentation of in vivo MRI. NeuroImage, 115, 117–137. [DOI] [PMC free article] [PubMed] [Google Scholar]
- Jack, C. R. , Shiung, M. M. , Gunter, J. L. , O'brien, P. C. , Weigand, S. D. , Knopman, D. S. , … Peterson, R. C. (2004). Comparison of different MRI brain atrophy rate measures with clinical disease progression in AD. Neurology, 62, 591–600. [DOI] [PMC free article] [PubMed] [Google Scholar]
- Jenkinson, M. , Bannister, P. , Brady, M. , & Smith, S. (2002). Improved optimization for the robust and accurate linear registration and motion correction of brain images. NeuroImage, 17, 825–841. [DOI] [PubMed] [Google Scholar]
- Jessen, F. , Amariglio, R. E. , Van Boxtel, M. , Breteler, M. , Ceccaldi, M. , Chételat, G. , … Wagner, M. (2014). A conceptual framework for research on subjective cognitive decline in preclinical Alzheimer's disease. Alzheimer's & Dementia, 10, 844–852. [DOI] [PMC free article] [PubMed] [Google Scholar]
- La Joie, R. , Fouquet, M. , Mézenge, F. , Landeau, B. , Villain, N. , Mevel, K. , … Chételat, G. (2010). Differential effect of age on hippocampal subfields assessed using a new high‐resolution 3T MR sequence. NeuroImage, 53, 506–514. [DOI] [PubMed] [Google Scholar]
- Keihaninejad, S. , Heckemann, R. A. , Fagiolo, G. , Symms, M. R. , Hajnal, J. V. , Hammers, A. , et al. (2010). A robust method to estimate the intracranial volume across MRI field strengths (1.5T and 3T). Neuroimage, 50, 1427–1437. [DOI] [PMC free article] [PubMed] [Google Scholar]
- Khan, W. , Westman, E. , Jones, N. , Wahlund, L.‐O. , Mecocci, P. , Vellas, B. , … AddNeuroMed consortium and for the Alzheimer's Disease Neuroimaging Initiative . (2015). Automated hippocampal subfield measures as predictors of conversion from mild cognitive impairment to Alzheimers disease in two independent cohorts. Brain Topography, 28, 746–759. [DOI] [PMC free article] [PubMed] [Google Scholar]
- Kim, J. , Valdes‐Hernandez, M. D. C. , Royle, N. A. , & Park, J. (2015). Hippocampal shape modeling based on a progressive template surface deformation and its verification. IEEE Transactions on Medical Imaging, 34, 1242–1261. [DOI] [PubMed] [Google Scholar]
- Klein, A. , Andersson, J. , Ardekani, B. A. , Ashburner, J. , Avants, B. , Chiang, M.‐C. , … Parsey, R. V. (2009). Evaluation of 14 nonlinear deformation algorithms applied to human brain MRI registration. NeuroImage, 46, 786–802. [DOI] [PMC free article] [PubMed] [Google Scholar]
- Korolev, I. O. , Symonds, L. L. , Bozoki, A. C. , & Alzheimer's Disease Neuroimaging Initiative . (2016). Predicting progression from mild cognitive impairment to Alzheimer's dementia using clinical, MRI, and plasma biomarkers via probabilistic pattern classification (Ed. Karl Herholz). PLoS One, 11, e0138866. [DOI] [PMC free article] [PubMed] [Google Scholar]
- Landin‐Romero, R. , Kumfor, F. , Leyton, C. E. , Irish, M. , Hodges, J. R. , & Piguet, O. (2017). Disease‐specific patterns of cortical and subcortical degeneration in a longitudinal study of Alzheimer's disease and behavioural‐variant frontotemporal dementia. NeuroImage, 151, 72–80. 10.1016/j.neuroimage.2016.03.032 [DOI] [PubMed] [Google Scholar]
- Leung, K. K. , Barnes, J. , Ridgway, G. R. , Bartlett, J. W. , Clarkson, M. J. , Macdonald, K. , … Alzheimer's Disease Neuroimaging Initiative . (2010). Automated cross‐sectional and longitudinal hippocampal volume measurement in mild cognitive impairment and Alzheimer's disease. Neuroimage, 51, 1345–1359. [DOI] [PMC free article] [PubMed] [Google Scholar]
- López, M. E. , Bruña, R. , Aurtenetxe, S. , Pineda‐Pardo, J. Á. , Marcos, A. , Arrazola, J. , … Maestú, F. (2014). Alpha‐band hypersynchronization in progressive mild cognitive impairment: A magnetoencephalography study. The Journal of Neuroscience, 34, 14551–14559. [DOI] [PMC free article] [PubMed] [Google Scholar]
- López, M. E. , Turrero, A. , Cuesta, P. , López‐Sanz, D. , Bruña, R. , Marcos, A. , … Fernández, A. (2016). Searching for primary predictors of conversion from mild cognitive impairment to Alzheimer's disease: A multivariate follow‐up study. Journal of Alzheimer's Disease, 52, 133–143. [DOI] [PubMed] [Google Scholar]
- Li, Y. , Wang, Y. , Wu, G. , Shi, F. , Zhou, L. , Lin, W. , & Shen, D. (2012). Discriminant analysis of longitudinal cortical thickness changes in Alzheimer's disease using dynamic and network features. Neurobiology of Aging, 33(2), e15 10.1016/j.neurobiolaging.2010.11.008 427.e15, 427.e30. [DOI] [PMC free article] [PubMed] [Google Scholar]
- McKhann, G. M. , Knopman, D. S. , Chertkow, H. , Hyman, B. T. , Jack, C. R. , Kawas, C. H. , … Phelps, C. H. (2011). The diagnosis of dementia due to Alzheimer's disease: Recommendations from the National Institute on Aging‐Alzheimer's Association workgroups on diagnostic guidelines for Alzheimer's disease. Alzheimer's & Dementia, 7, 263–269. [DOI] [PMC free article] [PubMed] [Google Scholar]
- Osher, S. , & Fedkiw, R. (2006). Level set methods and dynamic implicit surfaces (Vol. 153). New York, NY: Springer Science & Business Media. [Google Scholar]
- Pantazis, D. , Leahy, R. M. , Nichols, T. E. , & Styner, M. . (2004). Statistical surface‐based morphometry using a nonparametric approach. In IEEE International Symposium on Biomedical Imaging: Nano to Macro, 2004 (pp. 1283–1286).
- Pengas, G. , Pereira, J. , Williams, G. B. , & Nestor, P. J. (2009). Comparative reliability of total intracranial volume estimation methods and the influence of atrophy in a longitudinal semantic dementia cohort. Journal of Neuroimaging, 19, 37–46. [DOI] [PubMed] [Google Scholar]
- Perrotin, A. , de Flores, R. , Lamberton, F. , Poisnel, G. , La Joie, R. , de la Sayette, V. , … Chetelat, G. (2015). Hippocampal subfield volumetry and 3D surface mapping in subjective cognitive decline. The Journal of Alzheimer's Disease, 48, S141–S150. [DOI] [PubMed] [Google Scholar]
- Platero, C. , & Tobar, M. C. (2015). A label fusion method using conditional random fields with higher‐order potentials: Application to hippocampal segmentation. Artificial Intelligence in Medicine, 64, 117–129. [DOI] [PubMed] [Google Scholar]
- Platero, C. , & Tobar, M. C. (2017). Combining a patch‐based approach with a nonrigid registration‐based label fusion method for the hippocampal segmentation in Alzheimer's disease. Neuroinformatics, 15, 165–183. [DOI] [PubMed] [Google Scholar]
- Reisberg, B. , Shulman, M. B. , Torossian, C. , Leng, L. , & Zhu, W. (2010). Outcome over seven years of healthy adults with and without subjective cognitive impairment. Alzheimer's & Dementia, 6, 11–24. [DOI] [PMC free article] [PubMed] [Google Scholar]
- Rosen, W. G. , Terry, R. D. , Fuld, P. A. , Katzman, R. , & Peck, A. (1980). Pathological verification of ischemic score in differentiation of dementias. Annals of Neurology, 7, 486–488. [DOI] [PubMed] [Google Scholar]
- Sabuncu, M. R. , Bernal‐Rusiel, J. L. , Reuter, M. , Greve, D. N. , & Fischl, B. (2014). Event time analysis of longitudinal neuroimage data. NeuroImage, 97, 9–18. 10.1016/j.neuroimage.2014.04.015 [DOI] [PMC free article] [PubMed] [Google Scholar]
- Saykin, A. J. , Wishart, H. A. , Rabin, L. A. , Santulli, R. B. , Flashman, L. A. , West, J. D. , … Mamourian, A. C. (2006). Older adults with cognitive complaints show brain atrophy similar to that of amnestic MC. Neurology, 67, 834–842. [DOI] [PMC free article] [PubMed] [Google Scholar]
- Scheef, L. , Spottke, A. , Daerr, M. , Joe, A. , Striepens, N. , Kölsch, H. , … Jessen, F. (2012). Glucose metabolism, gray matter structure, and memory decline in subjective memory impairment. Neurology, 79, 1332–1339. [DOI] [PubMed] [Google Scholar]
- Smith, S. M. (2002). Fast robust automated brain extraction. Human Brain Mapping, 17, 143–155. [DOI] [PMC free article] [PubMed] [Google Scholar]
- Stein, J. L. , Medland, S. E. , Vasquez, A. A. , Hibar, D. P. , Senstad, R. E. , Winkler, A. M. , et al. (2012). Identification of common variants associated with human hippocampal and intracranial volumes. Nature Genetics, 44, 552–561. [DOI] [PMC free article] [PubMed] [Google Scholar]
- Tepest, R. , Wang, L. , Csernansky, J. G. , Neubert, P. , Heun, R. , Scheef, L. , & Jessen, F. (2008). Hippocampal surface analysis in subjective memory impairment, mild cognitive impairment and Alzheimer's dementia. Dementia and Geriatric Cognitive Disorders, 26, 323–329. [DOI] [PubMed] [Google Scholar]
- Vemuri, P. , Weigand, S. D. , Knopman, D. S. , Kantarci, K. , Boeve, B. F. , Petersen, R. C. , & Jack, C. R. (2011). Time‐to‐event voxel‐based techniques to assess regional atrophy associated with MCI risk of progression to AD. NeuroImage, 54(2), 985–991. 10.1016/j.neuroimage.2010.09.004 [DOI] [PMC free article] [PubMed] [Google Scholar]
- Wechsler, D. (1997). Wechsler memory scale: Introduction and implications (3rd ed.). San Antonio, TX: The Psychological Corporation. [Google Scholar]
- Wolz, R. , Heckemann, R. A. , Aljabar, P. , Hajnal, J. V. , Hammers, A. , Lötjönen, J. , & Rueckert, D. (2010). Measurement of hippocampal atrophy using 4D graph‐cut segmentation: Application to ADNI. NeuroImage, 52, 109–118. [DOI] [PubMed] [Google Scholar]
- Yesavage, J. A. , Brink, T. L. , Rose, T. L. , Lum, O. , Huang, V. , Adey, M. , & Leirer, V. O. (1982). Development and validation of a geriatric depression screening scale: A preliminary report. Journal of Psychiatric Research, 17, 37–49. [DOI] [PubMed] [Google Scholar]
- Yushkevich, P. A. , Pluta, J. B. , Wang, H. , Xie, L. , Ding, S.‐L. , Gertje, E. C. , … Wolk, D. A. (2015). Automated volumetry and regional thickness analysis of hippocampal subfields and medial temporal cortical structures in mild cognitive impairment. Human Brain Mapping, 36, 258–287. [DOI] [PMC free article] [PubMed] [Google Scholar]
Associated Data
This section collects any data citations, data availability statements, or supplementary materials included in this article.
Supplementary Materials
Appendix S1: Supporting Information