

Abstract
Cognitive deficits contribute to functional disability in patients with schizophrenia and may be related to altered functional networks that serve cognition. We evaluated the integrity of major functional networks and assessed their role in supporting two cognitive functions affected in schizophrenia: processing speed (PS) and working memory (WM). Resting‐state functional magnetic resonance imaging (rsfMRI) data, N = 261 patients and 327 controls, were aggregated from three independent cohorts and evaluated using Enhancing NeuroImaging Genetics through Meta Analysis rsfMRI analysis pipeline. Meta‐ and mega‐analyses were used to evaluate patient‐control differences in functional connectivity (FC) measures. Canonical correlation analysis was used to study the association between cognitive deficits and FC measures. Patients showed consistent patterns of cognitive and resting‐state FC (rsFC) deficits across three cohorts. Patient‐control differences in rsFC calculated using seed‐based and dual‐regression approaches were consistent (Cohen's d: 0.31 ± 0.09 and 0.29 ± 0.08, p < 10−4). RsFC measures explained 12–17% of the individual variations in PS and WM in the full sample and in patients and controls separately, with the strongest correlations found in salience, auditory, somatosensory, and default‐mode networks. The pattern of association between rsFC (within‐network) and PS (r = .45, p = .07) and WM (r = .36, p = .16), and rsFC (between‐network) and PS (r = .52, p = 8.4 × 10⁻³) and WM (r = .47, p = .02), derived from multiple networks was related to effect size of patient‐control differences in the functional networks. No association was detected between rsFC and current medication dose or psychosis ratings. Patients demonstrated significant reduction in several FC networks that may partially underlie some of the core neurocognitive deficits in schizophrenia. The strength of connectivity‐cognition relationships in different networks was strongly associated with network's vulnerability to schizophrenia.
Keywords: effect size, processing speed, resting‐state functional connectivity, working memory
1. INTRODUCTION
Schizophrenia is a neuropsychiatric disorder characterized by cognitive deficits and high rates of functional disability that contribute to its socioeconomic costs (Dickinson, Ramsey, & Gold, 2007; Faraone et al., 2000; Keefe et al., 2004; Keefe, Eesley, & Poe, 2005; Knowles, David, & Reichenberg, 2010; Reichenberg & Harvey, 2007). Fundamental cognitive impairments in schizophrenia include reduced information processing speed (PS) and working memory (WM) abilities that may also underwrite other higher level cognitive function (Barch & Ceaser, 2012; Bowie & Harvey, 2006; Kochunov et al., 2017). We hypothesized that these deficits may in part be caused by altered long‐distance connectivity in functional networks that serve these cognitive functions (Bartzokis, 2012; Bartzokis, et al., 2010; Felts, Baker, & Smith, 1997; Waxman & Bennett, 1972). Magnetic resonance imaging (MRI) exploring the “resting‐state” and “task‐based” functionality of individuals with schizophrenia suggests reduced connectivity in networks that interconnect frontal, parietal, and temporal functions and are activated during tasks of higher cognitive function (Fornito & Bullmore, 2010; Godwin, Ji, Kandala, & Mamah, 2017; Kelly et al., 2018; Li et al., 2017; Liang et al., 2006; Whitfield‐Gabrielia et al., 2009). Prior studies suggest that reduced functional connectivity (FC) is caused by complex interactions between brain maturation and genetic and environmental etiologies for schizophrenia (Blokland, 2017; Calhoun, Eichele, & Pearlson, 2009; Karbasforoushan & Woodward, 2012; Whitfield‐Gabrieli & Ford, 2012). However, the relationship between neurocognitive deficits and FC in schizophrenia remained unexplored in large inclusive samples. We hypothesized that FC deficits, particularly within and across resting‐state networks may contribute to the cognitive deficits characterized by this disorder. Toward this aim, we used an analytical workflow developed for a cross‐cohort meta‐and‐mega analysis of FC that uses the probabilistic regions of interest (ROIs) from the independent component analysis of the N = 30,000 functional experiments recorded in the BrainMap database (Smith et al., 2009). We ranked the statistical effect sizes (ESs) of FC deficits between patients and controls in major functional networks and then quantified the contribution of FC to individual variance related core cognitive deficits in PS and WM.
Deficits in PS and WM may underlie other neurocognitive deficits including attention, executive and other higher cognitive functions (Coyle, Pillow, Snyder, & Kochunov, 2011; Park & Holzman, 1992; Salthouse, 2009; Sitskoorn, Aleman, Ebisch, Appels, & Kahn, 2004). The cognitive disturbances might be caused by the abnormal connectivity between frontal, temporal, and parietal regions of individuals with schizophrenia (Farzan et al., 2010; Uhlhaas & Singer, 2010). In parallel, the onset, development, and severity of neurocognitive deficits imply impaired cerebral connectivity (Alba‐Ferrara & de Erausquin, 2013; Ellison‐Wright & Bullmore, 2009; Friedman et al., 2008; Glahn et al., 2013; Kubicki et al., 2007; Nazeri et al., 2012; Perez‐Iglesias et al., 2011; Phillips, Rogers, Barrett, Glahn, & Kochunov, 2012; Wright et al., 2015). Specifically, individuals with schizophrenia have multimodal connectivity deficits that alter both functional and structural connectivity outcomes (Bartzokis, 2012; Bartzokis, et al., 2010; Calhoun et al., 2009; Felts et al., 1997; Waxman & Bennett, 1972). Postmortem studies reveal widespread reductions in white matter myelin and glial density levels particularly in white matter regions that connect frontal areas with other parts of the brain (Kochunov, Rowland, et al., 2016; Kochunov et al., 2017). The reduced PS is correlated with widespread white matter abnormalities in diffusion MRI (Stotesbury et al., 2018), but deficits in WM, verbal memory, and executive functioning were not mediated by white matter integrity (Karbasforoushan, Duffy, Blackford, & Woodward, 2015). Previous research suggests that reduced FC strength may diminish coherence in long‐distance cerebral networks that are active during rest and cognitive tasks (Bassett, Nelson, Mueller, Camchong, & Lim, 2012; Karbasforoushan & Woodward, 2012; Woodward, Rogers, & Heckers, 2011; Yu et al., 2012). However, research findings linking FC with cognitive deficits in this disorder have been inconsistent. For instance, a study in first‐diagnosis subjects suggested that the deficits in PS are associated with increased connectivity between right central executive network and right ventral attention network (AttN) in patients (Anhoj et al., 2018). A study in chronic patients has failed to replicate that findings and instead linked cognitive deficits in PS, WM to reduction in thalamofrontal connectivity (Chen, Ye, Jin, Zhu, & Wang, 2018). For our study, we chose to use a data‐driven approach and a large mega‐analytical dataset to link FC deficits to cognition using meta‐analytical sample design to reduce cohort‐specific variances. The tests are known to measure PS deficits and WM abilities: the Digit Symbol Substitution Test (Dickinson et al., 2007; Knowles et al., 2010) and the Digit Sequencing Test (DST) (Keefe et al., 2004).
Meta‐analytical studies reported moderate patient‐control ESs for measurements of structural connectivity from white matter regions and cognition (WM) (Cohen's d ~0.4) (Kelly et al., 2018; Knowles et al., 2010). This necessitates the use of large samples to achieve statistical significance. We addressed this challenge by using a large mega‐analytical sample and a standardized mega‐ and meta‐analysis approach for assessing FC developed by the Enhancing NeuroImaging Genetics through Meta Analyses (ENIGMA) collaboration, which is focused on big data neuroimaging analysis (Jahanshad et al., 2013). Using datasets from three cohorts collected at a single site with the same recruitment criteria, neurocognitive and clinical assessments, followed by standardized workflows for meta‐analytical estimates of group differences akin to larger studies enabled us to evaluate the reproducibility and robustness of our findings.
2. METHODS
2.1. Participants
The three cohorts comprised a total of 261 individuals with schizophrenia or schizoaffective disorder (patients) (161 males/100 females)—that were recruited from the outpatient clinics at the Maryland Psychiatric Research Center (MPRC) and the mental health clinics in greater Baltimore area between 2004 and 2016. N = 327 healthy controls (146 males/211 females), recruited through media advertisements from the same geographic area. The participants were required for a large ongoing study of the effects of cerebral disconnectivity in the schizophrenia. Demographics of the samples along with the symptom severity and medication measures included in the current resting‐state functional MRI (rsfMRI) study are reported in Table 1. Diagnoses were confirmed with the Structured Clinical Interview for Diagnostic and Statistical Manual of Mental Disorders‐IV (DSM‐IV) in all participants. Major medical and neurological illnesses, history of head injury with cognitive sequelae, and diagnosis of intellectual disability were exclusionary. Control participants had no past or present DSM‐IV Axis I psychiatric disorder and no family history of psychosis in the prior two generations. All participants gave written informed consent as approved by the local Institutional Review Board. The cohorts were collected using three 3 T Siemens scanners that constituted the progress in MRI technology. All subjects were assessed for research studies at MPRC using uniform recruitment criteria, neurological and clinical assessments, and inclusion of a control group were kept the same. Participants' demographic information and the image acquisition parameters for these three cohorts are provided in the Supporting Information. The aggregate rsfMRI data from these cohorts have not been published before; the aggregate cognitive data and the diffusion tensor imaging data from these cohorts has been published (Kochunov et al., 2017, 2018).
Table 1.
Demographics for rsfMRI data for individuals with SCZ and HC groups. Values for age are in years. Symptom severity and medication measures are provided
| Cohort A | Cohort B | Cohort C | Mega‐cohort | |||||
|---|---|---|---|---|---|---|---|---|
| SCZ (n = 50) | HC (n = 64) | SCZ (n = 51) | HC (n = 81) | SCZ (n = 160) | HC (n = 182) | SCZ (n = 261) | HC (n = 327) | |
| Mean age (SD) (years) | 36.7 (11.8) | 37.8 (13.2) | 36.7 (11.8) | 37.8 (13.2) | 37.5 (14.4) | 37.0 (16.1) | 37.2 (13.5) | 39.1 (15.2) |
| Age range (years) | 18–56 | 18–62 | 18–56 | 18–62 | 18–63 | 18–65 | 18–63 | 18–65 |
| Gender (M/F) | 43/7 | 45/19 | 43/7 | 45/19 | 86/74 | 80/102 | 161/100 | 146/181 |
| BPRS | 30.7 ± 10.7 | 24.0 ± 5.0 | 30.7 ± 10.7 | 24.0 ± 5.0 | 31.2 ± 8.7 | 24.2 ± 6.9 | 30.8 ± 11.6 | 24.0 ± 5.0 |
| CPZ | 400.0 ± 352.9 | NA | 400.0 ± 352.9 | NA | 453.5 ± 367.9 | NA | 452.2 ± 416.9 | NA |
| FTND | 4.1 ± 2.2 | 4.2 ± 2.1 | 4.1 ± 2.2 | 4.2 ± 2.1 | 4.8 ± 2.5 | 4.5 ± 2.6 | 4.8 ± 2.3 | 4.5 ± 2.2 |
| Age‐of‐onset (years) | 18.5 ± 7.5 | NA | 18.9 ± 7.8 | NA | 18.1 ± 8.5 | NA | 18.3 ± 8.2 | NA |
| Illness duration (years) | 19.7 ± 13.6 | NA | 20.1 ± 13.7 | NA | 21.5 ± 15.1 | NA | 20.9 ± 14.6 | NA |
Abbreviations: BPRS, brief psychiatric rating scale, CPZ, chlorpromazine equivalence, FTND, Fagerstrom test for nicotine dependence; HC, healthy control; rsfMRI, resting‐state functional magnetic resonance imaging; SCZ, schizophrenia.
2.2. Measures
All patients had undergone a uniform psychiatric interview that included Brief Psychiatric Rating Scale (BPRS) (Hedlund & Vieweg, 1980). The BPRS consists of 20 symptom constructs and each symptom is rated from 1 (not present) and 7 (extremely severe) and the total score of BPRS (Table 1 ) was used to represent overall clinical symptoms. Controls also had undergone BPRS tests. PS was assessed with the Digit Symbol Coding task of the WAIS‐3 (Wechsler, 1997). The digit symbol test involves a key consisting of the numbers 1–9 paired with a unique, easy‐to‐draw symbol. The task requires the individual to scan the answer key, provided at the top of the page and then write the correct symbol by each number. The test taker is allowed for 90 s to fill in the corresponding symbol for each number. The number of correctly filled symbols is recorded. In meta‐analyses of all cognitive domains affected by schizophrenia, the speed of information processing showed the largest patient‐control differences, as measured by this task (Dickinson et al., 2007; Knowles et al., 2010). WM was assessed with the DST of the WAIS‐3 (Keefe et al., 2004). It consisted of digits forward and digits backward subtasks. Examinee was asked to recall three to nine digits forward and two to nine digits backward. The number of successfully recalled digits within 90 s was recorded. Note that PS and WM are complex constructs, and a single task may not capture all aspects. However, as this was a large sample collected over many years, it would be difficult to maintain consistency if including a large battery; as such, we opted for testing only two of the most representative cognitive deficits for schizophrenia, while ensuring consistency. The current medication dose was recorded and converted to chlorpromazine equivalence (CPZ) (Woods, 2003). CPZ was not significantly different among the three patient cohorts (p = .20, t test). Fagerstrom test for nicotine dependence (FTND) scores were recorded from the participants, yes/no items are scored 1/0 and multiple‐choice items are scored from 0 to 3, yielding a total score of 0–10 (Heatherton, Kozlowski, Frecker, & Fagerstorm, 1991). These FTND scores (Table 1) were not significantly different for controls and patients within cohorts and for mega‐cohort (p > .50, t test). All participants with schizophrenia were evaluated for their capacity to provide informed consent.
2.3. rsfMRI data processing and analysis
The three datasets were collected using phase array coils a 4‐channel (Cohort A), a 12‐channel head coil (Cohort B), and a 32‐channel head coil (Cohort C), all manufactured by Siemens, Germany. The rsfMRI data included 150 volumes (Cohort A), 140 volumes (Cohort B), and 444 volumes (Cohort C). Resting‐state data were obtained using a single‐shot gradient‐recalled, echo‐planar imaging (EPI) pulse sequence with the following acquisition parameters: Cohort A: repetition time (TR): 2000 ms, echo time (TE): 27 ms, 64 × 64 matrix, 3.44 × 3.44 mm2 in‐plane resolution, 4 mm slice thickness, 39 axial slices; Cohort B: TR: 2210 ms, TE: 27 ms, 64 × 64 matrix, 3.44 × 3.44 mm2 in‐plane resolution, 4 mm slice thickness, 36 axial slices, and Cohort C: TR: 2000 ms, TE: 30 ms, 128 × 128 matrix, 1.72 × 1.72 mm2 in‐plane resolution, 4 mm slice thickness, 37 axial slices (more detail is provided in the Supporting Information). The ENIGMA resting‐state analysis pipeline implemented in the Analysis of Functional NeuroImages (AFNI) software (Cox, 1996) was used to process the rsfMRI data. This single‐modality resting‐state analysis pipeline is an extension of the conventional AFNI rsfMRI pipeline (Figure S1) (Adhikari et al., 2018b). A principal component analysis‐based denoising (Veraart, Fieremans, & Novikov, 2016; Veraart, Novikov, et al., 2016) approach is the first step implemented in this analysis pipeline to improve signal‐to‐noise ratio (SNR) and temporal SNR (tSNR) properties of the time series data. In the next step, a transformation is computed registering the base volume to the ENIGMA EPI template (Adhikari, et al., 2018) and this atlas is used for regression of the global signal, and as a common anatomical spatial reference frame (as detailed further in the Supporting Information.
Resting‐state network templates were defined based on the probabilistic ROIs from the analysis of the BrainMap activation database and resting‐state fMRI dataset (Smith et al., 2009). We defined the binary masks of the resting state template regions from the auditory network (AN), AttN, default mode network (DMN), executive control network (ECN), frontoparietal network (FPN), salience network (SN), sensorimotor network (SMN), and visual network (VN) (Figure S2; Adhikari et al., 2018a). Resting‐state FC (rsFC) values were extracted from these template ROIs using seed‐based and dual regression analysis approaches (more details are provided in the Supporting Information) and the subsequent analysis was performed using these measures (as detailed in the Supporting Information). Furthermore, AttN and FPN were divided into left and right subnetworks each (left AttN [lAttN], right AttN [rAttN] and left FPN [lFPN], right FPN [rFPN]), the VN was divided into two subnetworks, and the DMN, SN, and SMN are divided into three subnetworks each (more detail is provided below and Supporting Information).
We further analyzed between‐network FC using seed‐based analysis. We extracted an average time series for each of these 24 ROIs and computed the correlation matrix for all ROIs for each control and schizophrenic participant. After the Fisher's r‐ to z‐transformation, the FC between each pair of ROIs was calculated and compared using an independent sample t test, with multiple comparisons correction.
2.4. Meta‐analysis
A meta‐analysis of patient‐control ES measurements (Cohen's d‐values) was performed in [R] software using the inverse variance method to compute the bias corrected standardized mean difference (ES) between individuals with schizophrenia and healthy controls, as implemented in the package, meta (http://www.meta-analysis-with-r.org).
2.5. Mega‐analysis
A “mega‐analysis” of patient‐control ES measurements (Cohen's d‐values) was performed using “polyclass” function implemented in SOLAR‐Eclipse software (http://www.solar-eclipse-genetics.org) (Jahanshad et al., 2013; Kochunov, Ganjgahi, et al., 2016). This function combines the data across the cohorts by fitting the covariate model consisting of sex, age, age2, age × sex interaction, and age2 × sex interaction for each cohort separately, that is followed by a per‐site inverse Gaussian normalization of data (as detailed in Kochunov et al., 2014). Meta‐ and mega‐analytical aggregation was used for both cognitive and connectivity measurements and produced residuals corrected for age and sex.
2.6. Canonical correlation analysis between cognition and connectivity
Canonical correlation analysis (CCA) was performed to define a low dimensional representation of FC features following mega‐analytical aggregation (using the function: “canoncorr.m”; https://www.mathworks.com/). The two cognitive measurements were used as the dependent variables and connectivity indexes served as predictors. CCA is a flexible and powerful multivariate statistical method to perform correlation analyses that allow for the linear relationship between dependent variables and predictors (Uurtio et al., 2017).
CCA was used to probe the pattern of FC measures that were related to cognitive deficits, as measured by PS and WM. To keep the number of connections, the same for each resting‐state network under consideration and to minimize the possible overfitting effect by a network having a higher number of connections during CCA, we divided RSNs into the following 17 subnetworks: a network (subnetwork) for AN and ECN each, two subnetworks for AttN (lAttN and rAttN), FPN (lFPN and rFPN), and VN (VN1, VN2) each and three subnetworks for DMN (DMN1, DMN2, DMN3), SN (SN1, SN2, SN3), and SMN (SMN1, SMN2, SMN3); keeping the functional connections from one ROI to next and the other way around for a subnetwork (more details are provided in the Supporting Information).
We also performed the CCA for rsFC measures computed between‐networks analysis to investigate the pattern of association between cognitive deficits and these rsFC measures and hence, to derive relationship between cognitive measures (PS and WM) and the ES of the patient‐control differences in the functional networks.
2.7. Impact of symptom severity and medication
We studied whether the FC measures were associated with symptom severity and current antipsychotic medication dosages in schizophrenia in the resting‐state functional connections between RSNs ROIs. We also performed CCA between BPRS scores and rsFC measures for each network/subnetwork to evaluate the correlation patterns between them and then calculated the correlation of the BPRS with the ESs of diagnosis. This analysis was performed in both patients and controls to exclude any biasing effects of the diagnosis.
2.8. Additional statistical procedures
We performed the correlation analysis between the FTND scores and rsFC values for each functional connection separately for both patients and controls.
The patient‐control differences (ESs, Cohen's d‐values) were calculated for individual functional connections in each cohort separately. Using these ES measures, the correlation analysis was performed between any two cohorts to evaluate the cognitive deficit patterns across three cohorts. Furthermore, the ESs measured from each cohort were assessed for correlation with the ESs derived from the mega‐analysis approach.
3. RESULTS
3.1. Cognitive and functional connectivity deficits
Patients in all three cohorts showed reduced rsFC measures (Table S1 and Figure S5, see Supporting Information). The aggregated ESs performed using the mega‐analysis and meta‐analyses were highly correlated for both seed‐based and dual regression approaches (r > .90 and p < 10−13) (Figure S6a,b). All further analyses were performed in the full combined cohort using mega‐analytical aggregation.
In the combined cohorts, patients demonstrated significantly lower average cognitive scores (Cohen's d = 0.72 ± 0.21) and mega‐analytical rsFC measures (d = 0.31 ± 0.09, p < 10−4 for seed‐based approach (Figure 1a, Table 2), d = 0.29, p < 10−4 for dual regression approach (Figure 1b). For subnetworks, the greatest rsFC deficits were observed for the SN3 (d = 0.50 ± 0.05) followed by SN1 (d = 0.48 ± 0.05); SMN1 (d = 0.34 ± 0.05); and AN (d = 0.30 ± 0.05) (Figure 2). The meta‐analytical analysis for rsFC measures produced similar deficit patterns (Table S2, Figure S3 (seed‐based analysis), and Figure S4 (dual regression analysis) for meta‐analysis, and Table 2 for mega‐analysis).
Figure 1.
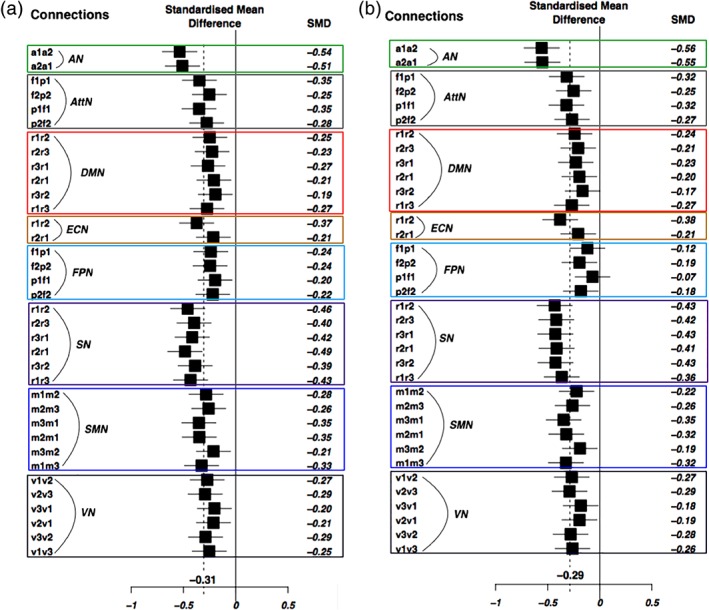
Mega‐analytic results. Mega‐analytic Forest plots for group differences between individuals with schizophrenia and healthy controls, for resting‐state functional connectivity (rsFC) measures, with (a) the seed‐based analysis approach; and (b) the dual regression analysis approach, for each resting‐state network's functional connections. Enclosed rectangular boxes, with different colors, separate the functional connections for each resting‐state network. Abbreviations: AN, auditory network, a1/a2, left/right primary and association auditory cortices; AttN, attention network, f1/f2, left/right middle frontal gyrus, and p1/p2, left/right superior parietal lobule; DMN, default mode network, r1, posterior cingulate/precuneus, r2, bilateral temporal–parietal regions and, r3, ventromedial frontal cortex; ECN, executive control network, r1, anterior cingulate cortex and r2, bilateral medial frontal gyrus; FPN, fronto‐parietal network, f1/f2, left/right frontal area (inferior frontal gyrus) and p1/p2, left/right parietal area (inferior parietal lobule); SN, salience network, r1, anterior cingulate cortex and r2/r3, left/right insula; SMN, sensorimotor network, m1/m3, left/right motor area and m2, supplementary motor area; and VN, visual network, v1, medial visual areas, v2, occipital visual areas, and v3, lateral visual areas [Color figure can be viewed at http://wileyonlinelibrary.com]
Table 2.
Mega‐analytical statistics comparing groups of individuals with schizophrenia and healthy controls using FC measures from resting‐state networks. ES values (in bold font) survived multiple comparison corrections (Bonferroni correction, p < .05)
| Seed‐based analysis approach | |||||
|---|---|---|---|---|---|
| Network | Connections | ES | 95% CI | z‐Value | p‐Value |
| AN | a1‐a2 | −0.54 | [−0.70; −0.37] | −6.35 | 2.2E‐10 |
| a2‐a1 | −0.51 | [−0.68; −0.34] | −6.04 | 1.5E‐09 | |
| AttN | f1‐p1 | −0.35 | [−0.51; −0.18] | −4.15 | 3.3E‐05 |
| p1‐f1 | −0.35 | [−0.51; −0.19] | −4.19 | 2.8E‐05 | |
| f2‐p2 | −0.25 | [−0.42; −0.09] | −3.03 | .0025 | |
| p2‐f2 | −0.28 | [−0.44; −0.11] | −3.33 | .0009 | |
| DMN | r1‐r2 | −0.25 | [−0.41; −0.08] | −2.97 | .0030 |
| r2‐r3 | −0.23 | [−0.39; −0.06] | −2.71 | .0067 | |
| r3‐r1 | −0.27 | [−0.43; −0.10] | −3.18 | .0015 | |
| r2‐r1 | −0.21 | [−0.37; −0.05] | −2.51 | 0122 | |
| r3‐r2 | −0.19 | [−0.36; −0.03] | −2.34 | .0192 | |
| r1‐r3 | −0.27 | [−0.44; −0.11] | −3.29 | .0010 | |
| ECN | r1‐r2 | −0.37 | [−0.54; −0.21] | −4.46 | 8.1E‐06 |
| r2‐r1 | −0.21 | [−0.38; −0.05] | −2.57 | .0101 | |
| FPN | f1‐p1 | −0.24 | [−0.40; −0.08] | −2.86 | .0042 |
| p1‐f1 | −0.20 | [−0.36; −0.03] | −2.37 | .0178 | |
| f2‐p2 | −0.24 | [−0.41; −0.08] | −2.94 | .0033 | |
| p2‐f2 | −0.22 | [−0.38; −0.06] | −2.64 | .0084 | |
| SN | r1‐r2 | −0.46 | [−0.62; −0.29] | −5.46 | 4.7E‐08 |
| r2‐r3 | −0.40 | [−0.56; −0.23] | −4.75 | 2.1E‐06 | |
| r3‐r1 | −0.42 | [−0.58; −0.25] | −4.97 | 6.8E‐07 | |
| r2‐r1 | −0.49 | [−0.65; −0.32] | −5.76 | 8.2E‐09 | |
| r3‐r2 | −0.39 | [−0.55; −0.22] | −4.63 | 3.6E‐06 | |
| r1‐r3 | −0.43 | [−0.60; −0.27] | −5.15 | 2.6E‐07 | |
| SMN | m1‐m2 | −0.29 | [−0.45; −0.12] | −3.40 | .0007 |
| m2‐m3 | −0.26 | [−0.42; −0.10] | −3.11 | .0019 | |
| m3‐m1 | −0.35 | [−0.52; −0.19] | −4.21 | 2.6E‐05 | |
| m2‐m1 | −0.35 | [−0.51; −0.18] | −4.16 | 3.1E‐05 | |
| m3‐m2 | −0.21 | [−0.38; −0.05] | −2.55 | .0107 | |
| m1‐m3 | −0.33 | [−0.49; −0.16] | −3.91 | 9.3E‐05 | |
| VN | v1‐v2 | −0.27 | [−0.44; −0.11] | −3.27 | .0011 |
| v2‐v3 | −0.29 | [−0.46; −0.13] | −3.51 | .0005 | |
| v3‐v1 | −0.20 | [−0.37; −0.04] | −2.45 | .0144 | |
| v2‐v1 | −0.21 | [−0.38; −0.05] | −2.56 | .0106 | |
| v3‐v2 | −0.29 | [−0.45; −0.13] | −3.46 | .0005 | |
| v1‐v3 | −0.25 | [−0.42; −0.09] | −3.04 | .0024 | |
| Mean ES | −0.31 | [−0.33; −0.28] | −19.5 | <1.0E‐04 | |
Abbreviations: AN, auditory network, a1/a2, left/right primary and association auditory cortices; AttN, , attention network, f1/f2, left/right middle frontal gyrus, and p1/p2, left/right superior parietal lobule; DMN, default mode network, r1, posterior cingulate/precuneus, r2, bilateral temporal–parietal regions and, r3, ventromedial frontal cortex; ECN, executive control network, r1, anterior cingulate cortex and r2, bilateral medial frontal gyrus; ES, effect size; FC, functional connectivity; FPN, frontoparietal network, f1/f2, left/right frontal area (inferior frontal gyrus) and p1/p2, left/right parietal area (inferior parietal lobule); SN, salience network, r1, anterior cingulate cortex and r2/r3, left/right insula; SMN, sensorimotor network, m1/m3, left/right motor area and m2, supplementary motor area; and VN, visual network, v1, medial visual areas, v2, occipital visual areas, and v3, lateral visual areas.
Figure 2.

Mega‐analytic Forest plots for group differences between individuals with schizophrenia and healthy controls, from resting‐state functional connectivity (rsFC) measures for resting‐state subnetwork. Each subnetwork consisted of two functional connections between two regions of interest ROIs (connections from the first region to the second region and vice versa). The abbreviations used are the same as in Figure 1; additional prefixes (l/r: left/right) or suffixes (1, 2, 3) are used to represent the subnetwork components
Between‐networks connectivity calculation using the seed‐based analysis (Figure 3, Figure S8, and Table S5) showed 23 ROI pairs showed significant patient‐control differences (still passing a corrected p‐value of .05, after Bonferroni multiple comparisons correction, corresponding to an uncorrected p < 1.8 × 10⁻⁴). The significant differences indicated lower FC values in individuals with schizophrenia. Significant reductions in FC were found between the AN ROIs and the SN; DMN, ECN ROIs and the supplementary motor area (SMA) in SMN; between the DMN ROIs and SN ROIs; between SN ROIs and the SMA in SMN. We observed increases in FC between AttN ROIs and the AN, SMN, and DMN ROIs; between SMN ROIs and the ECN and FPN ROIs, but none of them were statistically significant, after Bonferroni multiple comparisons correction.
Figure 3.
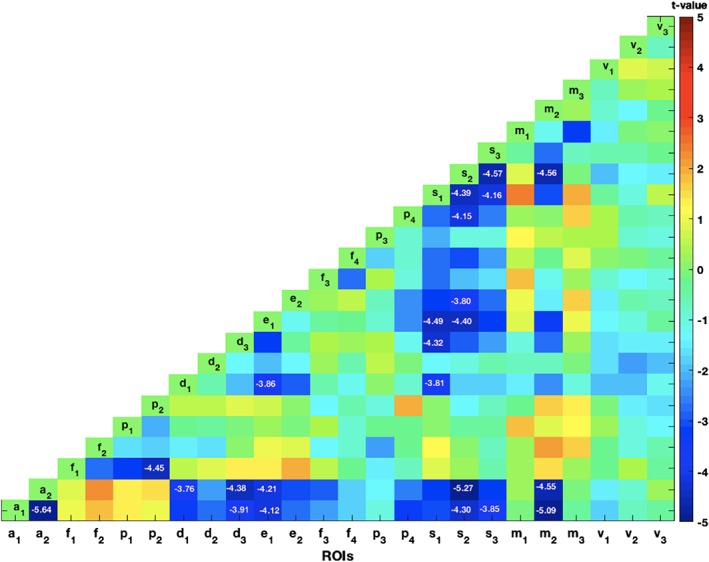
The statistical t‐map showing the patient‐control differences in the functional connectivity (FC) for each pair of regions of interest (ROIs) in between‐network connectivity analysis. The t values for the ROI pairs, statistically significant after Bonferroni multiple comparisons correction, were displayed. These ROI pairs showed reduced FC in patient sample [Color figure can be viewed at http://wileyonlinelibrary.com]
3.2. Functional connectivity and cognition
CCA results for the two cognitive measures and FC measurements are shown in Table 3. We observed a significant positive correlation between rsFC and the two cognitive measurements (r = .49, p = .002 and r = .46, p = .004 for PS and WM, respectively) in the patients. A positive significant correlation was found between rsFC and PS when calculated in the full sample and control samples independently (r = .36, p = .01 for the full sample and r = .34, p = .02 for controls). Likewise, the correlation with WM was significant in the full sample and controls separately (r = .35, p = .01for the full sample and r = .45, p = .001 for controls).
Table 3.
Statistical measures from CCA. CCA was carried out between the rsFC from resting‐state functional connections, as a set of variables with PS and working memory for the full sample, control sample, and patient sample
| Statistical measures from CCA (rsFC and processing speed) | Statistical measures from CCA (rsFC and working memory) | |||
|---|---|---|---|---|
| r | p | r | p | |
| Full sample | .36 | .01 | .35 | .01 |
| Control sample | .34 | .02 | .45 | .003 |
| Patient sample | .49 | .002 | .47 | .002 |
Abbreviations: CCA, canonical correlation analysis; PS, processing speed; rsFC, resting‐state functional connectivity.
In the patient sample, the significant positive associations for PS were found for the AN (r = .26, p = .01) followed by SN3 (r = .24, p = .01); and SN1 (r = .23, p = .02) (Table S3). The significant associations for PS were observed for the SN3 (r = .29, p = .002) followed by SN1 (r = .23, p = .01); rAttN (r = .23, p = .01); and lFPN (r = .22, p = .01) for the full sample (Table S3). For the control sample, the significant association for PS was found for the VN2 (r = .23, p = .002) followed by SN1 (r = .21, p = .007); SMN3 (r = .20, p = .009); DMN3 (r = .19, p = .01); and rAttN (r = .18, p = .02) (Table S3).
Likewise, the significant positive association for WM was observed for the VN1 (r = .25, p = .02) followed by SN3 (r = .25, p = .02); and SMN1 (r = .24, p = .02) for the patient sample. For the full sample, SN3 (r = .21, p = .002) showed the significant associations with WM. None of the networks showed a significant association with WM performance in the sample of controls only (Table S3).
Table S6 showed the CCA results for the cognitive measures and rsFC for between‐network calculations. We found a significant, positive correlation between rsFC and the two cognitive measurements (r = .57, p = 8.0 × 10⁻³ for PS and r = .47, p = .04 for WM) in the patients. The correlation between rsFC and PS remained significant when calculated in the full and control samples independently (r = .41, p = 1.5 × 10⁻³ for full sample and r = .44, p = .02 for controls). Likewise, the correlation with WM was significant in the full sample (r = .35, p = .03), but it was not significant for controls (r = .45 and p = .11). The pattern of association between the rsFC and PS (r = .52, p = 8.4 × 10⁻³) and WM (r = .47, p = .02), derived from multiple networks was related to the ES of the patient‐control differences in the functional networks.
3.3. Overlap of networks in schizophrenia and cognitive deficits
The explanatory power of the associations between functional networks and cognitive measures (correlation coefficients) was plotted against Cohen's d ES with schizophrenia (Figure 4, Table 4). The functional networks that showed the strongest association with diagnosis (e.g., salience, auditory, and default mode) were also those networks most positively associated with PS in the patient sample (r = .64, p = .004). The same trend was observed in the full sample (r = .59, p = .01) and the control (r = .53, p = .03), separately (Figure 4, first column). The same pattern was observed for WM in patients (r = .55, p = .02) and the full sample (r = .56, p = .02), but not for the control sample (r = −.05, p = .84) (Figure 4, second column). The functional networks showing association with diagnosis were also associated with PS corrected for WM, but not with WM corrected for PS (Table S4, Figure S7).
Figure 4.

Correlation analysis between canonical correlation coefficients obtained using resting‐state functional connectivity (rsFC) measures as a set of variables with cognitive measures as another set of variables versus Cohen's d effect size (ES) with schizophrenia. The first column shows the correlation between the canonical correlation coefficients obtained using rsFC measures with processing speed versus the ES (Cohen's d) for diagnosis. The second column shows the correlation between the canonical correlation coefficients obtained using rsFC measures with working memory versus ES (Cohen's d) of diagnosis. The first to third rows show information for the full combined sample (a,b), the control sample (c,d), and the patient sample (e,f) respectively. The correlation analysis was performed between 17 resting‐state subnetworks, with each network comprising of two connections. Positive linear relationships were significant (p < .05), except for working memory in the control sample
Table 4.
Statistical measures from correlation analysis between rsFC measures with cognitive measures versus Cohen's d ES with schizophrenia. Canonical correlation coefficients were computed for rsFC measures with cognitive measures versus the ES of diagnosis represented by the rsFC measures. Seventeen resting‐state subnetworks—each network comprising of two connections—were included in the analysis. Correlations were significant (p < .05), except for the case of working memory in the control sample
| Correlation between rsFC with PS versus Cohen's d ES with schizophrenia | Correlation between rsFC with WM versus Cohen's d ES with schizophrenia | |||
|---|---|---|---|---|
| r | p | r | p | |
| Full sample | .59 | .014 | .56 | .019 |
| Control sample | .53 | .030 | −.05 | .842 |
| Patient sample | .64 | .004 | .55 | .020 |
Abbreviations: ES, effect size; PS, processing speed; rsFC, resting‐state functional connectivity; WM, working memory.
3.4. Symptom severity and medication
The trending negative correlations between rsFC measures and the BPRS and CPZ equivalent were not statistically significant when applying multiple comparisons correction. There were no significant overlaps in the variance shared between rsFC and BPRS and the ESs with schizophrenia (r = .38, p = .12 for full sample, r = .03, p = .9 for control sample, and r = .27, p = .27 for the patient sample).
FTND scores were not statistically correlated to the rsFC measures for any of the resting‐state connections, both for patients and control groups.
4. DISCUSSION
Schizophrenia has been conceptualized as a disorder of cerebral disconnectivity (Baker et al., 2014; Meda et al., 2012). The findings of patient‐control deficits on the rsFC and their impact on cognitive function are inconsistent, possibly due to small number of subjects and differences in the data analyses approaches (Adolphs, 2009; Calhoun & Hugdahl, 2012; Frith & Frith, 2007; Fryer et al., 2015; Geisler et al., 2015). We developed a large mega‐analytic cohort to quantify patient‐control differences in major functional networks. To help interpret our findings, we calculated the association between connectivity indices and performance in two fundamental neurocognitive domains impacted in schizophrenia: PS and WM. We replicated impaired rsFC in the salience, sensorimotor, auditory, default mode, and other functional networks that support cognitive function (Blokland, 2017; Calhoun et al., 2009; Karbasforoushan & Woodward, 2012; Whitfield‐Gabrieli & Ford, 2012) both for within‐network and between‐network resting‐state connectivity. We found that lower rsFC measurements were consistent across three cohorts and two measurement approaches and that no rsFC showed a consistently higher connectivity in patients. The ES of patient‐control differences (Cohen's d ~0.27–0.54) were comparable with ENIGMA's schizophrenia findings in diffusion tensor imaging fractional anisotropy measures (Cohen's d ~0.15–0.40) (Kelly et al., 2018); hippocampal volume (Cohen's d = 0.46) and volume of lateral ventricles (Cohen's d = 0.37) (van Erp et al., 2016). The association between rsFC, PS and WM were replicated in controls that were not ill or exposed to antipsychotic medication. In summary, the lower rsFC indices in patients were consistent, associated with cognitive function and have a potential use as endophenotypes in the imaging research in this disorder.
Our findings of reduced connectivity, both in within‐ and between‐network computations, were consistent with the previous findings in the AN and SN (White, Joseph, Francis, & Liddle, 2010), the DMN (Repovs, Csernansky, & Barch, 2011; Whitfield‐Gabrielia et al., 2009; Woodward et al., 2011). We observed significant reduction in within‐network connectivity for AN and SN that were hypothesized to be associated with development of psychotic symptoms (White et al., 2010). The individuals with schizophrenia in this study exhibited overall decrease in rsFC measures, including the DMN, though hyperactivity and hyperconnectivity in the early stage of schizophrenia and in first‐degree relatives of persons with schizophrenia in DMN has been reported, albeit in smaller cohorts (Fox et al., 2005; Karbasforoushan & Woodward, 2012; Whitfield‐Gabrielia et al., 2009). Significant impairments in between‐network FC, as observed for ROI pairs associated to the AN, SN, DMN, ECN, and SMN in our study, signify that the schizophrenia involves multiple networks (Baker et al., 2014; Li et al., 2018; Mamah, Barch, & Repovs, 2013; Tu, Lee, Chen, Li, & Su, 2013) and the findings of aberrant between‐network connectivity have important implications in the search for the network endophenotype of neuropsychiatric disease (Greicius, Srivastava, Reiss, & Menon, 2004; Seeley et al., 2007).
We evaluated the rsFC underpinning of two neurocognitive functions that showed the largest patient‐control differences in large meta‐analytical studies: PS and WM (Dickinson et al., 2007; Knowles et al., 2010). Both PS and WM abilities rely on large‐scale cerebral networks (Bartzokis, 2012; Bartzokis et al., 2010; Felts et al., 1997; Waxman & Bennett, 1972) and show consistent deficits in schizophrenia (Dickinson et al., 2007; Faraone et al., 2000; Keefe et al., 2004; Keefe et al., 2005; Knowles et al., 2010). We found significant associations between rsFC measures and PS and WM performance, both in terms of the combined sample and in separate subsamples of controls and patients. We should note that the digit symbol task involves WM performance and likewise the digit sequencing task involves PS. The patterns of overlapping rsFC results are likely in part reflecting the overlapping in cognitive domains inherent in these neuropsychological tasks. The SN, AN, and DMN showed the strongest associations with diagnosis and were also the networks associated with PS and WM abilities within the patient sample. The observed a higher correlation in patients compared to controls, within‐ and between‐network connectivity and cognitive measures, may indicate the connectivity is more involved in cognition in patients than in controls. We did not replicate the association between PS, WM, and rsFC measures for FPN although these findings were reported in unmediated first episode individuals with schizophrenia (Anhoj et al., 2018) nor were we able to link PS deficits to frontothalamic connectivity reported in (Chen et al., 2018).
We replicated our findings in controls without the disorder or antipsychotic medications where we found that associations with metrics of rsFC and cognition were network‐specific and similar to the pattern observed in patients. RsFC abnormalities in schizophrenia were pervasive across multiple networks and consistent across three independent cohorts. Moreover, functional network measurements were significantly associated with PS and WM performance; those networks supporting PS and WM showed the largest vulnerability to schizophrenia. RsFC network deficits were not significantly related to medication dose or symptom severity or FTND score, although nicotine has been proved to reduce FC (Li et al., 2018) and affect network‐level functions in schizophrenia (Liao et al., 2018). The overlap between the ES of disorder and the variance in rsFC in patients and controls highlight specific individual networks involved in cognition.
Replicable biological findings in complex disorders often require a large data sample to detect due to moderate ESs (Cohen's d = 0.2–0.6). We used an analytic workflow developed by the ENIGMA consortium to evaluate rsFC deficits in schizophrenia and link them to cognitive functions in a large and representative sample. ENIGMA rsfMRI workflow was developed to alleviate potential pitfalls such as variances in the quality of T1w data and registration biases that are common for data collected using different scanners and protocols. It uses the Marchenko‐Pastur Principal Component Analysis (MPPCA) denoising to improve SNR/tSNR properties of time series data and rsFC measurements were shown to be consistently heritable across multiple cohorts (Adhikari, et al., 2018a).
This study has several limitations. We collected two neurocognitive measures that separate individuals with schizophrenia and controls, based on the pragmatic considerations of collecting a large sample of relevant data. The cognitive measures, PS and WM, were selected for empirical reasons because they showed the largest and the most consistent deficits in schizophrenia compared to controls in multiple meta‐analyses. This may not capture all of the complex constructs involved in PS or WM. In addition, we did not detect correlations of CPZ with rsFC, yet chronic antipsychotic exposure may be a contributing factor.
In conclusion, we found consistent FC deficits across the three sample cohorts in schizophrenia; these rsFC measures are promising endophenotypes for future studies that may involve pharmacological interventions for cognitive enhancement efforts for schizophrenia. We found a significant association of rsFC measures with performance on two neurocognitive measurements: PS and WM in patients and in full sample and controls independently. Functional networks supporting PS and WM showed larger ESs in schizophrenia. Analysis involving large samples will be required for replicable findings.
CONFLICT OF INTEREST
The authors declare no conflict of interest.
Supporting information
Supporting Information
ACKNOWLEDGMENT
Support was received from NIH Blueprint for Neuroscience Research grants U54EB020403, U01MH108148, 2R01EB015611, R01MH112180, R01DA027680, R01MH085646, and T32MH067533.
Adhikari BM, Hong LE, Sampath H, et al. Functional network connectivity impairments and core cognitive deficits in schizophrenia. Hum Brain Mapp. 2019;40:4593–4605. 10.1002/hbm.24723
Funding information NIH Blueprint for Neuroscience Research, Grant/Award Numbers: T32MH067533, R01MH085646, R01DA027680, R01MH112180, 2R01EB015611, U01MH108148, U54EB020403
DATA AVAILABILITY STATEMENT
Data can be made available upon request.
REFERENCES
- Adhikari, B. M. , Jahanshad, N. , Shukla, D. , Glahn, D. C. , Blangero, J. , Reynolds, R. C. , … Kochunov, P. (2018a). Comparison of heritability estimates on resting state fMRI connectivity phenotypes using the ENIGMA analysis pipeline. Human Brain Mapping, 39, 4893–4902. [DOI] [PMC free article] [PubMed] [Google Scholar]
- Adhikari, B. M. , Jahanshad, N. , Shukla, D. K. , Turner, J. A. , Grotegerd, D. , Dannlowski, U. , … Kochunov, P. (2018). A resting state fMRI analysis pipeline for pooling inference across diverse cohorts: An ENIGMA rs‐fMRI protocol. Brain Imaging and Behavior. 10.1007/s11682-018-9941-x [DOI] [PMC free article] [PubMed] [Google Scholar]
- Adhikari, B. M. , Jahanshad, N. , Shukla, D. K. , Glahn, D. C. , Blangero, J. , Reynolds, R. C. , … Kochunov, P. (2018b). Heritability estimates on resting state fMRI data using ENIGMA analysis pipeline. Pacific Symposium on Biocomputing, 23, 307–318. [PMC free article] [PubMed] [Google Scholar]
- Adolphs, R. (2009). The social brain: Neural basis of social knowledge. Annual Review of Psychology, 60, 693–716. [DOI] [PMC free article] [PubMed] [Google Scholar]
- Alba‐Ferrara, L. M. , & de Erausquin, G. A. (2013). What does anisotropy measure? Insights from increased and decreased anisotropy in selective fiber tracts in schizophrenia. Frontiers in Integrative Neuroscience, 7, 9. [DOI] [PMC free article] [PubMed] [Google Scholar]
- Anhoj, S. , Odegaard Nielsen, M. , Jensen, M. H. J. , Ford, K. , Fagerlund, B. , Williamson, P. , … Rostrup, E. (2018). Alterations of intrinsic connectivity networks in antipsychotic‐naive first‐episode schizophrenia. Schizophrenia Bulletin, 44, 1332–1340. [DOI] [PMC free article] [PubMed] [Google Scholar]
- Baker, J. T. , Holmes, A. J. , Masters, G. A. , Yeo, B. T. , Krienen, F. , Buckner, R. L. , & Ongur, D. (2014). Disruption of cortical association networks in schizophrenia and psychotic bipolar disorder. JAMA Psychiatry, 71, 109–118. [DOI] [PMC free article] [PubMed] [Google Scholar]
- Barch, D. M. , & Ceaser, A. (2012). Cognition in schizophrenia: Core psychological and neural mechanisms. Trends in Cognitive Sciences, 16, 27–34. [DOI] [PMC free article] [PubMed] [Google Scholar]
- Bartzokis, G. (2012). Neuroglial pharmacology: Myelination as a shared mechanism of action of psychotropic treatments. Neuropharmacology, 62, 2137–2153. [DOI] [PMC free article] [PubMed] [Google Scholar]
- Bartzokis, G. , Lu, P. H. , Tingus, K. , Mendez, M. F. , Richard, A. , Peters, D. G. , … Mintz, J. (2010). Lifespan trajectory of myelin integrity and maximum motor speed. Neurobiology of Aging, 31, 1554–1562. [DOI] [PMC free article] [PubMed] [Google Scholar]
- Bassett, D. S. , Nelson, B. G. , Mueller, B. A. , Camchong, J. , & Lim, K. O. (2012). Altered resting state complexity in schizophrenia. NeuroImage, 59, 2196–2207. [DOI] [PMC free article] [PubMed] [Google Scholar]
- Blokland, G. A. M. (2017). The genetics of endophenotypes of neurofunction to understand schizophrenia (GENUS) consortium: A collaborative cognitive and neuroimaging genetics project. Schizophrenia Research, 195, 306–317. [DOI] [PMC free article] [PubMed] [Google Scholar]
- Bowie, C. R. , & Harvey, P. D. (2006). Cognitive deficits and functional outcome in schizophrenia. Neuropsychiatric Disease and Treatment, 2, 531–536. [DOI] [PMC free article] [PubMed] [Google Scholar]
- Calhoun, V. D. , Eichele, T. , & Pearlson, G. (2009). Functional brain networks in schizophrenia: A review. Frontiers in Human Neuroscience, 3, 17. [DOI] [PMC free article] [PubMed] [Google Scholar]
- Calhoun, V. D. , & Hugdahl, K. (2012). Cognition and neuroimaging in schizophrenia. Frontiers in Human Neuroscience, 6, 1–2. [DOI] [PMC free article] [PubMed] [Google Scholar]
- Chen, P. , Ye, E. , Jin, X. , Zhu, Y. , & Wang, L. (2018). Association between thalamocortical functional connectivity abnormalities and cognitive deficits in schizophrenia. Scientific Reports, 9, 2952–2952. [DOI] [PMC free article] [PubMed] [Google Scholar]
- Cox, R. W. (1996). AFNI: Software for analysis and visualization of functional magnetic resonance neuroimages. Computers and Biomedical Research, 29, 162–173. [DOI] [PubMed] [Google Scholar]
- Coyle, T. R. , Pillow, D. R. , Snyder, A. C. , & Kochunov, P. (2011). Processing speed mediates the development of general intelligence (g) in adolescence. Psychological Science, 22, 1265–1269. [DOI] [PMC free article] [PubMed] [Google Scholar]
- Dickinson, D. , Ramsey, M. E. , & Gold, J. M. (2007). Overlooking the obvious: A meta‐analytic comparison of digit symbol coding tasks and other cognitive measures in schizophrenia. Archives of General Psychiatry, 64, 532–542. [DOI] [PubMed] [Google Scholar]
- Ellison‐Wright, I. , & Bullmore, E. (2009). Meta‐analysis of diffusion tensor imaging studies in schizophrenia. Schizophrenia Research, 108, 3–10. [DOI] [PubMed] [Google Scholar]
- Faraone, S. V. , Seidman, L. J. , Kremen, W. S. , Toomey, R. , Pepple, J. R. , & Tsuang, M. T. (2000). Neuropsychologic functioning among the nonpsychotic relatives of schizophrenic patients: The effect of genetic loading. Biological Psychiatry, 48, 120–126. [DOI] [PubMed] [Google Scholar]
- Farzan, F. , Barr, M. S. , Levinson, A. J. , Chen, R. , Wong, W. , Fitzgerald, P. B. , & Daskalakis, Z. J. (2010). Evidence for gamma inhibition deficits in the dorsolateral prefrontal cortex of patients with schizophrenia. Brain, 133, 1505–1514. [DOI] [PubMed] [Google Scholar]
- Felts, P. A. , Baker, T. A. , & Smith, K. J. (1997). Conduction in segmentally demyelinated mammalian central axons. The Journal of Neuroscience, 17, 7267–7277. [DOI] [PMC free article] [PubMed] [Google Scholar]
- Fornito, A. , & Bullmore, E. T. (2010). What can spontaneous fluctuations of the blood oxygenation‐level‐dependent signal tell us about psychiatric disorders? Current Opinion in Psychiatry, 23, 239–249. [DOI] [PubMed] [Google Scholar]
- Fox, M. D. , Snyder, A. Z. , Vincent, J. L. , Corbetta, M. , Van Essen, D. C. , & Raichle, M. E. (2005). The human brain is intrinsically organized into dynamic, anticorrelated functional networks. Proceedings of the National Academy of Sciences of the United States of America, 102, 9673–9678. [DOI] [PMC free article] [PubMed] [Google Scholar]
- Friedman, J. I. , Tang, C. , Carpenter, D. , Buchsbaum, M. , Schmeidler, J. , Flanagan, L. , … Davis, K. L. (2008). Diffusion tensor imaging findings in first‐episode and chronic schizophrenia patients. The American Journal of Psychiatry, 165, 1024–1032. [DOI] [PubMed] [Google Scholar]
- Frith, C. D. , & Frith, U. (2007). Social cognition in humans. Current Biology, 17, R724–R732. [DOI] [PubMed] [Google Scholar]
- Fryer, S. L. , Roach, B. J. , Ford, J. M. , Turner, J. A. , van Erp, T. G. , Voyvodic, J. , … Mathalon, D. H. (2015). Relating intrinsic low‐frequency BOLD cortical oscillations to cognition in schizophrenia. Neuropsychopharmacology, 40, 2705–2714. [DOI] [PMC free article] [PubMed] [Google Scholar]
- Geisler, E. W. , Naylor, M. , Roessner, V. , Lim, K. O. , Schulz, S. C. , Gollub, R. L. , … Ehrlich, S. (2015). Brain structure and function correlates of cognitive subtypes in schizophrenia. Psychiatry Research: Neuroimaging, 234, 78–83. [DOI] [PMC free article] [PubMed] [Google Scholar]
- Glahn, D. C. , Kent, J. W., Jr. , Sprooten, E. , Diego, V. P. , Winkler, A. M. , Curran, J. E. , … Blangero, J. (2013). Genetic basis of neurocognitive decline and reduced white‐matter integrity in normal human brain aging. Proceedings of the National Academy of Sciences of the United States of America, 110, 19006–19011. [DOI] [PMC free article] [PubMed] [Google Scholar]
- Godwin, D. , Ji, A. , Kandala, S. , & Mamah, D. (2017). Functional connectivity of cognitive brain networks in schizophrenia during a working memory task. Frontiers in Psychiatry, 8, 294. [DOI] [PMC free article] [PubMed] [Google Scholar]
- Greicius, M. D. , Srivastava, G. , Reiss, A. L. , & Menon, V. (2004). Default‐mode network activity distinguishes Alzheimer's disease from healthy aging: Evidence from functional MRI. Proceedings of the National Academy of Sciences of the United States of America, 101, 4637–4642. [DOI] [PMC free article] [PubMed] [Google Scholar]
- Heatherton, T. F. , Kozlowski, L. T. , Frecker, R. C. , & Fagerstorm, K.‐O. (1991). The Fagerstrom test for nicotine dependence: A revision of the Fagerstrom tolerance questionnaire. British Journal of Addiction, 86, 1119–1127. [DOI] [PubMed] [Google Scholar]
- Hedlund, J. L. , & Vieweg, B. W. (1980). The brief psychiatric rating scale (BPRS): A comprehensive review. Journal of Operational Psychiatry, 11, 49–65. [Google Scholar]
- Jahanshad, N. , Kochunov, P. V. , Sprooten, E. , Mandl, R. C. , Nichols, T. E. , Almasy, L. , … Glahn, D. C. (2013). Multi‐site genetic analysis of diffusion images and voxelwise heritability analysis: A pilot project of the ENIGMA‐DTI working group. NeuroImage, 81, 455–469. [DOI] [PMC free article] [PubMed] [Google Scholar]
- Karbasforoushan, H. , Duffy, B. , Blackford, J. U. , & Woodward, N. D. (2015). Processing speed impairment in schizophrenia is mediated by white matter integrity. Psychological Medicine, 45, 109–120. [DOI] [PMC free article] [PubMed] [Google Scholar]
- Karbasforoushan, H. , & Woodward, N. D. (2012). Resting‐state networks in schizophrenia. Current Topics in Medicinal Chemistry, 12, 2404–2414. [DOI] [PubMed] [Google Scholar]
- Keefe, R. S. , Eesley, C. E. , & Poe, M. P. (2005). Defining a cognitive function decrement in schizophrenia. Biological Psychiatry, 57, 688–691. [DOI] [PubMed] [Google Scholar]
- Keefe, R. S. , Goldberg, T. E. , Harvey, P. D. , Gold, J. M. , Poe, M. P. , & Coughenour, L. (2004). The brief assessment of cognition in schizophrenia: Reliability, sensitivity, and comparison with a standard neurocognitive battery. Schizophrenia Research, 68, 283–297. [DOI] [PubMed] [Google Scholar]
- Kelly, S. , Jahanshad, N. , Zalesky, A. , Kochunov, P. , Agartz, I. , Alloza, C. , … Donohoe, G. (2018). Widespread white matter microstructural differences in schizophrenia across 4322 individuals: Results from the ENIGMA schizophrenia DTI working group. Molecular Psychiatry, 23, 1261–1269. [DOI] [PMC free article] [PubMed] [Google Scholar]
- Knowles, E. E. , David, A. S. , & Reichenberg, A. (2010). Processing speed deficits in schizophrenia: Reexamining the evidence. The American Journal of Psychiatry, 167, 828–835. [DOI] [PubMed] [Google Scholar]
- Kochunov, P. , Coyle, T. , Rowland, L. , Jahanshad, N. , Thompson, P. , Kelly, S. , … Hong, L. E. (2017). White matter and core cognitive deficits in schizophrenia. JAMA Psychiatry, 74(9), 958–966. [DOI] [PMC free article] [PubMed] [Google Scholar]
- Kochunov, P. , Dickie, E. W. , Viviano, J. D. , Turner, J. , Kingsley, P. B. , Jahanshad, N. , … Voineskos, A. N. (2018). Integration of routine QA data into mega‐analysis may improve quality and sensitivity of multisite diffusion tensor imaging studies. Human Brain Mapping, 39, 1015–1023. [DOI] [PMC free article] [PubMed] [Google Scholar]
- Kochunov, P. , Ganjgahi, H. , Winkler, A. , Kelly, S. , Shukla, D. K. , Du, X. , … Hong, L. E. (2016). Heterochronicity of white matter development and aging explains regional patient control differences in schizophrenia. Human Brain Mapping, 37, 4673–4688. [DOI] [PMC free article] [PubMed] [Google Scholar]
- Kochunov, P. , Jahanshad, N. , Sprooten, E. , Nichols, T. E. , Mandl, R. C. , Almasy, L. , … Glahn, D. C. (2014). Multi‐site study of additive genetic effects on fractional anisotropy of cerebral white matter: Comparing meta and megaanalytical approaches for data pooling. NeuroImage, 95, 136–150. [DOI] [PMC free article] [PubMed] [Google Scholar]
- Kochunov, P. , Rowland, L. M. , Fieremans, E. , Veraart, J. , Jahanshad, N. , Eskandar, G. , … Hong, L. E. (2016). Diffusion‐weighted imaging uncovers likely sources of processing‐speed deficits in schizophrenia. Proceedings of the National Academy of Sciences of the United States of America, 113, 13504–13509. [DOI] [PMC free article] [PubMed] [Google Scholar]
- Kubicki, M. , McCarley, R. , Westin, C. F. , Park, H. J. , Maier, S. , Kikinis, R. , … Shenton, M. E. (2007). A review of diffusion tensor imaging studies in schizophrenia. Journal of Psychiatric Research, 41, 15–30. [DOI] [PMC free article] [PubMed] [Google Scholar]
- Li, M. , Becker, B. , Zheng, J. , Zhang, Y. , Chen, H. , Liao, W. , … Chen, H. (2018). Dysregulated maturation of the functional connectome in antipsychotic‐naive, first‐episode patients with adolescent‐onset schizophrenia. Schizophrenia Bulletin, 10.1093/schbul/sbyo63. [DOI] [PMC free article] [PubMed] [Google Scholar]
- Li, P. , Fan, T. T. , Zhao, R. J. , Han, Y. , Shi, L. , Sun, H. Q. , … Lu, L. (2017). Altered brain network connectivity as a potential endophenotype of schizophrenia. Scientific Reports, 7, 5483. [DOI] [PMC free article] [PubMed] [Google Scholar]
- Liang, M. , Zhou, Y. , Jiang, T. , Liu, Z. , Tian, L. , Liu, H. , & Hao, Y. (2006). Widespread functional disconnectivity in schizophrenia with resting‐state functional magnetic resonance imaging. Neuroreport, 17, 209–213. [DOI] [PubMed] [Google Scholar]
- Liao, W. , Fan, Y. S. , Yang, S. , Li, J. , Duan, X. , Cui, Q. , & Chen, H. (2018). Preservation effect: Cigarette smoking acts on the dynamic of influences among unifying neuropsychiatric triple networks in schizophrenia. Schizophrenia Bulletin, 10.1093/schbul/sby184. [DOI] [PMC free article] [PubMed] [Google Scholar]
- Mamah, D. , Barch, D. M. , & Repovs, G. (2013). Resting state functional connectivity of five neural networks in bipolar disorder and schizophrenia. Journal of Affective Disorders, 150, 601–609. [DOI] [PMC free article] [PubMed] [Google Scholar]
- Meda, S. A. , Gill, A. , Stevens, M. C. , Lorenzoni, R. P. , Glahn, D. C. , Calhoun, V. D. , … Pearlson, G. D. (2012). Differences in resting‐state functional magnetic resonance imaging functional network connectivity between schizophrenia and psychotic bipolar probands and their unaffected first‐degree relatives. Biological Psychiatry, 71, 881–889. [DOI] [PMC free article] [PubMed] [Google Scholar]
- Nazeri, A. , Mallar Chakravarty, M. , Felsky, D. , Lobaugh, N. J. , Rajji, T. K. , Mulsant, B. H. , & Voineskos, A. N. (2012). Alterations of superficial white matter in schizophrenia and relationship to cognitive performance. Neuropsychopharmacology, 38, 1954–1962. [DOI] [PMC free article] [PubMed] [Google Scholar]
- Park, S. , & Holzman, P. S. (1992). Schizophrenics show spatial working memory deficits. Archives of General Psychiatry, 49, 975–982. [DOI] [PubMed] [Google Scholar]
- Perez‐Iglesias, R. , Tordesillas‐Gutierrez, D. , McGuire, P. K. , Barker, G. J. , Roiz‐Santianez, R. , Mata, I. , … Crespo‐Facorro, B. (2011). White matter integrity and cognitive impairment in first‐episode psychosis. The American Journal of Psychiatry, 167, 451–458. [DOI] [PubMed] [Google Scholar]
- Phillips, K. A. , Rogers, J. , Barrett, E. A. , Glahn, D. C. , & Kochunov, P. (2012). Genetic contributions to the midsagittal area of the corpus callosum. Twin Research and Human Genetics, 15, 315–323. [DOI] [PMC free article] [PubMed] [Google Scholar]
- Reichenberg, A. , & Harvey, P. D. (2007). Neuropsychological impairments in schizophrenia: Integration of performance‐based and brain imaging findings. Psychological Bulletin, 133, 833–858. [DOI] [PubMed] [Google Scholar]
- Repovs, G. , Csernansky, J. G. , & Barch, D. M. (2011). Brain network connectivity in individuals with schizophrenia and their siblings. Biological Psychiatry, 69, 967–973. [DOI] [PMC free article] [PubMed] [Google Scholar]
- Salthouse, T. A. (2009). When does age‐related cognitive decline begin? Neurobiology of Aging, 30, 507–514. [DOI] [PMC free article] [PubMed] [Google Scholar]
- Seeley, W. W. , Menon, V. , Schatzberg, A. F. , Keller, J. , Glover, G. H. , Kenna, H. , … Greicius, M. D. (2007). Dissociable intrinsic connectivity networks for salience processing and executive control. The Journal of Neuroscience, 27, 2349–2356. [DOI] [PMC free article] [PubMed] [Google Scholar]
- Sitskoorn, M. M. , Aleman, A. , Ebisch, S. J. , Appels, M. C. , & Kahn, R. S. (2004). Cognitive deficits in relatives of patients with schizophrenia: A meta‐analysis. Schizophrenia Research, 71, 285–295. [DOI] [PubMed] [Google Scholar]
- Smith, S. M. , Fox, P. T. , Miller, K. L. , Glahn, D. C. , Fox, P. M. , Mackay, C. E. , … Beckmann, C. F. (2009). Correspondence of the brain's functional architecture during activation and rest. Proceedings of the National Academy of Sciences of the United States of America, 106, 13040–13045. [DOI] [PMC free article] [PubMed] [Google Scholar]
- Stotesbury, H. , Kirkham, F. J. , Kolbel, M. , Balfour, P. , Clayden, J. D. , Sahota, S. , … Kawadler, J. M. (2018). White matter integrity and processing speed in sickle cell anemia. Neurology, 90, e2042#x2013;e2050. [DOI] [PMC free article] [PubMed] [Google Scholar]
- Tu, P. C. , Lee, Y. C. , Chen, Y. S. , Li, C. T. , & Su, T. P. (2013). Schizophrenia and the brain's control network: Aberrant within‐ and between‐network connectivity of the frontoparietal network in schizophrenia. Schizophrenia Research, 147, 339–347. [DOI] [PubMed] [Google Scholar]
- Uhlhaas, P. J. , & Singer, W. (2010). Abnormal neural oscillations and synchrony in schizophrenia. Nature Reviews. Neuroscience, 11, 100–113. [DOI] [PubMed] [Google Scholar]
- Uurtio, V. , Monteiro, J. M. , Kandola, J. , Shawe‐Taylor, J. , Fernandez‐Reyes, D. , & Rousu, J. (2017). A tutorial on canonical correlation Methods. ACM Computing Survey, 50:Article 95, 1–33. 10.1145/3136624 [DOI] [Google Scholar]
- van Erp, T. G. , Hibar, D. P. , Rasmussen, J. M. , Glahn, D. C. , Pearlson, G. D. , Andreassen, O. A. , … Turner, J. A. (2016). Subcortical brain volume abnormalities in 2028 individuals with schizophrenia and 2540 healthy controls via the ENIGMA consortium. Molecular Psychiatry, 21, 547–553. [DOI] [PMC free article] [PubMed] [Google Scholar]
- Veraart, J. , Fieremans, E. , & Novikov, D. S. (2016). Diffusion MRI noise mapping using random matrix theory. Magnetic Resonance in Medicine, 76, 1582–1593. [DOI] [PMC free article] [PubMed] [Google Scholar]
- Veraart, J. , Novikov, D. S. , Christiaens, D. , Ades‐Aron, B. , Sijbers, J. , & Fieremans, E. (2016). Denoising of diffusion MRI using random matrix theory. NeuroImage, 142, 394–406. [DOI] [PMC free article] [PubMed] [Google Scholar]
- Waxman, S. G. , & Bennett, M. V. (1972). Relative conduction velocities of small myelinated and non‐myelinated fibres in the central nervous system. Nature: New Biology, 238, 217–219. [DOI] [PubMed] [Google Scholar]
- Wechsler, D. (1997). Wechsler Adult Intelligence Scale (3rd ed.). San Antonio, TX: Psychological Corporation. [Google Scholar]
- White, T. P. , Joseph, V. , Francis, S. T. , & Liddle, P. F. (2010). Aberrant salience network (bilateral insula and anterior cingulate cortex) connectivity during information processing in schizophrenia. Schizophrenia Research, 123, 105–115. [DOI] [PubMed] [Google Scholar]
- Whitfield‐Gabrieli, S. , & Ford, J. M. (2012). Default mode network activity and connectivity in psychopathology. Annual Review of Clinical Psychology, 8, 49–76. [DOI] [PubMed] [Google Scholar]
- Whitfield‐Gabrielia, S. , Thermenos, H. W. , Milanovic, S. , Tsuang, M. T. , Faraone, S. V. , McCarley, R. W. , … Seidman, L. J. (2009). Hyperactivity and hyperconnectivity of the default network in schizophrenia and in first‐degree relatives of persons with schizophrenia. Proceedings of the National Academy of Sciences of the United States of America, 106, 1279–1284. [DOI] [PMC free article] [PubMed] [Google Scholar]
- Woods, S. W. (2003). Chlorpromazine equivalent doses for the newer atypical antipsychotics. The Journal of Clinical Psychiatry, 64, 663–667. [DOI] [PubMed] [Google Scholar]
- Woodward, N. D. , Rogers, B. , & Heckers, S. (2011). Functional resting‐state networks are differentially affected in schizophrenia. Schizophrenia Research, 130, 86–93. [DOI] [PMC free article] [PubMed] [Google Scholar]
- Wright, S. N. , Hong, L. E. , Winkler, A. M. , Chiappelli, J. , Nugent, K. , Muellerklein, F. , … Kochunov, P. (2015). Perfusion shift from white to gray matter may account for processing speed deficits in schizophrenia. Human Brain Mapping, 36, 3793–3804. [DOI] [PMC free article] [PubMed] [Google Scholar]
- Yu, Q. , Allen, E. A. , Sui, J. , Arbabshirani, M. R. , Pearlson, G. , & Calhoun, V. D. (2012). Brain connectivity networks in schizophrenia underlying resting state functional magnetic resonance imaging. Current Topics in Medicinal Chemistry, 12, 2415–2425. [DOI] [PMC free article] [PubMed] [Google Scholar]
Associated Data
This section collects any data citations, data availability statements, or supplementary materials included in this article.
Supplementary Materials
Supporting Information
Data Availability Statement
Data can be made available upon request.