

Abstract
Brain responses to transcranial magnetic stimulation (TMS) recorded by electroencephalography (EEG) are emergent noninvasive markers of neuronal excitability and effective connectivity in humans. However, the underlying physiology of these TMS‐evoked EEG potentials (TEPs) is still heavily underexplored, impeding a broad application of TEPs to study pathology in neuropsychiatric disorders. Here we tested the effects of a single oral dose of three antiepileptic drugs with specific modes of action (carbamazepine, a voltage‐gated sodium channel (VGSC) blocker; brivaracetam, a ligand to the presynaptic vesicle protein VSA2; tiagabine, a gamma‐aminobutyric acid (GABA) reuptake inhibitor) on TEP amplitudes in 15 healthy adults in a double‐blinded randomized placebo‐controlled crossover design. We found that carbamazepine decreased the P25 and P180 TEP components, and brivaracetam the N100 amplitude in the nonstimulated hemisphere, while tiagabine had no effect. Findings corroborate the view that the P25 represents axonal excitability of the corticospinal system, the N100 in the nonstimulated hemisphere propagated activity suppressed by inhibition of presynaptic neurotransmitter release, and the P180 late activity particularly sensitive to VGSC blockade. Pharmaco‐physiological characterization of TEPs will facilitate utilization of TMS‐EEG in neuropsychiatric disorders with altered excitability and/or network connectivity.
Keywords: brivaracetam, carbamazepine, electroencephalography, excitability, human cortex, tiagabine, TMS‐evoked EEG response, transcranial magnetic stimulation
1. INTRODUCTION
Many neuropsychiatric disorders are caused by or associated with abnormal neuronal excitability and/or network connectivity. However, it is still difficult to measure these abnormalities noninvasively. Transcranial magnetic stimulation (TMS) evoked electroencephalographic (EEG) potentials (TEPs) provide a relatively novel technique to test excitability and connectivity of the human brain (Chung, Rogasch, Hoy, & Fitzgerald, 2015; Ilmoniemi et al., 1997; Ilmoniemi & Kicic, 2010; Rogasch & Fitzgerald, 2013; Ziemann, 2011). However, the physiological mechanisms underlying TEPs remain heavily underexplored impeding their clinical application, even though several studies have used them to study a variety of patients, for instance with epilepsy (Julkunen et al., 2013; Kimiskidis et al., 2017; Shafi et al., 2015; Ter Braack, Koopman, & van Putten, 2016; Valentin et al., 2008), traumatic brain injury (Bashir et al., 2012), multiple sclerosis (Zipser et al., 2018), stroke (Pellicciari et al., 2018), Alzheimer's disease (Ferreri et al., 2016), or depression (Sun et al., 2016).
When TMS is applied to the primary motor cortex (M1) then a typical sequence of TEPs can be recorded that are named according to their relative polarity and latency (in ms): P25, N45, P70, N100, and P180 (Bonato, Miniussi, & Rossini, 2006; Lioumis, Kicic, Savolainen, Makela, & Kahkonen, 2009). One way to characterize the physiology of these TEPs is to test their changes in healthy subjects under challenge with central nervous system active drugs, which have specific modes action (Ziemann et al., 2015). Neurotransmission through the gamma‐butyric acid type A (GABAA) receptor contributes to the N45 potential because positive modulators at the GABAA receptor, such as benzodiazepines and zolpidem, and the SV2A ligand levetiracetam increased the N45 potential amplitude (Premoli et al., 2014; Premoli, Biondi, Carlesso, Rivolta, & Richardson, 2017; Premoli, Costantini, Rivolta, Biondi, & Richardson, 2017), whereas S44819, a specific antagonist of the alpha‐5 subunit bearing subtype of the GABAA receptor decreased it (Darmani et al., 2016). Moreover, neurotransmission through the GABAB receptor contributes to the N100 potential because baclofen, a specific agonist at the GABAB receptor, increased the N100 potential amplitude at the site of stimulation (Premoli, Castellanos, et al., 2014). Positive modulators at the GABAA receptor resulted in a decrease of the N100 potential in frontal areas of the nonstimulated hemisphere, suggesting that propagation of neuronal activity into areas remote from the stimulation site is under the control of neurotransmission through the GABAA receptor (Ferrarelli et al., 2010; Premoli, Castellanos, et al., 2014). Finally, late TEP components, such as the P180 may be controlled by axonal excitability, as the voltage‐gated sodium channel (VGSC) blocker lamotrigine resulted in a depression of the P180 amplitude (Premoli, Costantini, et al., 2017).
Here we extend previous findings by studying the effects of carbamazepine (CBZ), brivaracetam (BRV) and tiagabine (TGB) on cortical excitability and inhibition in healthy human subjects testing both TMS evoked electromyographic (EMG) and TMS‐EEG responses. Drugs were chosen because of their common use as antiepileptic drugs and well‐defined specific modes of action: CBZ is a VGSC blocker (Macdonald, 1995), BRV decreases neuronal excitability primarily through selective binding to the presynaptic vesicle protein SV2A (Klein, Diaz, Gasalla, & Whitesides, 2018; Klitgaard et al., 2016), and TGB is a selective GABA reuptake inhibitor (Suzdak & Jansen, 1995). Subjects received a single oral dose of CBZ, BRV, or TGB in a double‐blinded, randomized, placebo‐controlled crossover design. The study was exploratory but, given the previous pharmaco‐TMS‐EEG data, we expected suppression of the P180 under CBZ and, possibly, an increase of N45 under BRV, although the detailed modes of action of BRV and levetiracetam are different, with levetiracetam but not BRV showing relevant inhibitory action on glutamatergic neurotransmission through AMPA and NMDA receptors (Lee, Chen, & Liou, 2009; Niespodziany et al., 2017).
We consider this work important to elucidate the physiological underpinnings of TEPs, potentially to use them in the future as biomarkers to inform on specific abnormalities in excitability and/or connectivity of human cortex.
2. MATERIALS AND METHODS
2.1. Participants
Fifteen right‐handed healthy male volunteers (mean age = 28 years, SD = 2.6 years, age range: 22–33 years) were recruited to participate in the study. Right‐handedness was confirmed using the Edinburgh handedness inventory (laterality score ≥ 75%, [Oldfield, 1971]). All participants gave written informed consent prior to study enrolment. Participants underwent a physical and neurological examination followed by a structured clinical interview to exclude subjects with conditions that would predispose them to potential adverse effects related to TMS, MRI, or any of the study drugs (Rossini et al., 2015). The general exclusion criteria included (a) drug or alcohol abuse, (b) any history of neurological or psychiatric diseases, (c) a history of cardiac, hematopoietic, liver and/or kidney disease, (d) current use of CNS active drugs, (e) a family history of epilepsy, and (f) contraindications to the study medications (CBZ, BRV, and TGB). To screen for atrioventricular block, a 12‐channel ECG was performed at the inclusion visit. The experiments were conducted in accordance with the Declaration of Helsinki and approved by the ethics committee of the Medical Faculty of Eberhard‐Karls‐University Tübingen (protocol 026/2016BO1).
2.2. Experimental design
The study followed a double‐blinded, placebo‐controlled crossover design, measuring motor‐evoked potentials (MEPs), and TMS‐evoked EEG potentials (TEPs) in response to single‐ and paired‐pulse TMS of the left M1 hand area before (pre) and after (post) administration of either of the three study drugs or placebo. Subjects participated in four experimental sessions in pseudo‐randomized order, balanced across subjects, and separated by at least 1 week to avoid carry‐over effects from the previous session. Study drugs were: (a) CBZ, a VGSC blocker (Macdonald, 1995), (b) BRV, a specific ligand to the presynaptic vesicle protein SV2A with high affinity and selectivity (Klein et al., 2018; Klitgaard et al., 2016), and (c) TGB, a selective GABA reuptake inhibitor (Suzdak & Jansen, 1995). The timeline of an experimental session is illustrated in Figure 1. Resting motor threshold (RMT), the TMS intensity to elicit MEPs of 1 mV peak‐to‐peak amplitude (SI1mV), short‐interval intracortical inhibition (SICI) intensity curves, MEP input–output curves, resting state EEG (rs‐EEG), and TMS‐evoked EEG potentials (TEPs) were measured prior to study drug intake (predrug measurements) and again following a defined waiting period after study drug intake (postdrug measurements).
Figure 1.
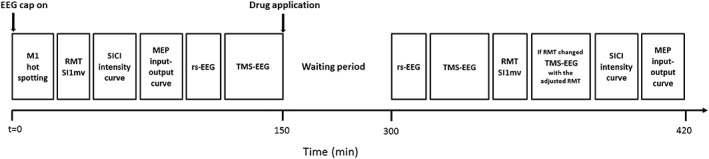
Time line of an experimental session
Drug dosages were chosen based on effective standard daily doses in the (chronic) treatment of epilepsy patients and according to previous TMS‐EMG reports (Sommer et al., 2012; Werhahn, Kunesch, Noachtar, Benecke, & Classen, 1999; Ziemann et al., 2015; Ziemann, Lönnecker, Steinhoff, & Paulus, 1996). Single dosages of either CBZ 600 mg (Carbamazepine AbZ®, AbZ‐Pharma GmbH), BRV 100 mg (Briviact®, UCB Pharma SA), TGB 15 mg (Gabitril®, Cephalon UK Ltd.) or placebo (P‐Tabletten Lichtenstein, Winthrop) were administered (Table 1). A common waiting period of 150 min was chosen based upon the drugs individual t max, and upon TMS studies that previously demonstrated an effect on cortical excitability and/or GABAergic activity after this waiting period (Werhahn et al., 1999; Ziemann, Lönnecker, et al., 1996). Placebo tablets had roughly the same size as CBZ, BRV, and TGB, and subjects were asked to close their eyes before tablet intake in order to prevent recognition of the tablet by color.
Table 1.
Pharmacokinetics for the study drugs and placebo
| Drug | Dosage | Administration form | Median t max (range) | Median t 1/2 (range) |
|---|---|---|---|---|
| CBZ | 600 mg | Tablet | 4.5 (4.0–5.0) | 45.0 (25.0–65.0) |
| BRV | 100 mg | Tablet | 1.0 (0.25–3.0) | 9.0 (N.R.) |
| TGB | 15 mg | Tablet | 0.75 | 8.0 (7.0–9‐0) |
| PBO | N.A. | Tablet | N.A. | N.A. |
CBZ = carbamazepine; BRV = brivaracetam; TGB = tiagabine; PBO = placebo; Median t max = time to peak plasma concentrations (in hr); Median t 1/2 = median biological half‐life (in hr) of the substances as given in the full prescribing information of each medication, respectively (resources: US food and drug administration, FDA); N.R. = not reported; N.A. = not applicable.
Prior to the first session, a high‐resolution T1‐weighted anatomical magnetic resonance (MR) image (voxel size = 1 × 1 × 1 mm; FoV read = 250, FoV phase = 93.8%, TR = 2,300 ms, TE = 4.18 ms, FA = 9.0°) was obtained from each subject using a 3 T MRI scanner (Magnetom Prismafit, syngo MR D13D; Siemens) to allow neuronavigation of the TMS coil. In each experimental session, predrug TMS measurements were conducted either at 8:00 a.m. or 10:30 a.m. (always at the same time for a given participant) after participants had a light caffeine‐free breakfast. One hour after drug intake a cereal bar (without chocolate) was ingested. During the waiting period subjects were located in the waiting area of the lab, where they could be monitored constantly (in order to prevent sleeping and to monitor possible adverse effects). At 1:00 p.m. or 3:30 p.m., respectively, postdrug TMS measurements were started. The total experimental session time was 6:35 h ± 20 min [mean ± SD]. To control for blood pressure changes during the experimental sessions, blood pressure was measured at the beginning of each session, immediately prior to drug intake, 1 and 2 hr post drug intake, and at the end of the session. All 15 subjects participated in four experimental sessions, however, only a subset of 12 subjects was able to complete the experimental session after taking TGB. Three subjects experienced adverse effects in the TGB session including dizziness, nausea, vomiting, somnolence, coordination problems, concentration difficulties, confusion, and nervousness. In these subjects, the postdrug measurements could not be obtained.
2.3. Experimental procedures and data recording
2.3.1. Transcranial magnetic stimulation
Subjects were seated in a comfortable reclining armchair and watched a fixation point directly in front of them. To reduce head movement, a vacuum pillow was placed around the neck. Monophasic TMS pulses were delivered through a 90‐mm figure‐of‐eight coil using a Magstim 200 stimulator (Magstim Co., Whitland, UK), in case of single‐pulse TMS, or two Magstim 200 stimulators connected by a BiStim module, in case of paired‐pulse TMS. To ensure reproducibility of the stimulation site across sessions, we used a frameless stereotactic neuronavigation system (Localite GmbH, Sankt Augustin, Germany) to digitize EEG electrode positions and to navigate the TMS coil based on each subject's anatomical MRI scan. To have a comparable EEG cap positioning across sessions, EEG electrode positions were digitalized at the beginning of the first session individually and cap position was kept identical in the following sessions with the help of the stored electrode positions (this is an important step to obtain comparable TEP results for the different sessions). The TMS coil was placed tangentially to the scalp and perpendicular to the central sulcus to optimally excite corticospinal motor neurons in M1 with an induced current direction in the brain from posterior to anterior (Di Lazzaro, Ziemann, & Lemon, 2008; Mills, Boniface, & Schubert, 1992). Then the coil position was optimized individually to evoke the largest and most consistent responses (MEPs) in the relaxed abductor pollicis brevis (APB) muscle of the right hand at a marginally suprathreshold stimulus intensity. The coil was maintained at the desired position with the help of a holding arm (Magic Arm, Manfrotto, Cassola, Italy) and coil position was monitored in real‐time by the neuronavigation system to ensure targeting consistency.
Resting motor threshold (RMT) was determined as the lowest stimulation intensity (in percent maximum stimulator output [MSO]) evoking MEPs of at least 50 μV peak‐to‐peak amplitude in at least 5 out of 10 successive trials (Groppa et al., 2012). SI1mV was determined as the stimulus intensity required to evoke average MEPs of 1 mV peak‐to‐peak amplitude in the relaxed APB muscle. Short interval intracortical inhibition (SICI) was tested by applying paired‐pulse TMS and investigating the effect of a first subthreshold (conditioning) stimulus on a second suprathreshold (test) stimulus (Kujirai et al., 1993). The test stimulus (TS) was delivered at a short interstimulus interval (ISI) of 2.0 ms after the conditioning stimulus (CS); 2.0 ms was selected since maximum SICI typically occurs at this ISI and short‐interval intracortical facilitation does not compromise the SICI effect at this particular interval (Peurala, Muller‐Dahlhaus, Arai, & Ziemann, 2008; Roshan, Paradiso, & Chen, 2003; Ziemann et al., 1998). SICI was obtained at six different CS intensities (50, 60, 70, 80, 90, and 100% of RMT) with TS intensity set to SI1mV. The amplitude of CS responses was expressed as percentage of the amplitude of the TS responses. Eight trials for each CS intensity condition and 16 trials for the TS alone condition were delivered in randomized order, that is, a total of 64 trials. For postdrug measurements, TS intensity was adjusted to ensure that MEPs in response to TS alone still showed a 1 mV peak‐to‐peak amplitude on average, despite a potential drug‐ or time‐related change in corticospinal excitability. This was important to avoid nonspecific alteration of SICI related to changes in test MEP amplitude (Sanger, Garg, & Chen, 2001). Subjects were provided with audio‐visual feedback of APB muscle activity to assist in maintaining complete muscle relaxation, avoiding any drug‐unrelated reduction of SICI by preinnervation (Ridding, Taylor, & Rothwell, 1995). MEP input–output curves were also acquired in the resting APB muscle. Seven stimulus intensities (90, 100, 110, 120, 130, 140, and 150% of RMT) were tested in randomized order, and eight trials were obtained per stimulus intensity, resulting in a total of 56 single‐pulse stimuli. For postdrug MEP input–output curves, stimulus intensity was not adjusted in case of RMT change, that is, the same absolute stimulus intensities were used for predrug and postdrug measurements. TMS‐evoked EEG potentials (TEPs) were measured in response to 200 single TMS pulses, delivered at an intensity of 100% RMT (as determined at baseline), predrug and postdrug intake with a jittered 4–6 s inter‐trial interval to reduced anticipation of the next trial. Here, postdrug TEP measurements were repeated with an adjusted stimulus intensity if RMT had changed by more than 2% MSO (Figure 1). Auditory white noise masking via in‐ear headphones was used to attenuate auditory co‐stimulation by the TMS click and prevent contamination of TMS‐evoked EEG responses with auditory evoked potentials (Casarotto et al., 2010; Massimini et al., 2005).
2.3.2. EMG recordings
MEPs were recorded from the APB muscle using EMG adhesive hydrogel electrodes (Kendall, Covidien) in a bipolar belly tendon montage and a ground electrode placed on the right wrist. EMG data were recorded (20 Hz–2 kHz bandpass filter, 50 Hz notch filter, 5 kHz sampling rate) by Spike2 software (Cambridge Electronic Design) and stored for offline analysis.
2.3.3. EEG recordings
Subjects were instructed to fixate a cross, minimize eye blinks, and keep their face and hand muscles relaxed during data recording. EEG was recorded using a 64‐channel EEG cap with TMS‐compatible sintered Ag/AgCl electrodes (Multitrodes, BrainCap‐Fast'n Easy; Brain Products). FCz and AFz served as recording reference and ground electrode, respectively. To minimize TMS‐related artifacts during TEP measurements, EEG signals were recorded in DC mode with an anti‐aliasing low‐pass filter of 1,000 Hz, and digitized with a resolution of 0.1 μV/bit at a sampling rate of 5 kHz using BrainVision Recorder software (version 1.20; BrainProducts). Additional electrodes for horizontal and vertical electrooculography were placed at the outer canthus and below of the right eye to monitor eye movement artifacts. The position of each EEG electrode relative to the head was recorded and stored using the neuronavigation system to allow precise repositioning of the cap for subsequent sessions of the same subject. Electrode impedances were regularly checked and kept below 5 kΩ throughout the experiment. In each experimental session, 5 min of both, eyes‐closed and eyes‐open resting‐state EEG were acquired additional to TEP recordings before and after drug intake to investigate drug‐induced changes in spontaneous oscillatory brain activity.
2.4. Data analyses
2.4.1. TMS–EMG analysis
EMG data were analyzed blind to experimental conditions using customized MATLAB scripts (R2015a, MathWorks, Natick, MA). Data were imported from Spike2 to MATLAB and MEP peak‐to‐peak amplitudes were determined per trial and averaged across trials per time point (predrug and postdrug) and drug condition. For assessment of drug‐induced changes in RMT and SI1mV, normalized (post/pre) data were computed separately for all drug conditions, and two‐sided one‐sample t‐tests against 1 for each drug condition and two‐sided paired t‐tests for comparing drug conditions with placebo were conducted. MEP input–output curves were obtained by calculating conditional averages (7 stimulation intensity levels: 90–150% RMT in steps of 10% RMT) of the peak‐to‐peak MEP amplitudes. SICI intensity curves were calculated as the ratio of conditional averages of conditioned MEP (6 CS intensities: 50–100% RMT in steps of 10% RMT) over the average test MEP (TS intensity: SI1mV). For MEP input–output and SICI intensity curves, three‐way rmANOVAs were conducted separately for each study drug relative to placebo, with the factors TIME (2 levels: predrug, postdrug), DRUG (2 levels: drug, placebo), and INTENSITY (7 levels for MEP input–output curves; 6 levels for SICI intensity curves). In addition, a two‐way rmANOVA with the factors TIME and INTENSITY was conducted within each drug condition. Posthoc paired t tests were applied in case of significant main effects. Significance threshold was set to p < .05.
2.4.2. TMS‐EEG analysis
EEG data were analyzed blind to experimental conditions using MATLAB and the Fieldtrip open source toolbox (http://www.ru.nl/fcdonders/fieldtrip; [Oostenveld, Fries, Maris, & Schoffelen, 2011]), and in accordance with established artifact removal pipelines (Herring, Thut, Jensen, & Bergmann, 2015; Rogasch et al., 2017). Raw data were initially segmented into longer epochs from 1.5 s before to 1.5 s after the TMS pulse to avoid filter artifacts before later reducing segments to the actual epoch of interest (i.e., from −100 ms to 300 ms after the TMS pulse). Long epochs were baseline corrected by subtracting the average of the interval from −220 ms to −20 ms. The initial TMS pulse artifact (amplifier ringing and step artifact) and subsequent cranial muscle artifacts (resulting from co‐stimulation of peripheral motor nerves) were cut and data was cubically interpolated between −2 ms to 12 ms. Then, trials and channels were inspected visually using the summary function of Fieldtrip to remove artifact‐contaminated trials. On average, 37 ± 23 [mean ± SD] trials were removed per block of 200 trials. Subsequently, a 2 Hz fourth‐order zero‐phase (two‐pass) Butterworth high‐pass filter were applied to suppress low‐frequency fluctuations, followed by demeaning and downsampling EEG data to 1 kHz. Note that high‐pass filtered and down‐sampled data was used for independent component analysis training only (see below). Independent component analysis (FastICA) was applied to the down‐sampled data to capture the residual muscle and exponential decay artifacts as well as sharp edges caused by interpolation of the pulse artifact. Artifact components were identified based on the topography and temporal pattern of the TMS‐locked responses and in agreement with published procedures (Herring et al., 2015; Rogasch et al., 2017). After identifying artifact contaminated components (on average 3 ± 2 [mean ± SD] per subject), the same unmixing matrix was applied to the interpolated EEG signal before high‐pass filtering and down‐sampling had been applied, and bad components were removed from those data before back‐projection into channel space. This procedure prevented filter and down‐sample artifacts to contaminate our data. Then, a second round of high‐pass filtering (2 Hz), demeaning, downsampling (1 kHz), and ICA was applied to identify and remove other TMS‐unrelated artifacts such as eye blinks, eye movements, line noise, and tonic muscle artifacts according to standard criteria (Chaumon, Bishop, & Busch, 2015). Again, the unmixing matrix was applied to the signal cleaned by the first ICA before the second round of high‐pass filtering and downsampling had been applied, and the selected artifactual components were removed before back‐projecting that signal into channel space. Finally, time‐locked averages (TEPs) of the remaining artifact‐free trials (163 ± 23 (mean ± SD) per participant and measurement) were computed per measurement time point and drug condition for each channel, and eventually a 2 Hz high‐pass filter and a 45 Hz low‐pass filter were applied followed by baseline correction from −200 to 0 ms and re‐referencing of EEG data to the common average of all EEG channels.
Five TEP components: P25 (time window of interest [TOI]: 15–35 ms), N45 (36–50 ms), P70 (51–85 ms), N100 (86–150 ms), and P180 (151–280 ms) were studied due to their high reproducibility for M1 stimulation, and in accordance with the literature (Bonato et al., 2006; Darmani et al., 2016; Lioumis et al., 2009; Premoli et al., 2014; Premoli, Castellanos, et al., 2014). The specific TOIs were chosen around the respective peaks based on grand‐average TEPs. Two‐tailed paired t‐tests were applied to compare predrug and postdrug TEP peak amplitudes within each drug condition and to test for the interaction between TIME and DRUG, that is, drug(post–pre)–placebo(post–pre) for each electrode and at each time point, separately for the five TOIs. Nonparametric, cluster‐based permutation statistics (Maris & Oostenveld, 2007) were used to control for multiple comparisons across channels and time points within TOIs. Clusters were defined as adjacent time point‐channel pairs for which the t‐statistic exceeded a threshold of p < .05. Cluster‐level statistics were calculated based on the sum of t‐values within each cluster. Monte Carlo P‐values were computed based on 10,000 random permutations and a value of p < .05 was used as the cluster‐statistical significance threshold for all tests.
Since there were strong drug‐induced increases in spontaneous oscillatory power in the post‐TGB measurement, which contaminated the TEPs, we used General Eigenvalue Decomposition (GEiD) for extracting and removing the spontaneous oscillatory components from the concatenated predrug and postdrug measurements of the TGB session only (Cohen, 2017). Given that delta and theta frequency bands demonstrated the largest increase, we used the respective peak frequencies for each subject (as determined from the individual Fast Fourier Transform [FFT]; see below) to individualize the targeted frequency band for optimal results. Separate GEIDs were calculated for each frequency band. To identify truly endogenous oscillations, time–frequency representation, inter‐trial coherence, and power spectra of the components were considered. However, to ensure that spontaneous oscillatory components were removed to the maximal possible degree, we were very conservative with respect to the components kept, which may have resulted in slight overcorrection and removal of actual TEP components.
2.4.3. Pre‐TMS EEG analysis
To further investigate the above‐mentioned drug‐induced changes of spontaneous oscillations, a FFT was performed for the pre‐TMS time periods. Data preprocessed for the TEP analysis between −1,030 ms and −30 ms before the TMS pulse were analyzed using a Hanning‐tapered FFT for frequency bins from of 1–45 Hz in steps of 1 Hz, averaged across trials, separately for each channel, measurement time point and drug condition, and eventually as grand‐average across all participants. The same cluster statistical test outlined for the TEP analysis was used to test postdrug versus pre‐drug for each drug condition, as well as the interactions between TIME and DRUG, that is, drug (post–pre)–placebo(post–pre), separately for each frequency band: that is, delta (1–3 Hz), theta (4–7 Hz), alpha (8–12 Hz), and beta (13–30 Hz).
2.4.4. Resting‐state EEG analysis
In addition to the pre‐TMS analyses, we also quantified drug‐induced changes in spontaneous oscillations for the 5 min eyes‐open resting‐state EEG. For initial ICA preprocessing, rs‐EEG data were segmented into 4 s epochs, and concatenated across all drug conditions and measurements per subject. Data were 2 Hz high‐pass filtered, demeaned, and down‐sampled (1 kHz), and ICA was conducted to identify eye blinks, eye movements, or muscle/movement artifacts. Similar to the TEP analysis described above, the unmixing matrix was then applied to the original data before high‐pass filtering and down‐sampling. The artifactual components were removed before back‐projection into channel space. Data were visually inspected, and trials contaminated by residual artifact were removed manually. The cleaned rs‐EEG data were then re‐referenced to the average of all EEG channels. Power spectra were determined via a Hanning‐tapered FFT for frequency bins from 1 to 45 Hz in steps of 0.25 Hz, and spectra were averaged across segments and EEG channels. Cluster‐based permutation tests were performed as described above separately for delta, theta, alpha, and beta frequency bands.
3. RESULTS
CBZ and BRV had tolerability profiles comparable to placebo. TGB, however, was associated with considerable side effects (see section 2), causing 3 out of 15 participants to abort the respective session, leading to a reduced sample size of N = 12 for the analyses of this condition.
3.1. Drug effects on RMT and SI1mV
Drug effects on RMT and SI1mV (postdrug/predrug) are summarized in Figure 2 and Table 2. CBZ increased RMT and SI1mV, both with respect to predrug baseline (RMT: t 14 = 3.57, p = .003; SI1mV: t 14 = 4.34; p < .001) and compared to placebo‐related changes (RMT: t 14 = 3.38, p = .004; SI1mV: t 14 = 1.9, p = .08, nonsignificant). Under BRV, there was a nonsignificant (p < .1) RMT increase relative to both predrug baseline (t 14 = 1.86, p = .08) and compared to placebo‐related changes (t 14 = 1.84, p = .08), as well as a significant increase in SI1mV relative to predrug baseline (t 14 = 2.35, p = .03). No significant effects were found for TGB (RMT: all p > .7; SI1mV: all p > .3) or placebo (all p > .5).
Figure 2.
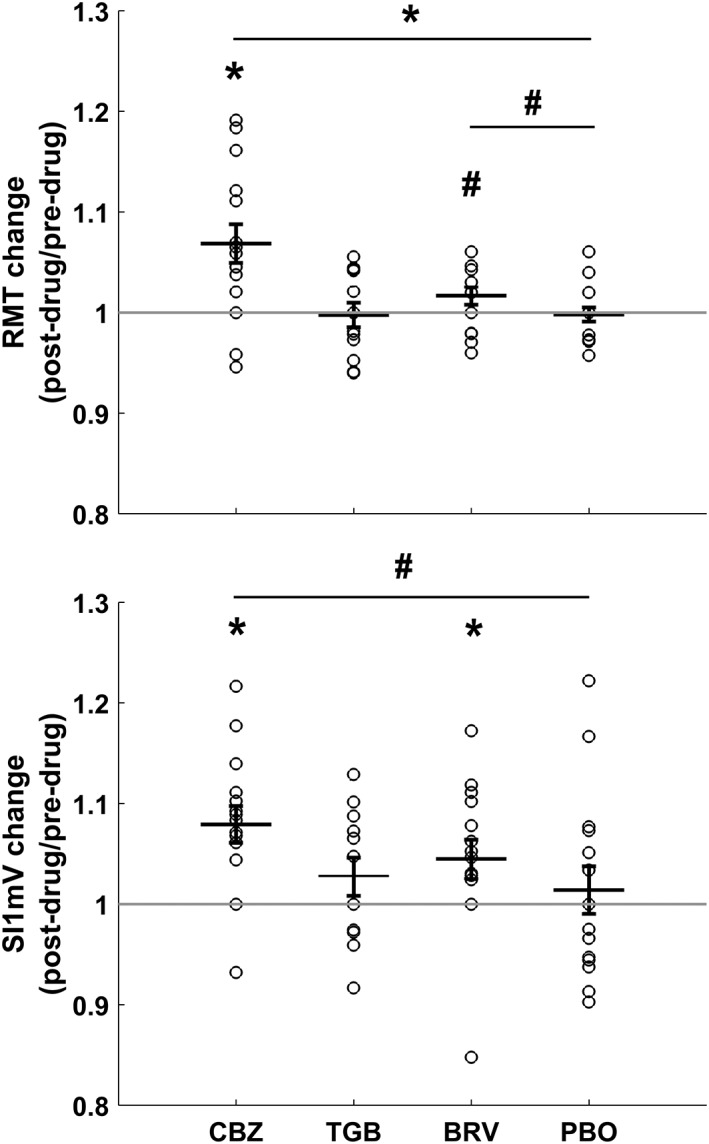
Individual and mean changes (± 1 SEM) in RMT and SI1mV (postdrug/predrug) in all drug conditions (CBZ, carbamazepine; TGB, tiagabine; BRV, brivaracetam; and PBO, placebo). CBZ increased RMT compared to baseline and placebo (p < .05) and both CBZ and BRV increased S1 mV compared to baseline (p < .05). Asterisks indicate significant comparisons with p < .05, hashtags indicate nonsignificant comparisons with p < .1
Table 2.
Mean ± SD for RMT and SI1mV before (pre) and after (post) drug intake for all drug conditions
| CBZ | BRV | TGB | PBO | |||||
|---|---|---|---|---|---|---|---|---|
| Predrug | Postdrug | Predrug | Postdrug | Predrug | Postdrug | Predrug | Postdrug | |
| RMT (%MSO) | 42 ± 7.2 | 45 ± 7.9 | 41.8 ± 7.2 | 42.5 ± 6.8 | 43.4 ± 6.7 | 43.3 ± 6.9 | 42.4 ± 6.8 | 42.4 ± 7 |
| SI1mV (%MSO) | 56 ± 11.1 | 60.3 ± 11.6 | 55.4 ± 9.6 | 58 ± 11.4 | 57.1 ± 10.8 | 58.9 ± 12.3 | 55.7 ± 11.4 | 56.2 ± 11.3 |
CBZ = carbamazepine; BRV = brivaracetam; TGB = tiagabine; PBO = placebo.
3.2. Drug effects on MEP input–output curve
Drug effects on MEP input–output curves are illustrated in Figure 3. A 2 × 2 × 7 three‐way rmANOVA with factors TIME (pre vs. post), DRUG (drug vs. placebo), and INTENSITY (90, 100, 110, 120, 130, 140, and 150% RMT) revealed a main effect of DRUG for CBZ (F 1,392 = 5.47, p = .02), and a TIME × DRUG interaction for BRV (F 1,392 = 4.45, p = .03). A follow‐up within‐drug 2 × 7 two‐way rmANOVA for BRV with the factors TIME and INTENSITY did reveal a nonsignificant (p < .1) main effect of TIME only (F 1,392 = 3.68, p = .056), suggesting a general BRV‐induced decrease in corticospinal excitability, irrespective of stimulation intensity. No significant change of MEP input–output curves was found for TGB or placebo. Trivially, all main effects of INTENSITY were highly significant (p < .0001).
Figure 3.
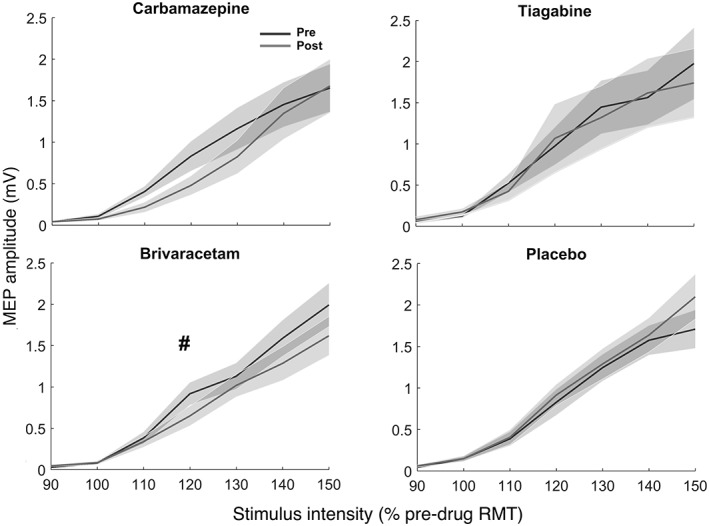
Mean MEP input–output curves (shadings: ± 1 SEM) plotted against seven different stimulus intensities before (black) and after (gray) intake of the four drug conditions: Carbamazepine (top left), tiagabine (top right), brivaracetam (bottom left) and placebo (bottom right). The hashtag indicates a nonsignificant (p < .1) drug‐related change of the MEP curve. RMT = resting motor threshold, as determined before drug intake
3.3. Drug effects on SICI intensity curve
SICI intensity curves per drug condition (TS intensity adjusted for SI1mV changes, CS intensity nonadjusted, see section 2) are provided in Figure 4. A 2 × 2 × 6 three‐way rmANOVA with factors TIME, DRUG, and CS‐INTENSITY (50, 60, 70, 80, 90, and 100% RMT) revealed a significant interaction between TIME and DRUG (F 1,336 = 5.24, p = .02) for CBZ. A follow‐up within‐drug 2 × 6 two‐way rmANOVA for CBZ with the factors TIME and CS‐INTENSITY for the CBZ session, revealed main effects of TIME (F 1,168 = 8.95, p = .003) but no interaction effect (p > .3), indicating a general CBZ‐induced decrease in SICI, irrespective of CS‐INTENSITY. For BRV, the three‐way rmANOVA revealed a main effect of DRUG only (F 1,336 = 3.9, p = .04) but no interaction effect (p > .3), and the respective two‐way rmANOVA for the BRV session showed no significant main effect of DRUG or interaction (p > .3). No significant change of SICI intensity curves was found for TGB or placebo. As expected, CS‐INTENSITY effects were highly significant in all drug conditions (p < .0001).
Figure 4.
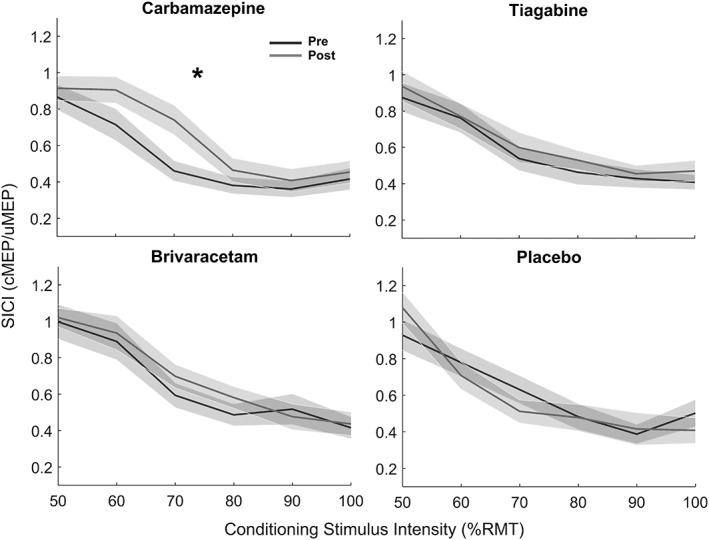
Mean SICI intensity curves (shadings: ± 1 SEM) plotted as a function of the six conditioning stimulus (CS) intensities before (black) and after (gray) intake of carbamazepine (top left), tiagabine (top right), brivaracetam (bottom left), and placebo (bottom right). The asterisk indicates a significant (p < .05) drug‐related change of the SICI intensity curve. RMT = resting motor threshold; cMEP = conditioned motor evoked potential amplitude; uMEP = unconditioned motor evoked potential amplitude
3.4. Drug effects on TEPs
Cluster‐based permutation analysis was used to test for differences between predrug TEPs across drug conditions, drug‐induced TEP changes within each drug condition (i.e., postdrug – predrug; indicated as vs. baseline in the following), and drug‐induced TEP changes relative to placebo (i.e., the interaction contrast drug(post–pre)–placebo(post–pre); indicated as vs. placebo in the following). Because CBZ increased RMT in some subjects, TEP analyses were conducted for the measurements with adjusted and nonadjusted stimulation intensity (see section 2). Note that in the following increases and decreases of TEP components always refer to a modulation of their amplitude in absolute values (e.g., a decreased N100 means a negative potential of reduced amplitude). Also note that the same TEP component can have opposite signs (direction of deflection) in different channels as a result of the dipole orientation of the underlying neuronal source and the common average referencing (e.g., the P25 being positive over the stimulated sensorimotor cortex, but negative at contralateral posterior sites, with a reduction in absolute amplitude of that negativity at contralateral posterior sites would still being considered a decrease of the very same potential).
Figure 5 shows the grand average TEPs at predrug baseline for all drug conditions. In line with the literature, five classic TEP components (P25, N45, P70, N100, and P180) were identified and selected for further analysis. Importantly, predrug TEPs did not differ between drug conditions, demonstrating reliability of TMS‐evoked EEG responses in our neuronavigated multi‐session TEP measurements. Moreover, there was no significant modulation of the TEP over time in the placebo condition, besides a nonsignificantly (p < .1) increased P25 amplitude over the stimulated left sensorimotor cortex (p = .06), possibly reflecting a general effect of time, that is taken into account by analysis of the interaction contrasts (drug[post–pre]–placebo[post–pre]).
Figure 5.
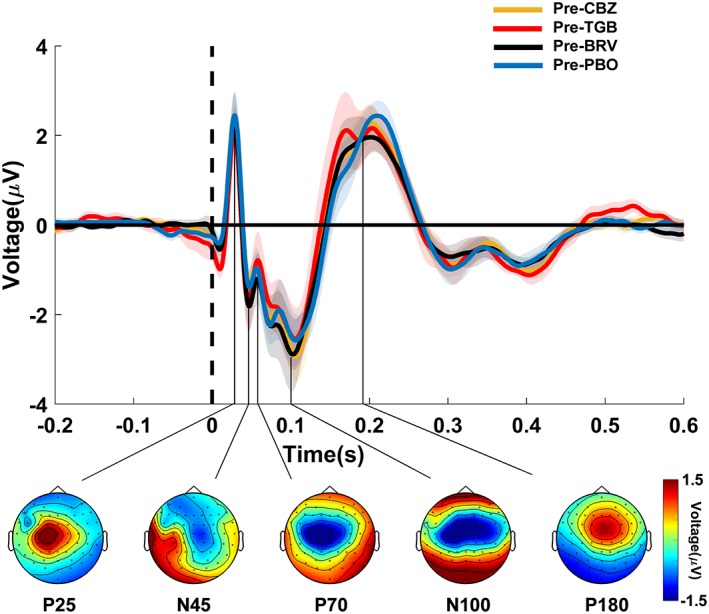
TEPs before drug intake. TEPs (shadings: ± 1 SEM) were plotted for channel Cz at baseline (predrug) in the four different drug conditions (CBZ, carbamazepine; TGB, tiagabine; BRV, brivaracetam; and PBO, placebo) and labeled based on their approximate latency (P25, N45, P70, N100, and P180) relative to the time of the TMS pulse over the left M1 (time 0, vertical dashed line). Topographical distributions of surface voltages illustrated in the bottom were grand averaged over the four drug conditions in nonoverlapping TOIs after TMS (P25: 15–35 ms; N45: 36–50 ms; P70: 51–85 ms; N100: 86–150 ms; P180: 151–280 ms). Note that voltage topographies may not reveal accurate locations for low amplitude components (e.g., N45, P70) that peak during the flanks of high amplitude components (e.g., N100) [Color figure can be viewed at http://wileyonlinelibrary.com]
CBZ modulated both early and late TEP components as depicted in Figure 6 (Supporting Information Table S1 provides the individual channels for each of the significant clusters mentioned below) and in Figure 8(a). Notably, those changes were independent of the general decrease in corticospinal excitability (as reflected by an increase in RMT and SI1mV in the TMS‐EMG measurements), as the following results were obtained with the adjusted stimulation intensity. CBZ suppressed the P25 potential over the stimulated left sensorimotor cortex (vs. placebo: p = .003; vs. baseline: p = .08) and the parieto‐occipital cortex in the nonstimulated right hemisphere (vs. placebo: p = .0001; vs. baseline: p = .001). CBZ also caused a reduction of the P180 potential (vs. placebo: p = .03; vs. baseline: p = .0005) and a nonsignificant (p < .1) attenuation of the N100 potential (vs. placebo: p = .09; vs. baseline: p = .09), both over the nonstimulated right sensorimotor cortex. The N100 potential was also decreased in amplitude over the occipito‐parietal cortex (vs. placebo: p = .058; vs. baseline: p = .03). Notably, without readjustment of the stimulation intensity, results remained largely identical for the P25 and P180 potential (see Supporting Information Table S1); merely the nonsignificant (p < .1) N100 did not survive, and instead the N45 potential was increased over the stimulated left sensorimotor cortex (vs. placebo: p = .03; vs. baseline: p = .09) and over the nonstimulated right sensorimotor cortex (vs. placebo: p = .0006; vs. baseline: p = .10; as shown in Supporting Information Figure S1).
Figure 6.
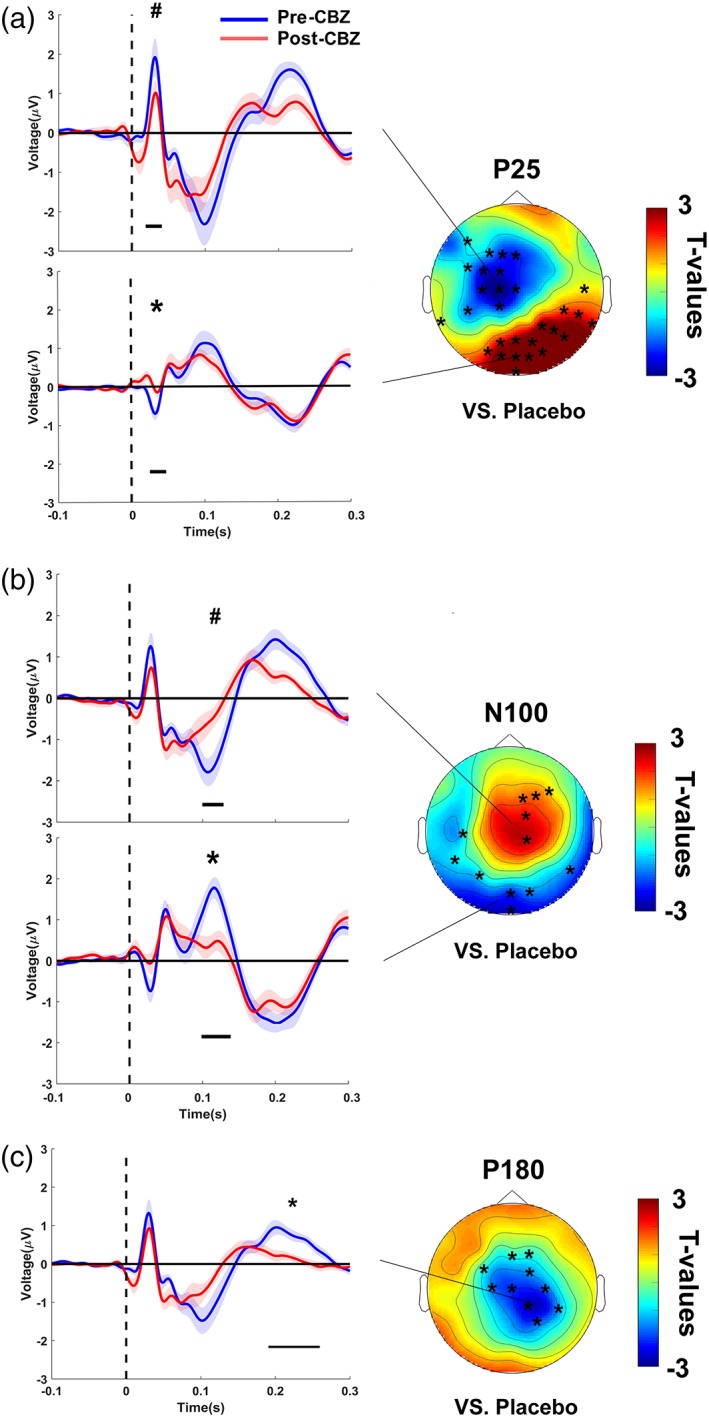
Carbamazepine‐induced changes of TEPs. CBZ decreased the (a) P25, (b) N100 and (c) P180 TEP components. TEPs (shadings: ± 1 SEM) plotted for grand averages of those channels constituting a cluster of significant differences versus baseline (post‐CBZ – pre‐CBZ), separately for predrug (blue) and postdrug (red) measures. Horizontal black bars underneath the TEPs denote the significant clusters in time (*p < .05, # p < .1). T‐statistic maps of the TEP amplitude plotted versus placebo (CBZ [post–pre] vs. placebo [post–pre]). Channels constituting significant clusters of changes in this interaction are indicated by asterisks in the t‐statistic maps [Color figure can be viewed at http://wileyonlinelibrary.com]
Figure 8.
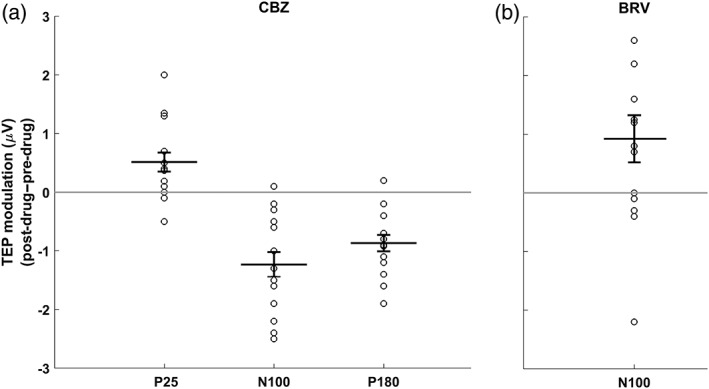
Individual and mean changes (± 1 SEM) of drug‐induced changes in TEP component amplitudes, averaged across channels within each significant (p < .05) cluster that was detected for (a) CBZ (cf. Figure 6) and BRV (cf. Figure 7)
BRV only modulated late TEP components as depicted in Figure 7 and Supporting Information Figure S2 (Supporting Information Table S2 provides the individual channels for each of the significant clusters mentioned below) and in Figure 8b. BRV decreased the N100 potential (vs. placebo: p = .03; vs. baseline: p = .03) and caused a nonsignificant (p < .1) attenuation of the P180 potential (vs. baseline: p = .08), with drug‐induced changes of both TEP components topographically being located over the nonstimulated right sensorimotor cortex.
Figure 7.
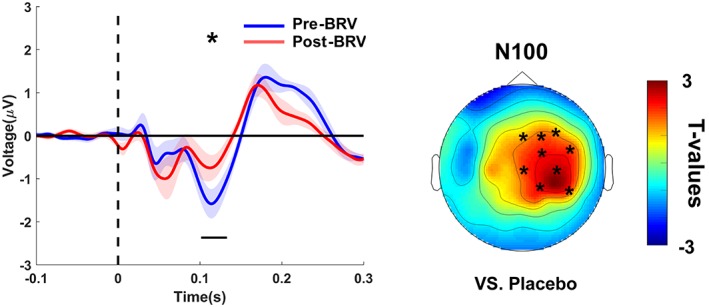
Brivaracetam‐induced changes of TEPs. BRV decreased the N100 potential in the nonstimulated right hemisphere. TEPs (shadings: ± 1 SEM) plotted for grand averages of those channels that showed a significant difference versus baseline (post‐BRV – pre‐BRV), separately for predrug (blue) and postdrug (red) measures. Horizontal black bars underneath the TEPs denote significant clusters in time (*p < .05). T‐statistic maps of the TEP amplitude plotted versus placebo (BRV [post–pre] vs. placebo [post–pre]). Channels constituting significant clusters of changes in this interaction are indicated by asterisks in the t‐statistic maps [Color figure can be viewed at http://wileyonlinelibrary.com]
For TGB, in the reduced sample of N = 12 subjects, and despite all attempts to remove the increased spontaneous oscillatory activity corrupting TEP averages (see section 2, and below), no significant modulation of any of the TEP components could be observed (all p ≥ .2).
3.5. Drug effects on spontaneous oscillations
Drug‐induced changes in spontaneous oscillatory spectral power in the pre‐TMS time periods are shown in Figure 9 and Supporting Information Figure S3. CBZ caused an increase in the power of spontaneous oscillations that was significant only for a circumscribed central cluster in the beta band during pre‐TMS EEG periods (vs. placebo: p = .007; vs. baseline: p = .0009), but extended to more widespread global increases in the theta (vs. baseline: p = .004) and alpha (vs. placebo: p = .004; vs. baseline: p = .01) bands in addition to the beta band (vs. placebo: p = .04; vs. baseline: p = .01) during eyes open resting‐state EEG recordings.
Figure 9.
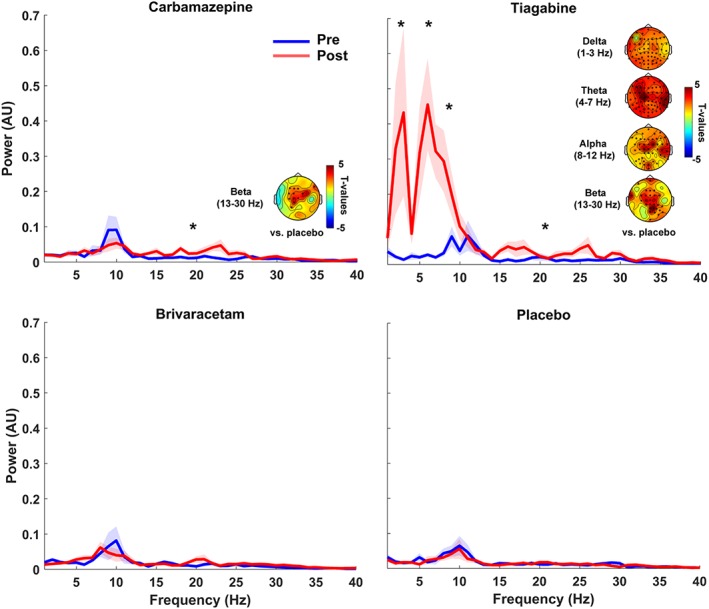
Drug‐induced changes in spontaneous oscillatory power. Grand average power spectra (shadings: ± 1 SEM) are plotted for the pre‐TMS EEG period of predrug (blue) and postdrug (red) measures for carbamazepine (CBZ, top left), tiagabine (TGB, top right), brivaracetam (BRV, bottom left), and placebo (PBO, bottom right). CBZ mainly increased beta band power, while TGB caused enormous power increases in all frequency bands (delta, theta, alpha, and beta). TGB‐induced changes in delta and beta bands were particularly strong. There were no drug‐induced power changes in other drug conditions or for other frequency bands. Power spectra are plotted for channel Cz, and asterisks indicate significant drug‐related changes (p < .05). T‐statistic maps plotted versus placebo (drug [post–pre] vs. placebo [post–pre]), and channels forming significant clusters are marked with asterisks in the t‐statistic maps [Color figure can be viewed at http://wileyonlinelibrary.com]
TGB caused an even stronger broadband and spatially widespread boost of oscillatory spectral power, including delta (vs. placebo: p = .0009; vs. baseline: p = .0009), theta (vs. placebo: p = .0009; vs. baseline: p = .0009), alpha (vs. placebo: p = .0009; vs. baseline: p = .01), and beta (vs. placebo: p = .003; vs. baseline: p = .0009) bands during both pre‐TMS time periods and eyes open resting‐state EEG. Oscillatory power changes were most pronounced (i.e., 7‐ to 8‐fold) in the delta and theta bands (see Figure 9 and Supporting Information Figure S3).
No significant modulation of spontaneous resting EEG spectral power was observed for BRV or placebo in any of the four frequency bands (all p > .2).
4. DISCUSSION
The novel findings of this work relate to the drug induced changes in TMS‐evoked EEG potentials (TEPs). In the context of previous studies that investigated the effects of drugs with other specific modes of action this allows to further characterize the pharmaco‐physiology of TEPs, which are considered important noninvasively measured signatures of excitability and connectivity of the human brain (Chung et al., 2015; Rogasch & Fitzgerald, 2013). In the following the main reported drug effects on TMS‐EMG and TMS‐EEG measures will be discussed.
4.1. TMS‐EMG results
4.1.1. RMT and SI1mV
CBZ increased RMT and SI1mV. This confirms previous TMS‐EMG findings that consistently demonstrated that CBZ increases motor threshold (for review see Ziemann et al., 2015). Motor threshold depends on membrane excitability, and blockade of VGSCs decreases the axonal excitability of cortico‐cortical and corticospinal neurons to single‐pulse TMS. VGSCs are crucial in regulating axon excitability and their blockade will result in a more hyperpolarized (i.e., less excitable) state of cortico‐cortical axons in M1 (Hodgkin & Huxley, 1952), and since these axons have synaptic contacts with cortico‐spinal neurons, VGSC blocking drugs such as CBZ increase motor threshold (Ziemann et al., 2015).
BRV increased the SI1mv and there was also a nonsignificant (p < .1) increase in RMT, however, the increases in SI1mv and RMT after BRV were less pronounced than after CBZ, which was expected since BRV has primarily neurotransmitter‐modifying properties. There is some inconsistency in the reports after levetiracetam intake (also a ligand to the presynaptic vesicle protein SV2A), with some studies reporting an increase in motor threshold (Premoli, Costantini, et al., 2017; Solinas, Lee, & Reutens, 2008), while others reported no change (Heidegger, Krakow, & Ziemann, 2010). The slight increase in motor threshold after BRV intake reported here may relate to a secondary mode of action of BRV in blocking VGSCs (Niespodziany et al., 2015).
TGB did not alter RMT or SI1mv, in line with previous results (Werhahn et al., 1999).
4.1.2. MEP input–output curve
CBZ did not change the MEP amplitudes. MEP input–output curve is a measure of trans‐synaptic excitation of corticospinal neurons regulated by glutamatergic, GABAergic and neuromodulating neurotransmitters, but no effects of ion channels on MEP amplitudes have been established (Ziemann et al., 2015). Note that significant changes in motor threshold may occur without changes in MEP amplitudes, which supports the idea that the mechanism underlying motor threshold and MEP amplitudes are different, and this may explain the lack of a significant effect of CBZ on MEP input–output curve despite its effects on motor threshold. Also note that the assessment of changes in RMT and MEP curve was not only based on two independent measurements, and determined by two very different procedures but also relied on different statistical tests (paired t‐tests vs. three‐way rmANOVA), which may partially explain this apparent discrepancy. In fact, if conducting post hoc comparisons per intensity condition (which is not justified given the lack of interaction in the three‐way rmANOVA) the single significant post–pre difference would have been at 100% RMT, but no other intensity. Others have described a rightward shift of the MEP input–output curve reflecting the increase in motor threshold after VGSC blocker intake (Boroojerdi, Battaglia, Muellbacher, & Cohen, 2001).
BRV produced a nonsignificant (p < .1) decrease in the MEP input–output curve. This effect may be explained by its specific binding to the presynaptic vesicle protein SV2A. This protein is expressed on excitatory and inhibitory neurons throughout the central nervous system (Klein et al., 2018), but BRV may exert its antiepileptic effects predominantly through depression of excitatory neurotransmission (Yang et al., 2015).The current BRV findings are in agreement with previous TMS‐EMG studies that reported a depression of MEP input–output curves under levetiracetam (Reis et al., 2004; Sohn, Kaelin‐Lang, Jung, & Hallett, 2001).
TGB did not modulate the MEP input–output curve, in accordance with previous findings (Werhahn et al., 1999).
4.1.3. SICI intensity curve
SICI reflects synaptic GABAAergic inhibition of corticospinal neurons, and VGSC blockers had no effect on SICI in previous studies (Ziemann et al., 2015). The observed decrease in SICI after CBZ in the present study (Figure 4) is most likely simply a rightward shift of the SICI input–output curve caused by the increase in RMT, for which CS intensity was not adjusted for and, therefore, a nonspecific finding. This is supported by the observation that motor and SICI thresholds are closely related to each other (Ziemann, Rothwell, & Ridding, 1996).
BRV had no effect on SICI. This is in accord with the literature where levetiracetam also did not alter SICI (Reis et al., 2004; Sohn et al., 2001; Solinas et al., 2008), and with the mode of action of BRV and levetiracetam without any modulating activity directly at the GABAA receptor (Klein et al., 2018; Lyseng‐Williamson, 2011).
In contrast to previous work (Werhahn et al., 1999), we did not observe a depression of SICI after TGB intake. Those authors also demonstrated a prolongation of the cortical silent period (CSP) duration and an increase in long‐interval intracortical inhibition, both putative measures of GABAB receptor mediated cortical inhibition (McDonnell, Orekhov, & Ziemann, 2006; Ziemann et al., 2015), and interpreted the TGB‐induced reduction in SICI through enhanced GABAB receptor‐mediated presynaptic autoinhibition (Werhahn et al., 1999). We have not tested here TMS‐EMG measures of GABAB receptor‐mediated inhibition, and there are other methodological differences between the two studies, for example the ISI of 3 ms (Werhahn et al., 1999) versus 2 ms (our study) for SICI testing that may have contributed to the disparate findings (Peurala et al., 2008).
4.2. TMS‐EEG results
4.2.1. Carbamazepine
After application of repetitive TMS (rTMS) or transcranial direct current stimulation (tDCS), which modulate synaptic strength and cortical excitability as indicated by TMS‐EMG measures (Ziemann et al., 2008), only early components of TEPs changed significantly (Esser et al., 2006; Pellicciari, Brignani, & Miniussi, 2013; Veniero, Bortoletto, & Miniussi, 2012). Also, Ilmoniemi et al. (1997) showed that after stimulating M1, motor cortical areas responded within the first 28 ms and these results suggest that the amplitude of early TEPs (< 30 ms) might be a putative marker of excitation of the corticospinal system. Moreover, the amplitude of the N15–P30 complex correlated directly with MEP amplitude (Mäki & Ilmoniemi, 2010). In patients with progressive myoclonus epilepsy, the P25 waveform was increased as a sign for corticospinal and cortico‐cortical hyperexcitability (Julkunen et al., 2013). Therefore, P25 suppression by CBZ, predominantly at the site of stimulation, most likely reflects reduction of corticospinal excitability, a finding that remained significant even with stimulation intensity adjusted to RMT change (Figure 5). This corroborates the previously established notion that TMS‐EEG measures may be more sensitive than TMS‐EMG measures in detecting change in cortical excitability after intervention (Ferreri & Rossini, 2013). The N15–P30 complex has been reported to be strongly affected by TMS coil orientation (Bonato et al., 2006). However, we were able to exclude this possible confound by careful application of neuronavigated TMS.
A decrease of N100 was observed after administration of diazepam and alprazolam, while baclofen increased N100, suggesting that the N100 is negatively related to GABAA but positively to GABAB receptor mediated neurotransmission (Premoli, Castellanos, et al., 2014; Premoli, Rivolta, et al., 2014). The nonsignificant (p < .1) reduction of N100 amplitude after CBZ should be considered with caution because it took place only when compared to baseline but not when compared to placebo, and not with unadjusted stimulus intensities (Figure 6, Supporting Information Figure S1). Therefore, we consider this a nil finding that is in accordance with a lacking effect on the N100 by lamotrigine, another VGSC blocker (Premoli, Costantini, et al., 2017).
A decrease in P180 amplitude was observed after lamotrigine intake, both with and without adjusting stimulus intensity to compensate for RMT change (Premoli, Biondi, et al., 2017; Premoli, Costantini, et al., 2017). Our results complement these findings, as CBZ reduced P180 amplitude both with and without adjusting stimulation intensity. These results suggest that P180 is reactive to excitability‐lowering drugs, for example, classic VGSC blockers (CBZ and lamotrigine), while GABAergic drugs had no effect (Premoli, Castellanos, et al., 2014).
Part of the P180 component is likely caused by auditory evoked activity induced by the click of the stimulating coil (Conde et al., 2018; Rogasch et al., 2014). Therefore, it is possible that a reduction of the cortical auditory evoked potential after CBZ has contributed to the observed P180 reduction. This is, however unlikely, given the findings in the literature that have only shown changes in latency but not amplitude of cortical auditory evoked potentials after CBZ (Japaridze, Kvernadze, Geladze, & Kevanishvili, 1993) but significant amplitude depression after diazepam (Noldy, Neiman, el‐Nesr, & Carlen, 1990). This double dissociation with the reported TMS‐EEG P180 data strongly suggests that the reported depression by VGSC blockers is caused by their effects on direct TMS‐evoked brain responses rather than brain activity related to the auditory input.
4.2.2. Brivaracetam
The N100 is thought to be a marker of GABABergic inhibition due to the enhancing effect of baclofen, a specific GABAB receptor agonist, on N100 amplitude at the site of stimulation (Premoli, Castellanos, et al., 2014). On the other hand, benzodiazepines (Premoli, Castellanos, et al., 2014) and levetiracetam (Premoli, Biondi, et al., 2017) resulted in N100 amplitude depression in the nonstimulated hemisphere. The present results of BRV, showing N100 amplitude depression in M1 area of the nonstimulated hemisphere (Figure 7) are in full agreement with those previous findings. The underlying physiology of this effect, particularly on propagated neuronal activity remote from the site of stimulation remains unclear, but may indicate a suppression of long‐range cortico‐cortical effective connectivity and signal propagation under the influence of drugs with positive modulation at the GABAA receptor (Ferrarelli et al., 2010; Sarasso et al., 2015) and drugs with inhibition of presynaptic excitatory transmitter release (levetiracetam, BRV).
4.2.3. Tiagabine
TGB did not modulate any of the TEP components. One possible reason might be that the TGB dose was not sufficient to cause any effects. However, this can be largely excluded as one previous study found significant effects on TMS‐EMG measures with the same dose (15 mg; Werhahn et al., 1999). Furthermore, we found that TGB strongly increased preTMS EEG power in all frequency bands (Figure 9 and Supporting Information Figure S3), confirming findings of two resting‐state magnetoencephalographic studies (Muthukumaraswamy & Liley, 2018; Nutt et al., 2015) and, therefore, indicating a significant effect of TGB on brain activity in the present experiments.
Nutt and colleagues also had investigated gaboxadol, a positive modulator specifically at the extrasynaptic alpha‐4 delta unit bearing subtype of the GABAA receptor, and zolpidem, a positive modulator with strong positive modulating activity at the synaptic alpha‐1 unit bearing subtype of the GABA receptor. Gaboxadol but not zolpidem resulted in a similar enhancement of resting‐state activity as TGB, and they concluded that the effects by TGB may therefore be largely related to its action on tonic inhibition mediated by extrasynaptic GABAA receptors (Nutt et al., 2015). However, this is unlikely to be the reason for the nil findings of TGB on TEP amplitudes in the present study as previous studies demonstrated significant effects of ethanol, another positive modulator at the extrasynaptic alpha‐4 delta unit bearing subtype of the GABAA receptor (Kahkonen et al., 2001; Kahkonen, Wilenius, Nikulin, Ollikainen, & Ilmoniemi, 2003).
The reason for the nil findings may be explained by the specific mode of action of TGB, which increases the concentration of GABA in the synaptic cleft by inhibition of the GABA transporter 1, but without having significant affinity for any neurotransmitter receptor binding sites in the central nervous system (Suzdak & Jansen, 1995). Importantly, in rat hippocampal slice preparations, tiagabine had no effect on the amplitude of low‐ and high‐intensity single‐pulse evoked inhibitory postsynaptic potentials (Jackson, Esplin, & Capek, 1999), in contrast to positive modulators at GABAA receptors, such as benzodiazepines (Thomson, Bannister, Hughes, & Pawelzik, 2000). For this reason, TGB may have failed to modulate single‐pulse TMS evoked neuronal activity in the human brain as measured by TEP amplitudes.
In conclusion, the present study used three different drugs with specific modes of action to further elucidate the pharmaco‐physiological characteristics of TMS‐evoked EEG potentials (TEPs), emergent noninvasive markers of excitability and effective connectivity of the human brain. We found that carbamazepine, a VGSC blocker depressed the P25 and P180 potentials, while brivaracetam that decreases neuronal excitability through binding to the presynaptic protein SV2A decreased the N100 potential in the nonstimulated hemisphere, and tiagabine, a GABA reuptake inhibitor without direct modulating action on receptors in the central nervous system had no effect. Together with data from previous pharmaco‐TMS‐EEG studies the present findings corroborate the view that the P25 represents axonal excitability of the corticospinal system, the N100 in the nonstimulated hemisphere propagated activity suppressed by positive modulation of GABAA receptors, and the P180 late activity particularly sensitive to VGSC blockade.
4.3. Limitations
Pharmaco‐TMS‐EEG is still a pioneering approach with many challenges, but we did our best to prevent potential confounds by running a double‐blinded, randomized, placebo‐controlled crossover design, and state‐of‐the‐art neuronavigated TMS‐EEG procedures and analyses. Nonetheless, there are a few caveats to consider: While we controlled for multiple comparisons regarding the number of EEG channels and time points, the assessment of multiple different drugs inevitably comes at the risk of false positive findings, no matter whether within a single‐study or across multiple studies and research groups. The only real solution to this issue is replication across labs, which we hereby explicitly encourage. In general, TEPs can be inherently confounded by auditory and somatosensory co‐stimulation (Conde et al., 2018; Gordon, Desideri, Belardinelli, Zrenner, & Ziemann, 2018; Herring et al., 2015). While auditory noise masking can reduce its impact, and the post–pre and drug–placebo comparisons remove most of these confounds, it is possible that a pharmacological modulation of residual auditory and somatosensory evoked potentials adds to the drug‐induced changes in truly transcranial evoked brain responses. This potential confound has to be carefully assessed for each individual case, in particular for components that appear remotely to the stimulation site, such as the P180, as discussed in detail in the TMS‐EEG section above. In general, remote TEP components are more difficult to interpret than those at the stimulation site, as they may have multiple origins. While they can indeed reflect multisensory co‐activations, they may also result from actual signal propagation (also transcallosal) within the stimulated network (Ilmoniemi et al., 1997; Massimini et al., 2005), or from projections to the remote surface from dipoles located at deeper sources (Litvak et al., 2007). In the future, realistic sham conditions and source localized TEP analyses may help to disentangle these contributions. However, TEP analyses in channel space are well established and, importantly, allow comparability with previously published studies.
CONFLICT OF INTEREST
U.Z. reports grants from Bristol Myers Squibb, Janssen Pharmaceuticals NV, Servier, and Biogen Idec, and personal fees from Pfizer GmbH, Bayer Vital GmbH, CorTec GmbH, and Medtronic GmbH, all outside the submitted work.
Supporting information
Supplementary Material
ACKNOWLEDGMENTS
This work has been supported by a grant from the German Research Foundation to U.Z. (DFG ZI 542/9‐1).
Darmani G, Bergmann TO, Zipser C, Baur D, Müller‐Dahlhaus F, Ziemann U. Effects of antiepileptic drugs on cortical excitability in humans: A TMS‐EMG and TMS‐EEG study. Hum Brain Mapp. 2019;40:1276–1289. 10.1002/hbm.24448
Funding information: German Research Foundation, Grant/Award Number: DFG ZI 542/9‐1
REFERENCES
- Bashir, S. , Vernet, M. , Yoo, W. K. , Mizrahi, I. , Theoret, H. , & Pascual‐Leone, A. (2012). Changes in cortical plasticity after mild traumatic brain injury. Restorative Neurology and Neuroscience, 30, 277–282. [DOI] [PMC free article] [PubMed] [Google Scholar]
- Bonato, C. , Miniussi, C. , & Rossini, P. M. (2006). Transcranial magnetic stimulation and cortical evoked potentials: A TMS/EEG co‐registration study. Clinical Neurophysiology, 117, 1699–1707. [DOI] [PubMed] [Google Scholar]
- Boroojerdi, B. , Battaglia, F. , Muellbacher, W. , & Cohen, L. G. (2001). Mechanisms influencing stimulus‐response properties of the human corticospinal system. Clinical Neurophysiology, 112, 931–937. [DOI] [PubMed] [Google Scholar]
- Casarotto, S. , Romero Lauro, L. J. , Bellina, V. , Casali, A. G. , Rosanova, M. , Pigorini, A. , … Massimini, M. (2010). EEG responses to TMS are sensitive to changes in the perturbation parameters and repeatable over time. PLoS One, 5, e10281. [DOI] [PMC free article] [PubMed] [Google Scholar]
- Chaumon, M. , Bishop, D. V. , & Busch, N. A. (2015). A practical guide to the selection of independent components of the electroencephalogram for artifact correction. Journal of Neuroscience Methods, 250, 47–63. [DOI] [PubMed] [Google Scholar]
- Chung, S. W. , Rogasch, N. C. , Hoy, K. E. , & Fitzgerald, P. B. (2015). Measuring brain stimulation induced changes in cortical properties using TMS‐EEG. Brain Stimulation, 8, 1010–1020. [DOI] [PubMed] [Google Scholar]
- Cohen, M. X. (2017). Comparison of linear spatial filters for identifying oscillatory activity in multichannel data. Journal of Neuroscience Methods, 278, 1–12. [DOI] [PubMed] [Google Scholar]
- Conde, V. , Tomasevic, L. , Akopian, I. , Stanek, K. , Saturnino, G. B. , Thielscher, A. , … Siebner, H. R. (2018). The non‐transcranial TMS‐evoked potential is an inherent source of ambiguity in TMS‐EEG studies. bioRxiv. 10.1101/337782 [DOI] [PubMed] [Google Scholar]
- Darmani, G. , Zipser, C. M. , Bohmer, G. M. , Deschet, K. , Muller‐Dahlhaus, F. , Belardinelli, P. , … Ziemann, U. (2016). Effects of the selective alpha5‐GABAAR antagonist S44819 on excitability in the human brain: A TMS‐EMG and TMS‐EEG phase I study. The Journal of Neuroscience, 36, 12312–12320. [DOI] [PMC free article] [PubMed] [Google Scholar]
- Di Lazzaro, V. , Ziemann, U. , & Lemon, R. N. (2008). State of the art: Physiology of transcranial motor cortex stimulation. Brain Stimulation, 1, 345–362. [DOI] [PubMed] [Google Scholar]
- Esser, S. K. , Huber, R. , Massimini, M. , Peterson, M. J. , Ferrarelli, F. , & Tononi, G. (2006). A direct demonstration of cortical LTP in humans: A combined TMS/EEG study. Brain Research Bulletin, 69, 86–94. [DOI] [PubMed] [Google Scholar]
- Ferrarelli, F. , Massimini, M. , Sarasso, S. , Casali, A. , Riedner, B. A. , Angelini, G. , … Pearce, R. A. (2010). Breakdown in cortical effective connectivity during midazolam‐induced loss of consciousness. Proceedings of the National Academy of Sciences of the United States of America, 107, 2681–2686. [DOI] [PMC free article] [PubMed] [Google Scholar]
- Ferreri, F. , & Rossini, P. M. (2013). TMS and TMS‐EEG techniques in the study of the excitability, connectivity, and plasticity of the human motor cortex. Reviews in the Neurosciences, 24, 431–442. [DOI] [PubMed] [Google Scholar]
- Ferreri, F. , Vecchio, F. , Vollero, L. , Guerra, A. , Petrichella, S. , Ponzo, D. , … Di Lazzaro, V. (2016). Sensorimotor cortex excitability and connectivity in Alzheimer's disease: A TMS‐EEG co‐registration study. Human Brain Mapping, 37, 2083–2096. [DOI] [PMC free article] [PubMed] [Google Scholar]
- Gordon, P. C. , Desideri, D. , Belardinelli, P. , Zrenner, C. , & Ziemann, U. (2018). Comparison of cortical EEG responses to realistic sham versus real TMS of human motor cortex. Brain Stimulation. 10.1016/j.brs.2018.08.003 [DOI] [PubMed] [Google Scholar]
- Groppa, S. , Oliviero, A. , Eisen, A. , Quartarone, A. , Cohen, L. G. , Mall, V. , … Siebner, H. R. (2012). A practical guide to diagnostic transcranial magnetic stimulation: Report of an IFCN committee. Clinical Neurophysiology, 123, 858–882. [DOI] [PMC free article] [PubMed] [Google Scholar]
- Heidegger, T. , Krakow, K. , & Ziemann, U. (2010). Effects of antiepileptic drugs on associative LTP‐like plasticity in human motor cortex. The European Journal of Neuroscience, 32, 1215–1222. [DOI] [PubMed] [Google Scholar]
- Herring, J. D. , Thut, G. , Jensen, O. , & Bergmann, T. O. (2015). Attention modulates TMS‐locked alpha oscillations in the visual cortex. The Journal of Neuroscience, 35, 14435–14447. [DOI] [PMC free article] [PubMed] [Google Scholar]
- Hodgkin, A. L. , & Huxley, A. F. (1952). A quantative description of membrane current and its application to conduction and excitation in nerve. Journal of Physiology (London), 116, 500–544. [DOI] [PMC free article] [PubMed] [Google Scholar]
- Ilmoniemi, R. J. , & Kicic, D. (2010). Methodology for combined TMS and EEG. Brain Topography, 22, 233–248. [DOI] [PMC free article] [PubMed] [Google Scholar]
- Ilmoniemi, R. J. , Virtanen, J. , Ruohonen, J. , Karhu, J. , Aronen, H. J. , Naatanen, R. , & Katila, T. (1997). Neuronal responses to magnetic stimulation reveal cortical reactivity and connectivity. Neuroreport, 8, 3537–3540. [DOI] [PubMed] [Google Scholar]
- Jackson, M. F. , Esplin, B. , & Capek, R. (1999). Activity‐dependent enhancement of hyperpolarizing and depolarizing gamma‐aminobutyric acid (GABA) synaptic responses following inhibition of GABA uptake by tiagabine. Epilepsy Research, 37, 25–36. [DOI] [PubMed] [Google Scholar]
- Japaridze, G. , Kvernadze, D. , Geladze, T. , & Kevanishvili, Z. (1993). Effects of carbamazepine on auditory brainstem response, middle‐latency response, and slow cortical potential in epileptic patients. Epilepsia, 34, 1105–1109. [DOI] [PubMed] [Google Scholar]
- Julkunen, P. , Säisänen, L. , Könönen, M. , Vanninen, R. , Kälviäinen, R. , & Mervaala, E. (2013). TMS‐EEG reveals impaired intracortical interactions and coherence in Unverricht‐Lundborg type progressive myoclonus epilepsy (EPM1). Epilepsy Research, 106, 103–112. [DOI] [PubMed] [Google Scholar]
- Kahkonen, S. , Kesaniemi, M. , Nikouline, V. V. , Karhu, J. , Ollikainen, M. , Holi, M. , & Ilmoniemi, R. J. (2001). Ethanol modulates cortical activity: Direct evidence with combined TMS and EEG. NeuroImage, 14, 322–328. [DOI] [PubMed] [Google Scholar]
- Kahkonen, S. , Wilenius, J. , Nikulin, V. V. , Ollikainen, M. , & Ilmoniemi, R. J. (2003). Alcohol reduces prefrontal cortical excitability in humans: A combined TMS and EEG study. Neuropsychopharmacology, 28, 747–754. [DOI] [PubMed] [Google Scholar]
- Kimiskidis, V. K. , Tsimpiris, A. , Ryvlin, P. , Kalviainen, R. , Koutroumanidis, M. , Valentin, A. , … Kugiumtzis, D. (2017). TMS combined with EEG in genetic generalized epilepsy: A phase II diagnostic accuracy study. Clinical Neurophysiology, 128, 367–381. [DOI] [PubMed] [Google Scholar]
- Klein, P. , Diaz, A. , Gasalla, T. , & Whitesides, J. (2018). A review of the pharmacology and clinical efficacy of brivaracetam. Clinical Pharmacology, 10, 1–22. [DOI] [PMC free article] [PubMed] [Google Scholar]
- Klitgaard, H. , Matagne, A. , Nicolas, J. M. , Gillard, M. , Lamberty, Y. , De Ryck, M. , … Kenda, B. (2016). Brivaracetam: Rationale for discovery and preclinical profile of a selective SV2A ligand for epilepsy treatment. Epilepsia, 57, 538–548. [DOI] [PubMed] [Google Scholar]
- Kujirai, T. , Caramia, M. D. , Rothwell, J. C. , Day, B. L. , Thompson, P. D. , Ferbert, A. , … Marsden, C. D. (1993). Corticocortical inhibition in human motor cortex. The Journal of Physiology, 471, 501–519. [DOI] [PMC free article] [PubMed] [Google Scholar]
- Lee, C. Y. , Chen, C. C. , & Liou, H. H. (2009). Levetiracetam inhibits glutamate transmission through presynaptic P/Q‐type calcium channels on the granule cells of the dentate gyrus. British Journal of Pharmacology, 158, 1753–1762. [DOI] [PMC free article] [PubMed] [Google Scholar]
- Lioumis, P. , Kicic, D. , Savolainen, P. , Makela, J. P. , & Kahkonen, S. (2009). Reproducibility of TMS‐evoked EEG responses. Human Brain Mapping, 30, 1387–1396. [DOI] [PMC free article] [PubMed] [Google Scholar]
- Litvak, V. , Komssi, S. , Scherg, M. , Hoechstetter, K. , Classen, J. , Zaaroor, M. , … Kahkonen, S. (2007). Artifact correction and source analysis of early electroencephalographic responses evoked by transcranial magnetic stimulation over primary motor cortex. NeuroImage, 37, 56–70. [DOI] [PubMed] [Google Scholar]
- Lyseng‐Williamson, K. A. (2011). Spotlight on levetiracetam in epilepsy. CNS Drugs, 25, 901–905. [DOI] [PubMed] [Google Scholar]
- Macdonald, R. L. (1995). Carbamazepine. Mechanisms of action In Levy R. H., Mattson R. H., & Meldrum B. S. (Eds.), Antiepileptic drugs (pp. 491–498). New York: Raven. [Google Scholar]
- Mäki, H. , & Ilmoniemi, R. J. (2010). The relationship between peripheral and early cortical activation induced by transcranial magnetic stimulation. Neuroscience Letters, 478, 24–28. [DOI] [PubMed] [Google Scholar]
- Maris, E. , & Oostenveld, R. (2007). Nonparametric statistical testing of EEG‐ and MEG‐data. Journal of Neuroscience Methods, 164, 177–190. [DOI] [PubMed] [Google Scholar]
- Massimini, M. , Ferrarelli, F. , Huber, R. , Esser, S. K. , Singh, H. , & Tononi, G. (2005). Breakdown of cortical effective connectivity during sleep. Science, 309, 2228–2232. [DOI] [PubMed] [Google Scholar]
- McDonnell, M. N. , Orekhov, Y. , & Ziemann, U. (2006). The role of GABA(B) receptors in intracortical inhibition in the human motor cortex. Experimental brain research. Experimentelle Hirnforschung, 173, 86–93. [DOI] [PubMed] [Google Scholar]
- Mills, K. R. , Boniface, S. J. , & Schubert, M. (1992). Magnetic brain stimulation with a double coil: The importance of coil orientation. Electroencephalography and Clinical Neurophysiology, 85, 17–21. [DOI] [PubMed] [Google Scholar]
- Muthukumaraswamy, S. D. , & Liley, D. T. (2018). 1/f electrophysiological spectra in resting and drug‐induced states can be explained by the dynamics of multiple oscillatory relaxation processes. NeuroImage, 179, 582–595. [DOI] [PubMed] [Google Scholar]
- Niespodziany, I. , Andre, V. M. , Leclere, N. , Hanon, E. , Ghisdal, P. , & Wolff, C. (2015). Brivaracetam differentially affects voltage‐gated sodium currents without impairing sustained repetitive firing in neurons. CNS Neuroscience & Therapeutics, 21, 241–251. [DOI] [PMC free article] [PubMed] [Google Scholar]
- Niespodziany, I. , Rigo, J. M. , Moonen, G. , Matagne, A. , Klitgaard, H. , & Wolff, C. (2017). Brivaracetam does not modulate ionotropic channels activated by glutamate, gamma‐aminobutyric acid, and glycine in hippocampal neurons. Epilepsia, 58, e157–e161. [DOI] [PubMed] [Google Scholar]
- Noldy, N. E. , Neiman, J. , el‐Nesr, B. , & Carlen, P. L. (1990). Late auditory evoked potentials: A method for monitoring drug effects on the central nervous system. Neuropsychobiology, 23, 48–52. [DOI] [PubMed] [Google Scholar]
- Nutt, D. , Wilson, S. , Lingford‐Hughes, A. , Myers, J. , Papadopoulos, A. , & Muthukumaraswamy, S. (2015). Differences between magnetoencephalographic (MEG) spectral profiles of drugs acting on GABA at synaptic and extrasynaptic sites: A study in healthy volunteers. Neuropharmacology, 88, 155–163. [DOI] [PubMed] [Google Scholar]
- Oldfield, R. C. (1971). The assessment and analysis of handedness: The Edinburgh inventory. Neuropsychologia, 9, 97–113. [DOI] [PubMed] [Google Scholar]
- Oostenveld, R. , Fries, P. , Maris, E. , & Schoffelen, J. M. (2011). FieldTrip: Open source software for advanced analysis of MEG, EEG, and invasive electrophysiological data. Computational Intelligence and Neuroscience, 2011, 156869. [DOI] [PMC free article] [PubMed] [Google Scholar]
- Pellicciari, M. C. , Bonni, S. , Ponzo, V. , Cinnera, A. M. , Mancini, M. , Casula, E. P. , … Koch, G. (2018). Dynamic reorganization of TMS‐evoked activity in subcortical stroke patients. NeuroImage, 175, 365–378. [DOI] [PubMed] [Google Scholar]
- Pellicciari, M. C. , Brignani, D. , & Miniussi, C. (2013). Excitability modulation of the motor system induced by transcranial direct current stimulation: A multimodal approach. NeuroImage, 83, 569–580. [DOI] [PubMed] [Google Scholar]
- Peurala, S. H. , Muller‐Dahlhaus, J. F. , Arai, N. , & Ziemann, U. (2008). Interference of short‐interval intracortical inhibition (SICI) and short‐interval intracortical facilitation (SICF). Clinical Neurophysiology, 119, 2291–2297. [DOI] [PubMed] [Google Scholar]
- Premoli, I. , Biondi, A. , Carlesso, S. , Rivolta, D. , & Richardson, M. P. (2017). Lamotrigine and levetiracetam exert a similar modulation of TMS‐evoked EEG potentials. Epilepsia, 58, 42–50. [DOI] [PMC free article] [PubMed] [Google Scholar]
- Premoli, I. , Castellanos, N. , Rivolta, D. , Belardinelli, P. , Bajo, R. , Zipser, C. , … Ziemann, U. (2014). TMS‐EEG signatures of GABAergic neurotransmission in the human cortex. The Journal of Neuroscience, 34, 5603–5612. [DOI] [PMC free article] [PubMed] [Google Scholar]
- Premoli, I. , Costantini, A. , Rivolta, D. , Biondi, A. , & Richardson, M. P. (2017). The effect of Lamotrigine and Levetiracetam on TMS‐evoked EEG responses depends on stimulation intensity. Frontiers in Neuroscience, 11, 585. [DOI] [PMC free article] [PubMed] [Google Scholar]
- Premoli, I. , Rivolta, D. , Espenhahn, S. , Castellanos, N. , Belardinelli, P. , Ziemann, U. , & Muller‐Dahlhaus, F. (2014). Characterization of GABAB‐receptor mediated neurotransmission in the human cortex by paired‐pulse TMS‐EEG. NeuroImage, 103, 152–162. [DOI] [PubMed] [Google Scholar]
- Reis, J. , Wentrup, A. , Hamer, H. M. , Mueller, H. H. , Knake, S. , Tergau, F. , … Rosenow, F. (2004). Levetiracetam influences human motor cortex excitability mainly by modulation of ion channel function‐‐a TMS study. Epilepsy Research, 62, 41–51. [DOI] [PubMed] [Google Scholar]
- Ridding, M. C. , Taylor, J. L. , & Rothwell, J. C. (1995). The effect of voluntary contraction on cortico‐cortical inhibition in human motor cortex. Journal of Physiology (London), 487, 541–548. [DOI] [PMC free article] [PubMed] [Google Scholar]
- Rogasch, N. C. , & Fitzgerald, P. B. (2013). Assessing cortical network properties using TMS‐EEG. Human Brain Mapping, 34, 1652–1669. [DOI] [PMC free article] [PubMed] [Google Scholar]
- Rogasch, N. C. , Sullivan, C. , Thomson, R. H. , Rose, N. S. , Bailey, N. W. , Fitzgerald, P. B. , … Hernandez‐Pavon, J. C. (2017). Analysing concurrent transcranial magnetic stimulation and electroencephalographic data: A review and introduction to the open‐source TESA software. NeuroImage, 147, 934–951. [DOI] [PubMed] [Google Scholar]
- Rogasch, N. C. , Thomson, R. H. , Farzan, F. , Fitzgibbon, B. M. , Bailey, N. W. , Hernandez‐Pavon, J. C. , … Fitzgerald, P. B. (2014). Removing artefacts from TMS‐EEG recordings using independent component analysis: Importance for assessing prefrontal and motor cortex network properties. NeuroImage, 101, 425–439. [DOI] [PubMed] [Google Scholar]
- Roshan, L. , Paradiso, G. O. , & Chen, R. (2003). Two phases of short‐interval intracortical inhibition. Experimental brain research. Experimentelle Hirnforschung, 151, 330–337. [DOI] [PubMed] [Google Scholar]
- Rossini, P. M. , Burke, D. , Chen, R. , Cohen, L. G. , Daskalakis, Z. , Di Iorio, R. , … Ziemann, U. (2015). Non‐invasive electrical and magnetic stimulation of the brain, spinal cord, roots and peripheral nerves: Basic principles and procedures for routine clinical and research application. An updated report from an I.F.C.N. committee. Clinical Neurophysiology, 126, 1071–1107. [DOI] [PMC free article] [PubMed] [Google Scholar]
- Sanger, T. D. , Garg, R. R. , & Chen, R. (2001). Interactions between two different inhibitory systems in the human motor cortex. The Journal of Physiology, 530(2), 307–317. [DOI] [PMC free article] [PubMed] [Google Scholar]
- Sarasso, S. , Boly, M. , Napolitani, M. , Gosseries, O. , Charland‐Verville, V. , Casarotto, S. , … Massimini, M. (2015). Consciousness and complexity during unresponsiveness induced by Propofol, xenon, and ketamine. Current Biology, 25, 3099–3105. [DOI] [PubMed] [Google Scholar]
- Shafi, M. M. , Vernet, M. , Klooster, D. , Chu, C. J. , Boric, K. , Barnard, M. E. , … Chang, B. S. (2015). Physiological consequences of abnormal connectivity in a developmental epilepsy. Annals of Neurology, 77, 487–503. [DOI] [PMC free article] [PubMed] [Google Scholar]
- Sohn, Y. H. , Kaelin‐Lang, A. , Jung, H. Y. , & Hallett, M. (2001). Effect of levetiracetam on human corticospinal excitability. Neurology, 57, 858–863. [DOI] [PubMed] [Google Scholar]
- Solinas, C. , Lee, Y. C. , & Reutens, D. C. (2008). Effect of levetiracetam on cortical excitability: A transcranial magnetic stimulation study. European Journal of Neurology, 15, 501–505. [DOI] [PubMed] [Google Scholar]
- Sommer, M. , Gileles, E. , Knappmeyer, K. , Rothkegel, H. , Polania, R. , & Paulus, W. (2012). Carbamazepine reduces short‐interval interhemispheric inhibition in healthy humans. Clinical Neurophysiology, 123, 351–357. [DOI] [PubMed] [Google Scholar]
- Sun, Y. , Farzan, F. , Mulsant, B. H. , Rajji, T. K. , Fitzgerald, P. B. , Barr, M. S. , … Daskalakis, Z. J. (2016). Indicators for remission of suicidal ideation following magnetic seizure therapy in patients with treatment‐resistant depression. JAMA Psychiatry, 73, 337–345. [DOI] [PubMed] [Google Scholar]
- Suzdak, P. D. , & Jansen, J. A. (1995). A review of the preclinical pharmacology of tiagabine: A potent and selective anticonvulsant GABA uptake inhibitor. Epilepsia, 36, 612–626. [DOI] [PubMed] [Google Scholar]
- Ter Braack, E. M. , Koopman, A. E. , & van Putten, M. J. (2016). Early TMS evoked potentials in epilepsy: A pilot study. Clinical Neurophysiology, 127, 3025–3032. [DOI] [PubMed] [Google Scholar]
- Thomson, A. M. , Bannister, A. P. , Hughes, D. I. , & Pawelzik, H. (2000). Differential sensitivity to Zolpidem of IPSPs activated by morphologically identified CA1 interneurons in slices of rat hippocampus. The European Journal of Neuroscience, 12, 425–436. [DOI] [PubMed] [Google Scholar]
- Valentin, A. , Arunachalam, R. , Mesquita‐Rodrigues, A. , Garcia Seoane, J. J. , Richardson, M. P. , Mills, K. R. , & Alarcon, G. (2008). Late EEG responses triggered by transcranial magnetic stimulation (TMS) in the evaluation of focal epilepsy. Epilepsia, 49, 470–480. [DOI] [PubMed] [Google Scholar]
- Veniero, D. , Bortoletto, M. , & Miniussi, C. (2012). Cortical modulation of short‐latency TMS‐evoked potentials. Frontiers in Human Neuroscience, 6, 352. [DOI] [PMC free article] [PubMed] [Google Scholar]
- Werhahn, K. J. , Kunesch, E. , Noachtar, S. , Benecke, R. , & Classen, J. (1999). Differential effects on motorcortical inhibition induced by blockade of GABA uptake in humans. The Journal of Physiology, 517(Pt 2), 591–597. [DOI] [PMC free article] [PubMed] [Google Scholar]
- Yang, X. , Bognar, J., Jr. , He, T. , Mohammed, M. , Niespodziany, I. , Wolff, C. , … Dubinsky, J. M. (2015). Brivaracetam augments short‐term depression and slows vesicle recycling. Epilepsia, 56, 1899–1909. [DOI] [PubMed] [Google Scholar]
- Ziemann, U. (2011). Transcranial magnetic stimulation at the Interface with other techniques: A powerful tool for studying the human cortex. The Neuroscientist: A Review Journal Bringing Neurobiology, Neurology and Psychiatry, 17, 368–381. [DOI] [PubMed] [Google Scholar]
- Ziemann, U. , Lönnecker, S. , Steinhoff, B. J. , & Paulus, W. (1996). Effects of antiepileptic drugs on motor cortex excitability in humans: A transcranial magnetic stimulation study. Annals of Neurology, 40, 367–378. [DOI] [PubMed] [Google Scholar]
- Ziemann, U. , Paulus, W. , Nitsche, M. A. , Pascual‐Leone, A. , Byblow, W. D. , Berardelli, A. , … Rothwell, J. C. (2008). Consensus: Motor cortex plasticity protocols. Brain Stimulation, 1, 164–182. [DOI] [PubMed] [Google Scholar]
- Ziemann, U. , Reis, J. , Schwenkreis, P. , Rosanova, M. , Strafella, A. , Badawy, R. , & Muller‐Dahlhaus, F. (2015). TMS and drugs revisited 2014. Clinical Neurophysiology, 126, 1847–1868. [DOI] [PubMed] [Google Scholar]
- Ziemann, U. , Rothwell, J. C. , & Ridding, M. C. (1996). Interaction between intracortical inhibition and facilitation in human motor cortex. The Journal of Physiology, 496, 873–881. [DOI] [PMC free article] [PubMed] [Google Scholar]
- Ziemann, U. , Tergau, F. , Wassermann, E. M. , Wischer, S. , Hildebrandt, J. , & Paulus, W. (1998). Demonstration of facilitatory I wave interaction in the human motor cortex by paired transcranial magnetic stimulation. The Journal of Physiology, 511(Pt 1), 181–190. [DOI] [PMC free article] [PubMed] [Google Scholar]
- Zipser, C. M. , Premoli, I. , Belardinelli, P. , Castellanos, N. , Rivolta, D. , Heidegger, T. , … Ziemann, U. (2018). Cortical excitability and Interhemispheric connectivity in early relapsing‐remitting multiple sclerosis studied with TMS‐EEG. Frontiers in Neuroscience, 12, 393. [DOI] [PMC free article] [PubMed] [Google Scholar]
Associated Data
This section collects any data citations, data availability statements, or supplementary materials included in this article.
Supplementary Materials
Supplementary Material