

Abstract
The modulation of theta frequency activity plays a major role in inhibitory control processes. However, the relevance of resting theta band activity and of the ability to spontaneously modulate this resting theta activity for neural mechanisms underlying inhibitory control is elusive. Various theoretical conceptions suggest to take these aspects into consideration. In the current study, we examine whether the strength of resting theta band activity or the ability to modulate the resting state theta activity affects response inhibition. We combined EEG‐time frequency decomposition and beamforming in a conflict‐modulated Go/Nogo task. A sample of N = 66 healthy subjects was investigated. We show that the strength of resting state theta activity modulates the effects of conflicts during motor inhibitory control. Especially when resting theta activity was low, conflicts strongly affected response inhibition performance and total theta band activity during Nogo trials. These effects were associated with theta‐related activity differences in the superior (BA7) and inferior parietal cortex (BA40). The results were very specific for total theta band activity since evoked theta activity and measures of intertrial phase coherency (phase‐locking factor) were not affected. The data suggest that the strength of resting state theta activity modulates processing of a theta‐related alarm or surprise signal during inhibitory control. The ability to voluntarily modulate theta band activity did not affect conflict‐modulated inhibitory control. These findings have important implications for approaches aiming to optimize human cognitive control.
Keywords: beamforming, EEG, response inhibition, resting state, theta oscillations
1. INTRODUCTION
A major goal in cognitive neuroscience research is to understand the neural underpinnings of response inhibition processes, which constitute an important aspect of cognitive control (Aron, Robbins, & Poldrack, 2014; Bari & Robbins, 2013; Diamond, 2013). From a human neurophysiological perspective, these processes are reflected by specific event‐related potentials, namely the Nogo‐N2 and the Nogo‐P3. The precise functional interpretation of the neurophysiological correlates is still a matter of debate (Huster, Enriquez‐Geppert, Lavallee, Falkenstein, & Herrmann, 2013). Considering neural oscillations, several lines of evidence suggest that the modulation of theta frequency activity plays a significant role in inhibitory control processes (Chmielewski, Mückschel, Dippel, & Beste, 2016; Dippel, Chmielewski, Mückschel, & Beste, 2016; Dippel, Mückschel, Ziemssen, & Beste, 2017; Huster et al., 2013; Liu, Woltering, & Lewis, 2014; Müller, Anokhin, & Lindenberger, 2017; Vahid, Mückschel, Neuhaus, Stock, & Beste, 2018). This seems reasonable since modulations of medial frontal theta oscillatory power have been suggested to be involved in various facets of cognitive control (Cavanagh & Frank, 2014; Cohen, 2014a; De Blasio & Barry, 2013; Harper, Malone, & Bernat, 2014). However, theta oscillations do not serve a single functional purpose (Cohen, 2014a).
When using Go/Nogo tasks to measure response inhibition, studies have commonly found that medial frontal theta band activity is increased during Nogo compared to Go trials (Chmielewski, Mückschel, et al., 2016; Dippel et al., 2016; Dippel et al., 2017; Huster et al., 2013; Liu et al., 2014; Müller et al., 2017; Vahid et al., 2018). The degree of this increase seems to be related to the need to inhibit a prepotent response in Nogo trials (Quetscher et al., 2015). As with other aspects of cognitive control, there are strong interindividual differences in the increase of theta frequency band power in Nogo trials (Moore, Mills, Marshman, & Corr, 2012; Müller et al., 2017; Schmüser et al., 2016; Vahid et al., 2018). Recent analyses using machine‐learning approaches show that particularly inhibitory control‐related theta frequency band activity predicts response inhibition performance well (Vahid et al., 2018). In line with overarching theoretical conceptions concerning the function of the medial frontal cortex and theta band activity (Cavanagh & Frank, 2014), the increase in theta band power in Nogo trials has been suggested to reflect an “alarm” or “surprise signal,” which is crucial for increasing cognitive control (Chmielewski, Mückschel, et al., 2016; Dippel et al., 2017; Wessel, 2018). Notably, some findings suggest that the theta frequency band's “surprise/alarm signal” function is affected by the individual's ability to voluntarily modulate or increase neural processes relevant for cognitive control (Inzlicht & Tullett, 2010; Rigoni, Pourtois, & Brass, 2015; Rigoni, Wilquin, Brass, & Burle, 2013). Based on these findings, it could be assumed that the individual ability to increase theta activity beyond a certain resting state activity is essential for successful response inhibition performance. On the other hand, it is increasingly recognized that there are similarities between resting dynamics and activity related to cognitive control (Becker, Van de Ville, & Kleinschmidt, 2018; Haag et al., 2015; Mahjoory, Cesnaite, Hohlefeld, Villringer, & Nikulin, 2019; Tavor et al., 2016). Some findings suggest that resting state EEG activity can predict cognitive control (Nakao, Bai, Nashiwa, & Northoff, 2013) and that resting theta activity in the middle frontal gyrus is associated with modulations in the topography of EEG activity during response inhibition (Lansbergen, Schutter, & Kenemans, 2007; Schiller, Gianotti, Nash, & Knoch, 2014). Furthermore, data from developmental studies suggest that resting theta power is associated with response inhibition performance (Liu et al., 2014). Taken together, it seems that not only the ability to modulate resting state theta activity could have an influence on inhibitory control, but also the strength of resting state theta activity per se. Therefore, it appears that two opposing, possibly even unrelated aspects of theta‐related activity have a significant influence on cognitive control mechanisms. In the current study, we examine whether the strength of resting theta band activity or the ability to modulate this resting state theta activity has a stronger impact on response inhibition processes.
This is a very important research objective considering the rise of cognitive enhancement approaches aimed at improving cognitive performance in clinical and nonclinical populations (Enriquez‐Geppert, Huster, & Herrmann, 2017; Reiner, Gruzelier, & Bamidis, 2017). The latter is intensely debated from ethical perspectives (Bard et al., 2018). One popular method for increasing cognitive abilities is EEG‐based neurofeedback (Enriquez‐Geppert et al., 2017). Usually, these approaches train the subject's ability to self‐induce modulations of an EEG parameter beyond a (resting) baseline level (Bluschke, Roessner, & Beste, 2016; Enriquez‐Geppert et al., 2014; Enriquez‐Geppert et al., 2017; Enriquez‐Geppert, Huster, & Herrmann, 2013; Sitaram et al., 2017), for example, they train participants to phasically increase theta frequency band power. To increase the usefulness of such approaches and their effectiveness in modulating impulsive behavior and response inhibition, it is important to know whether these approaches should train the ability to phasically upregulate theta band activity beyond a certain baseline level, or whether they should rather try to induce sustained increases in resting theta band activity. Importantly, a significant proportion of subjects do not manage to achieve control over their brain metrics using neurofeedback approaches and are not able to reliably modulate activity in the relevant frequency band (Alkoby, Abu‐Rmileh, Shriki, & Todder, 2018). This interindividual variability makes it possible to identify subjects who are able to voluntarily modulate theta activity well beyond an individual resting theta baseline level. It is hence possible to define groups of subjects showing a relatively high/low resting theta activity (i.e., highbaseline, lowbaseline) and groups of subjects showing relatively high/low ability to modulate theta band activity beyond the baseline level (i.e., highmodulation, lowmodulation; refer Section 2 for details).
In order to evaluate whether the strength of resting theta band activity or the ability to voluntarily upregulate resting state theta activity has a stronger impact on response inhibition processes, we examine behavioral performance, theta oscillatory dynamics and associated functional neuroanatomical structures in a modified Go/Nogo task. The task was modulated such that half of the Go trials and half of the NoGo trials involved conflicting visual and auditory stimuli. This modification is important since not only response inhibition processes (Chmielewski, Mückschel, et al., 2016; Dippel et al., 2016; Dippel et al., 2017; Huster et al., 2013; Liu et al., 2014; Müller et al., 2017; Vahid et al., 2018), but also processes related to the monitoring of conflicting information modulate theta frequency activity (Cohen & Donner, 2013; Lavallee, Herrmann, Weerda, & Huster, 2014; Tang, Hu, & Chen, 2013; Wang, Li, Zheng, Wang, & Liu, 2014). Consequently, it has been shown that response inhibition is modulated by sources of perceptual conflicts: Response inhibition is impeded when the relevant visual information instructs participants to inhibit a response while the concurrent irrelevant auditory information asks them to execute a response. In such situations, theta band activity is increased (Chmielewski, Mückschel, et al., 2016; Chmielewski, Wolff, Mückschel, Roessner, & Beste, 2016). Since conflicting information modulates the difficulty to inhibit a response, which in turn strongly affects theta‐related activity, such a Go/Nogo conflict task seems particularly useful to examine whether the strength of resting theta band activity or the ability to modulate resting state theta activity has a stronger impact on response inhibition processes.
Currently, no clear‐cut hypotheses can be drawn as to whether and how interindividual differences in baseline theta activity or the interindividual differences in the ability to phasically upregulate theta band activity affect the impact of conflicting information on response inhibition performance. However, as mentioned above, evidence indicates that successful response inhibition performance is associated with elevated (event‐related) theta band activity (Chmielewski, Mückschel, et al., 2016; Dippel et al., 2016, 2017Huster et al., 2013; Liu et al., 2014; Müller et al., 2017; Vahid et al., 2018). The same is the case for conflict monitoring processes (Cohen & Donner, 2013; Lavallee et al., 2014; Tang et al., 2013; Wang et al., 2014). Based on this, it is conceivable that there are stronger effects of conflicting information during inhibitory control in the lowbaseline and lowmodulation groups compared to the highbaseline and highmodulation groups at the behavioral and neurophysiological level. In particular, the false alarm rates (i.e., erroneous behavioral responses on Nogo trials) are expected to increase more from nonconflicting to conflicting Nogo trials in the lowbaseline and lowmodulation groups compared to the highbaseline and highmodulation groups. Also, theta band activity is assumed to undergo stronger modulations between congruency manipulations in Nogo trials in the lowbaseline and lowmodulation groups, compared to the highbaseline and highmodulation groups. In the current study, we examine theta band activity by analyzing the total power, evoked power and the phase‐locking factor (PLF) of Nogo‐related theta oscillations (see Section 2 for details on these measures). On a functional neuroanatomical level, these modulations (especially in the total theta power) may be associated with superior prefrontal and parietal structures. The reason is that superior prefrontal areas are well‐known to be an important structure in a cortical network subserving inhibitory control (Bari & Robbins, 2013; Hung, Gaillard, Yarmak, & Arsalidou, 2018; Obeso et al., 2017; Xu et al., 2017), and that parietal regions become involved when conflicting sensory information modulated behavioral control (Adelhöfer et al., 2018; Bodmer & Beste, 2017; Fokin et al., 2008; Gothelf et al., 2007; Ocklenburg, Güntürkün, & Beste, 2011; Takeichi et al., 2010).
2. MATERIALS AND METHODS
2.1. A priori sample size estimation
The study question supposes interactive effects between the level of conflict evident during response inhibition and a group factor (i.e., highbaseline, lowbaseline; highmodulation, lowmodulation). Therefore, the data were analyzed in a mixed effects ANOVA (refer Section 2.8) using the within‐subject factors “GoNogo” (Go vs. Nogo trials) and “compatibility” (compatible vs. incompatible trials). “Group” (highbaseline vs. lowbaseline; highmodulation vs. lowmodulation) was used as a between‐subject factor. Since there was no prior data as a basis for the sample size estimation, we conservatively considered that a small effect size (partial eta squared ηp 2) of .05 should be detectable with a power of 95% assuming a moderate intercorrelation among the repeated measures. Using G*Power (Faul, Erdfelder, Lang, & Buchner, 2007), the a priori sample size estimation revealed a required total sample size of N = 64. As shown in Section 3, the actual obtained effect sizes were ηp 2 ~.07.
2.2. Participants
N = 72 right‐handed adults without any physical, psychiatric or neurological illnesses participated in the study. Due to technical problems or excessive blinking artifacts, we had to exclude the data of six participants. The final sample consisted of N = 66 subjects (33 males, age: 25.72 ± 4.76, IQ: 109.51 ± 12.02). In that sample, we defined two different types of groups (refer Figure 1).
Figure 1.
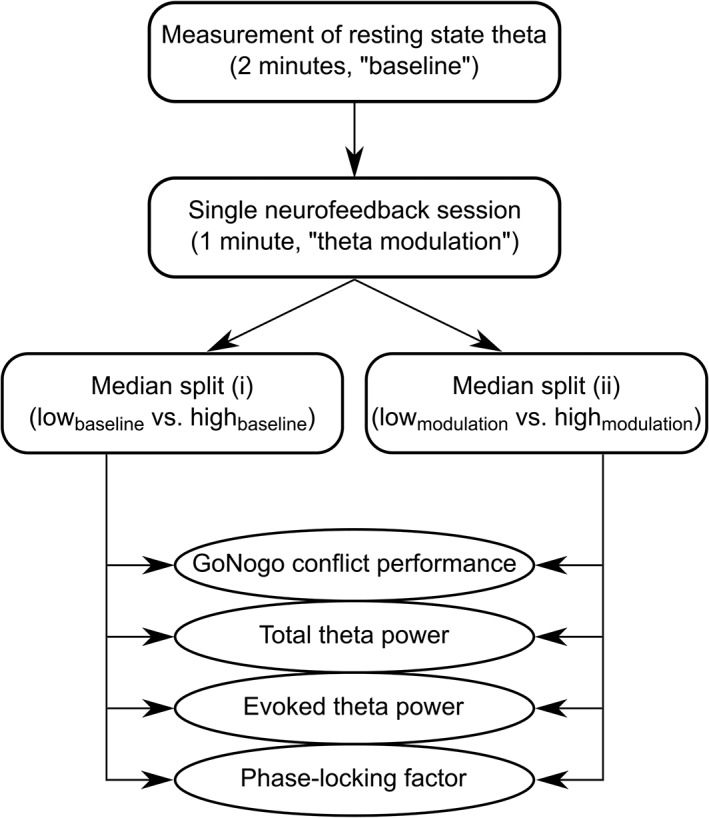
Overview of assessment methods, grouping, and outcome variables of the study
First, we split the data into two groups based on the median of the sample's resting theta band activity (median split [i]: lowbaseline vs. highbaseline). These two groups did not differ significantly regarding age (t[64] = .03, p = .979) and IQ (t[64] = 0.70, p = .395). Then, we performed another median split with the same sample of participants but using the participants' ability to modulate/upregulate their baseline theta frequency band activity (median split [ii]: lowmodulation vs. highmodulation). Details regarding this procedure are given in Section 2.3. Again, there were no significant group differences regarding age (t[64] = 1.34, p = .185) and IQ (t[64] = 0.58, p = .567). All subjects gave written informed consent according to the Declaration of Helsinki and received a financial compensation for their participation. The study was approved by the local ethics committee of the TU Dresden.
2.3. Assessment of resting theta activity and ability to voluntarily upregulate theta band activity
In order to measure the participants' resting theta band activity and to examine their ability to spontaneously upregulate this baseline resting theta band activity, we used a neurofeedback setup and the software SAM (Self‐regulation and Attention Management, (Gevensleben et al., 2009)). Electrode Cz was used to continuously record brain electrical activity. Electrodes above and below the right eye served to record and correct for eye movement artifacts. An electrode on the right earlobe was used as reference electrode and the ground electrode was placed on the forehead. Theta power (4–7 Hz) was determined by an online Butterworth filter. Because eye movement artifacts can influence the estimation of theta frequency band activity, time intervals with strong blink artifacts were removed online. When the participants caused too many ocular or muscular artifacts, a sad smiley appeared on the screen. Using this setup, the participants' resting theta band activity was measured for 2 min while they were presented with a nonmoving cartoon figure on the screen. The resting state activity was used for median split [i]. Following the baseline recording, participants were instructed to find a way to make the cartoon character move forward on the screen. Movement of the figure occurred when the theta frequency band activity increased compared to the individually measured baseline activity. The instruction was to make the character walk forward as much as possible during a 1‐min time period. As the participants did not receive any hints or strategies on how to succeed in their task and since the time interval was short enough to avoid strong learning effects, a reliable estimate for the ability to spontaneously upregulate theta frequency band activity was provided. To rule out any possible influence of the strength of baseline theta band activity on the ability to modulate theta frequency band activity, we performed an offline calculation of the ratio between the average change of theta frequency band power and baseline theta band power for each participant. We then used this ratio to perform the median‐split for the modulation grouping (median split [ii]).
2.4. Task
The Go/Nogo task was administered using the software package “Presentation” (Neurobehavioral Systems). In this task, 70% of the trials presented were Go trials and 30% of the trials presented were Nogo trials. This frequency of Go and Nogo trials has been shown to increase the probability of premature responses in Nogo trials (Dockree et al., 2004, 2006). Participants were required to respond as fast as possible on Go trials using their right hand. As visual stimuli, the German words for “stop” (i.e., STOPP) and “press” (DRÜCK) were presented on a 21‐in. TFT screen for 400 ms. Go and Nogo trials were accompanied by an auditory stimulus (i.e., the word “STOPP” or “DRÜCK”). These auditory stimuli were created using “google translate” to ensure emotional neutrality. To ensure that no effects of stimulus presentation duration time would occur, the presentation onset and offset of visual and auditory stimuli were identical. In 50 % of trials, visual and auditory information was (in)compatible. In the compatible trials, the visual and the auditory stimulus had the same meaning. In the incompatible trials, the visual and the auditory stimulus had the opposite meaning (i.e., the visual word DRÜCK was accompanied with the auditory presentation of the word STOPP or vice versa). Participants were explicitly instructed to only react to visual stimuli while ignoring auditory stimuli. It has been shown that response inhibition performance is especially compromised in the incompatible Nogo condition (Chmielewski, Mückschel, et al., 2016). Overall, 240 trials were presented (168 Go trials, 72 Nogo trials), equally divided across four blocks of 60 trials each. The distribution of the different trial types was equal across the different blocks. Trials were separated by intertrial intervals jittered between 1,700 and 2,100 ms. Go trials were coded as misses when a response occurred directly after stimulus onset (0–200 ms) or when no response was obtained within the time interval between 200 and 1,200 ms, while NoGo trials were coded as false alarms when a response occurred within 1,500 ms. Each Go trial was 1,200 ms long and each Nogo trial was 1,500 ms long. That means also when a response was executed in Go trials, the trials ended after 1,200 ms. For Nogo trials, the trials ended after 1,500 ms even when a response was executed. The ITI started after these time intervals. The timing of the stimuli was similar to previous studies examining theta modulations in Go/Nogo tasks (Chmielewski, Mückschel, et al., 2016).
2.5. EEG recording and analysis
During the task, an EEG was recorded from 60 Ag/AgCl electrodes at equidistant positions with a sampling rate of 500 Hz (ground electrode at θ = 58, ϕ = 78, reference electrode at θ = 90, ϕ = 90). Electrode impedances were kept below 5 kΩ. During offline data processing, an IIR‐band‐pass filter from 0.5 to 20 Hz with a slope of 48 dB/oct was applied. Furthermore, a 50 Hz notch filter was used. Technical artifacts (i.e., offsets in the EEG data) and muscular artifacts were removed by means of a manual raw data inspection. Afterward, an independent component analysis (ICA, infomax algorithm) was applied to identify and manually remove recurrent artifacts such as horizontal and vertical eye movements, blinks and pulse artifacts. Subsequently, the data was locked to the onset of the Go and Nogo stimuli. The segments had a length of 4,000 ms (2,000 ms before until 2,000 ms after the onset of the stimulus presentation) to provide a time period which was long enough to analyze theta frequency band oscillations. Only Go trials with a response between 200 and 1,200 ms after stimulus onset and Nogo trials with no response until 1,500 ms after stimulus onset were included in the data analysis. With an automated artifact rejection procedure trials with an amplitude above 100 μV or below −100 μV or with an activity below 0.5 μV in a 100 ms interval were removed. We then applied a current source density (CSD) transformation (Nunez & Pilgreen, 1991) with 4 splines and 10 polynomials to obtain a reference‐free representation of the data and to improve identification of the electrodes with the strongest effects. A baseline correction in the time interval from −200 ms to stimulus onset was applied and the segments of each participant were averaged for Go trials and Nogo trials in compatible and incompatible condition, respectively.
2.6. Time‐frequency analysis
Time‐frequency (TF) decomposition was applied to analyze theta band activity during the Go/Nogo task in detail. We used three different metrics to examine theta power: evoked power, total power and phase‐PLF. Evoked power is phase‐locked to the onset of an event. When averaging the event‐locked EEG data, only frequency activity that is phase‐synchronized to the stimulus onset will be seen in the grand average; activities with unaligned phases will cancel themselves out during averaging processes (Cohen, 2014b; Roach & Mathalon, 2008). Total power consists of phase‐locked and nonphase‐locked aspects of power and only reflects the magnitude of frequency oscillations, not their phase synchronicity (Roach & Mathalon, 2008). It can be calculated by applying wavelet analysis on single‐trial data and averaging the time‐frequency power of all trials (Cohen, 2014b). The PLF is a measure of event‐related phase consistency in time and frequency domains across trials, which is independent of the signal's power/amplitude (Roach & Mathalon, 2008; Yordanova & Kolev, 1998). Its values reach from zero to one with zero representing a random and heterogeneous distribution of phase angles across trials and one representing completely synchronized phase angles across all trials (Roach & Mathalon, 2008).
The TF analyses were conducted with a continuous wavelet transformation using Morlet wavelets (w):
with the parameters t = time, f = frequency, , σt = wavelet duration, and . A Morlet parameter of f 0/σ f = 5.5 was applied, where f 0 is the central frequency and σ f defines the Gaussian shape in the frequency domain. The equation σ t = 1/(2πσ f) relates σ t and σ f. Analyses were carried out in 40 steps of 0.5 Hz in the frequency range from 0.5 to 20 Hz. Time and frequency resolutions (or wavelet duration and spectral bandwidth) can be calculated as 2σ t and 2σ f, respectively, to analyze different f 0. The wavelet transformation was performed on the previously described averaged data of each condition to calculate evoked theta power (phase‐locked theta power). Furthermore, total theta power, as well as the PLF were calculated by applying the wavelet transformation on single‐trial data. The total theta power, evoked theta power and the PLF were calculated for each subject and condition. Finally, we identified maximal theta power based on visual inspection of the grand average scalp topography for each group at electrode Cz in the time interval between 210 and 250 ms in the frequency band of 6 Hz. The mean total and evoked power, as well as the mean PLF of this time‐frequency window, were used for statistical analysis.
2.7. Beamforming analysis
The source reconstruction on the basis of the time‐frequency decomposed data was carried out with the help of a dynamic imaging of coherent sources (DICS) beamformer. Importantly, for the beamforming analysis, the wavelet transformation procedure was applied without prior CSD‐transformation of the data. The reason for this is that both the CSD‐transformation and the beamformer function as a spatial filter (Kayser & Tenke, 2015; Nunez & Pilgreen, 1991). For the beamforming analysis, the TF decomposition was applied on average‐referenced data (Gross et al., 2001) on the same time‐frequency window that was shown to reveal significant interaction effects at the sensory level for the total wavelet power. The DICS beamforming method was successfully applied to reconstruct the sources of frequency specific activity in various EEG and MEG studies (Bauer, Oostenveld, Peeters, & Fries, 2006; Hoogenboom, Schoffelen, Oostenveld, Parkes, & Fries, 2006; Mückschel, Stock, Dippel, Chmielewski, & Beste, 2016; Schneider, Debener, Oostenveld, & Engel, 2008). The beamforming analysis on the time‐frequency decomposed EEG data was performed using the “fieldtrip” software package (Oostenveld, Fries, Maris, & Schoffelen, 2011). This was done for the time‐frequency decomposed EEG data. The DICS beamformer was applied to average referenced data (Gross et al., 2001). A prestimulus interval of −600 to −100 ms was selected as the baseline interval. A multitaper frequency transformation was performed to obtain the power and cross‐spectral density matrix. For the source reconstruction, 6 Hz (smoothing window ± 1.67) was selected as the mean frequency, since the observed power peak was around 6 Hz and the data analysis at the wavelet/sensor level revealed significant effects (see Section 3).
For the source estimation, the DICS beamformer was applied using the implemented forward model of fieldtrip and the MNI brain template. For mathematical details on the forward model construction see Oostenveld, Stegeman, Praamstra, and van Oosterom (2003). The time‐frequency window selected for the beamforming analysis was based on the data analyzed at the electrode level (see above). To ensure that the DICS beamformer was applied only to significant TF intervals of at least three full cycles per core frequency of interest, a time window of 500 ms in the range of −20 to 480 ms relative to stimulus onset was used. Importantly, only effects that were significant at the sensor level, that is, revealed robust effects in total theta power were used for the beamforming analysis. After realigning the EEG electrodes used to the forward model, the lead field matrix was calculated by dividing the brain volume of the forward model into grids with 10 mm resolution. The lead field matrix was then calculated for each grid point. A common spatial filter based on all conditions, with the regularization parameter set to 5%, was used separately for each condition to estimate the activity of the sources.
2.8. Statistical analysis
We used SPSS Statistics 25 to analyze both the behavioral and the neurophysiological data. Mixed‐effects ANOVAs were calculated with the within‐subject factor “compatibility” (compatible vs. incompatible) for behavioral data and with the additional within‐subject factor “Go/Nogo” (Go trials vs. Nogo trials) for neurophysiological data. The factor “group” (Resting theta activity grouping: lowbaseline vs. highbaseline; modulation grouping: lowmodulation vs. highmoduation) was applied as between‐subjects factor. Greenhouse–Geisser correction was applied for all tests. All post‐hoc tests were Bonferroni‐corrected. For the descriptive statistics, the mean and standard error of the mean are given. For additional analyses (regression analyses and mixed‐effects ANOVA with an alternative grouping approach) see Supporting Information.
3. RESULTS
To differentiate between participants with a lower versus a higher resting theta frequency band activity, the sample was split at the sample median of the resting theta activity (i.e., median split (i); = 3.27 μV/m2) resulting in a highbaseline group (n = 33, 3.74 μV/m2 ± 0.06) and a lowbaseline group (n = 33, 2.93 μV/m2 ± 0.04). Further, a median split based on the sample median of the ratio between the average change of theta frequency band power and baseline theta band power (median split [ii]; = 0.01 μV/m2) was performed. This second median split resulted in a highmodulation group (n = 33, 0.08 μV/m2 ± 0.01) and a lowmodulation group (n = 33, −0.04 μV/m2 ± 0.01). Thus, subjects with a lower versus a higher ability to modulate/upregulate their theta frequency band activity could be identified. The two different groupings (resting theta activity grouping and modulation grouping) did not correlate significantly with each other (absolute values: r(64) = .10, p = .441, group codings: τ(64) = .09, p = .464), which suggests that the examined theta‐related aspects are independent from each other. For more details regarding the choice of the median split to examine the study question, please refer to supplemental material (Analysis S1, Figure S1, Tables S1 and S2).
3.1. Resting theta activity grouping; median split (i)
3.1.1. Behavioral data
The behavioral data and neurophysiological data are shown in Figure 2.
Figure 2.
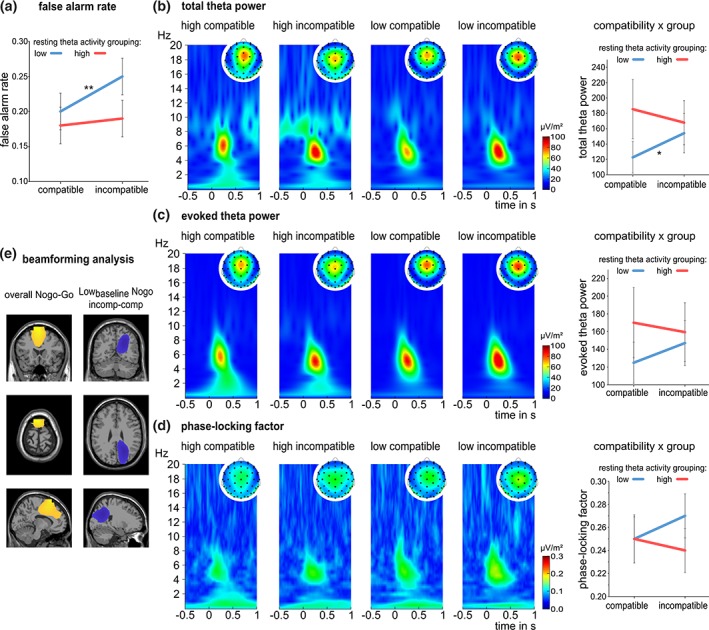
Behavioral and neurophysiological data of the resting theta activity grouping during Nogo trials: (a) false alarm rate in compatible versus incompatible trials for the low resting theta power group (blue) and the high resting theta power group (red). (b–d) Time‐frequency decomposition plots of total theta power (b), evoked theta power (c) and PLF (d) for highbaseline and lowbaseline group in compatible and incompatible conditions. Plots are shown for correct rejected responses during Nogo trials at electrode Cz with the corresponding scalp topographies. The x‐axis denotes time in seconds (s) relative to stimulus onset, the y‐axis displays frequency in Hz. Power is indicated by color. The interaction between compatibility and group is shown, additionally. (e) Beamforming analysis revealed significant activation differences of total theta power between Nogo and Go trials (overall sample) in the superior frontal gyrus, the supplementary motor area and the medial frontal gyrus (left). For the lowbaseline group, significant activation differences of total theta power between incompatible and compatible Nogo trials were found in the superior parietal cortex (BA7) and the angular gyrus (BA39/40; right) [Color figure can be viewed at http://wileyonlinelibrary.com]
For the false alarm rate as the most important behavioral parameter in Go/Nogo tasks, the mixed effects ANOVA revealed a significant main effect of compatibility (F[1,64] = 9.99, p = .002, ηp 2 = .14). In the incompatible condition, the false alarm rate was higher (0.22 ± .03) than in the compatible condition (0.19 ± .03). Subsequently, we examined the hypothesis that the increase of the false alarm rate from nonconflicting to conflicting Nogo trials is higher in the lowbaseline group compared to the highbaseline group. We found a significant interaction effect compatibility × group (F[1,64] = 5.05, p = .028, ηp 2 = .07) shown in Figure 2a. Detailed analyses showed that the lowbaseline group committed significantly more false alarms in the incompatible condition (0.25 ± 0.03) than in the compatible condition (0.20 ± 0.03, t[32] = 3.60, p = .002, d = −0.30). In the highbaseline group, no differences regarding the false alarm rate were found between compatible and incompatible trials (t[32] = −0.69, p = .988, d = −0.05). As outlined in the introduction (see Section 2.4), there were N = 72 Nogo trials in the experiment. Given the rate of false alarms, there are thus N ~13–16 erroneous Nogo trials. Since this is a too low trial number for a reliable EEG data quantification, we did not further analyze these trials in the neurophysiological data analysis.
Analyzing the reaction times (RT) on Go trials, the ANOVA only revealed a main effect of compatibility (F[1,64] = 81.66, p < .001, ηp 2 = .56), with RTs being longer in incompatible (350 ms ± 6) than in compatible trials (336 ms ± 6). The accuracy on Go trials did not reveal any significant effect (all F < .7, all p > .4). This lack of effects was examined in more detail by means of Bayesian analysis using the method of Masson (2011). With this method, the probability of the null hypothesis being true given the obtained data p(H0/D), as well as the probability of the alternative hypothesis being true given the obtained data p(H1/D) can be calculated. For the interaction effects compatibility × group, Bayes statistic revealed p(H0/D) = 0.86 and p(H1/D) = 0.14. According to Raftery (1995), probability values higher than 0.5 for p(H0/D) indicate that the null hypothesis is more likely to be true than the alternative hypothesis. Therefore, the results of the Bayesian analysis provide strong evidence for the null hypothesis.
3.1.2. Neurophysiological data
To test the hypothesis that conflict‐modulated changes of theta band activity in Nogo trials are stronger in the lowbaseline group, compared to the highbaseline group, we analyzed total theta power, evoked theta power and PLF.
Total theta power
Below, analyses of total theta power, which consists of phase‐locked and nonphase‐locked aspects of theta power, are presented. For the total theta power, a significant main effect for the factor Go/Nogo was found (F[1,64] = 50.40, p < .001, ηp 2 = .44) with a lower total theta power in Go trials (62.18 μV/m2 ± 12.52) than in Nogo trials (157.54 μV/m2 ± 27.69). The beamforming analysis revealed that these differences in total theta power between Go and Nogo trials were associated with regions in the superior frontal gyrus and the supplementary motor area (SMA; see Figure 2e). Importantly, the interaction Go/Nogo × compatibility × group also yielded a significant effect (F[1,64] = 4.63, p = .035, ηp 2 = .07; see Figure 2b). For further analysis, the ANOVA was performed separately for each group revealing a significant interaction effect Go/Nogo × compatibility for the lowbaseline group (F[1,32] = 6.33, p = .017, ηp 2 = .17), but not for the highbaseline group (F[1,32] = 0.29, p = .596, ηp 2 = .01). For the lowbaseline group, post‐hoc tests showed the following: During Go trials, participants in the lowbaseline group showed higher total theta power in compatible (69.80 μV/m2 ± 17.57) than in incompatible trials (48.10 μV/m2 ± 9.84, t[32] = 2.42, p = .042, d = 0.27). During Nogo trials, the total theta power was higher in incompatible (154.15 μV/m2 ± 25.53) than in compatible trials (122.66 μV/m2 ± 20.64, t[32] = −2.03, p = .05 d = −0.24), which is a result of particular relevance for our hypothesis. All other main effects and interactions yielded no significant effects (all F < .8, all p > .3). Contrasting theta activity in compatible and incompatible Nogo trials in the beamforming analysis revealed that parietal areas encompassing the superior parietal cortex (BA7) and the angular gyrus (BA40) were associated with differences in theta band activity (see Figure 2e).
Evoked theta power
Regarding the evoked (i.e., phase‐locked) theta power (see Figure 2C), the ANOVA revealed a significant main effect for the factor Go/Nogo (F[1,64] = 39.69, p < .001, ηp 2 = .38). Consistent with results of total theta power, the evoked theta power was generally significantly lower in Go trials (59.48 μV/m2 ± 13.20) than in Nogo trials (150.35 μV/m2 ± 30.13). Moreover, the interaction Go/Nogo × compatibility × group (F[1,64] = 3.91, p = .05, ηp 2 = .06) was significant. As with the total theta power, an interaction Go/Nogo × compatibility was evident in the lowbaseline group (F[1,32] = 8.66, p = .006, ηp 2 = .21), but not in the highbaseline group (F[1,64] = 0.001, p = .974, ηp 2 < .001). However, post‐hoc tests revealed that this interaction within the lowbaseline group was driven by differences in Go trials (t[32] = 3.17, p = .006, d = 0.30) and can therefore not explain the behavioral effects. No further main effects or interactions yielded significant effects (all F < .5, all p > .5).
Phase‐locking factor
The PLF is a measure of event‐related phase consistency. When analyzing the PLF of theta oscillations (refer Figure 2d), a significant main effect of the factor Go/Nogo was revealed (F[1,64] = 89.08, p < 001, ηp 2 = .58), with a higher PLF in Nogo trials (0.25 μV/m2 ± .02) than in Go trials (0.16 μV/m2 ± .02). Furthermore, we found a significant main effect of compatibility (F[1,64] = 4.14, p = .046, ηp 2 = .06). In the compatible condition (0.22 μV/m2 ± .02), phase consistency was higher than in the incompatible condition (0.20 μV/m2 ± .01). The interaction of Go/Nogo × compatibility × group did not yield a significant effect (F[1,64] = 1.77, p = .189, ηp 2 = .03). For the interaction effect Go/Nogo × compatibility × group, Bayes statistic revealed p(H0/D) = 0.77 and p(H1/D) = 0.23, thus providing positive evidence for the null hypothesis.
3.2. Modulation grouping; median split (ii)
3.2.1. Behavioral data
For false alarm rates in Nogo trials, the mixed effects ANOVA showed a significant main effect of compatibility (F[1,64] = 9.40, p = .003, ηp 2 = .13) with more false alarms in the incompatible (0.22 ± .03) than in the compatible condition (0.19 ± .03). To test the hypothesis that the increase of the false alarm rate from nonconflicting to conflicting Nogo trials is higher in the lowmodulation group compared to the highmodulation group, an ANOVA was conducted. The interaction between compatibility and group was not significant (F[1,64] = 0.99, p = .324, ηp 2 = .02; refer Figure 3a). Bayesian analysis showed positive evidence for the null hypothesis with p(H0/D) = 0.82 and p(H1/D) = 0.18. Furthermore, no modulations by group were evident for the RT data and accuracy on Go trials (all F < .1, all p > .4); the Bayes statistic revealed p(H0/D) = 0.89 and p(H1/D) = 0.11.
Figure 3.
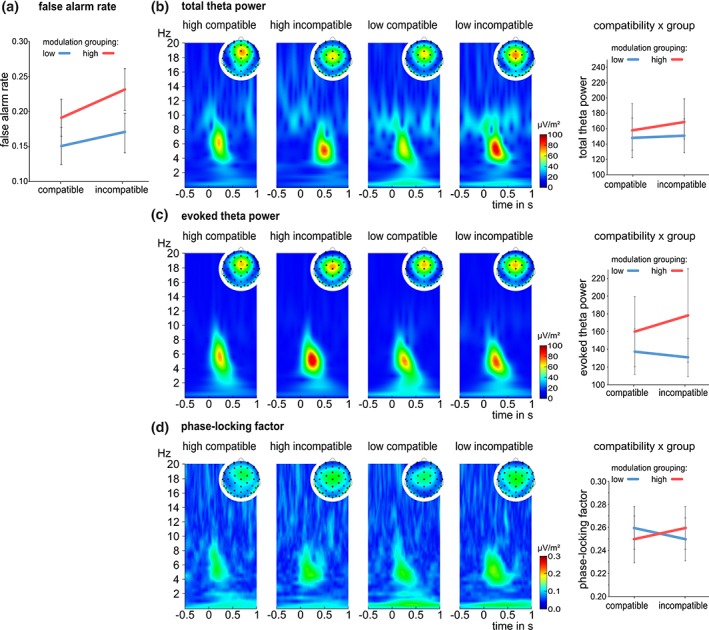
Behavioral and neurophysiological data of the modulation grouping during Nogo trials: (a) false alarm rate in compatible vs. incompatible trials for the low modulation group (blue) and the high modulation group (red). (b–d) time‐frequency decomposition plots of total theta power (b), evoked theta power (c) and PLF (d) for highmodulation and lowmodulation group in compatible and incompatible conditions. Plots are shown for correct rejected responses during Nogo trials at electrode Cz with the corresponding topographies. The x‐axis denotes time in seconds (s) relative to stimulus onset, the y‐axis displays frequency in hertz (Hz). Power is indicated by color. The interaction between compatibility and group is shown, additionally [Color figure can be viewed at http://wileyonlinelibrary.com]
3.2.2. Neurophysiological data
We analyzed total theta power, evoked theta power and PLF to test the hypothesis that conflict‐modulated changes of theta band activity in Nogo trials are stronger in the lowmodulation group, compared to the highmodulation group.
The neurophysiological data of the modulation group is shown in Figure 3b‐d.
Only interactive effects with the factor group are reported since main effects of Go/Nogo and compatibility are necessarily the same as reported above. For the total theta power, the interaction Go/Nogo × compatibility × group yielded no significant effect (F[1,64] = 0.72, p = .398, ηp 2 = .01). The Bayesian analysis of this interaction revealed p(H0/D) = 0.85 and p(H1/D) = 0.15, indicating positive evidence for the null hypothesis. Regarding evoked theta power, the interaction Go/Nogo × compatibility × group was also not significant (F[1,64] = 2.61, p = .111, ηp 2 = .04) and results of Bayesian analysis provided evidence for the null hypothesis (p(H0/D) = 0.69, p(H1/D) = 0.31). Furthermore, the interaction Go/Nogo × compatibility × group was not significant considering the PLF (F[1,64] = 0.68, p = .415, ηp 2 = .01). Again, the lack of effect was supported by Bayesian statistics (p(H0/D) = 0.85, p(H1/D) = 0.15).
4. DISCUSSION
In the present study, we examined the relevance of resting theta band activity and of the ability to upregulate this theta band activity for inhibitory control processes using a modified Go/Nogo task. In this task, we manipulated the difficulty to inhibit a response by varying the conflict level of concurrent auditory information. A sample of N = 66 subjects was split into two groups (a) according to the level of resting theta band activity (highbaseline vs. lowbaseline) and (b) according to their ability to upregulate theta band activity beyond this resting level (highmodulation vs. lowmodulation). The data analysis shows that both groupings were unrelated, suggesting that the examined theta‐related aspects are independent of each other.
4.1. Resting theta activity grouping
The highbaseline group did not show differences in the rate of false alarms between Nogo trials with and without perceptual conflicts. However, the lowbaseline group showed reduced performance (i.e., more false alarms) in Nogo trials with a perceptual conflict compared to trials without such a conflict. Thus, the behavioral data alone already suggest that the level of baseline theta band activity is closely related to response inhibition performance. This is particularly the case when inhibitory control is complicated further by additional conflicting perceptual information. The data establish a link between resting theta band activity and cognitive control processes, which are necessary to accomplish inhibitory control.
Notably, the neurophysiological data suggest that there are direct links between the level of resting theta band activity and Nogo‐related theta band activity. Theta band activity was generally lower in Go compared to Nogo trials, which is in line with previous findings (Chmielewski, Mückschel, et al., 2016; Dippel et al., 2016, 2017; Huster et al., 2013; Liu et al., 2014; Müller et al., 2017; Vahid et al., 2018). Corroborating previous research underlining the importance of superior frontal regions for inhibitory control (Bari & Robbins, 2013; Dippel et al., 2016; Hung et al., 2018; Mückschel, Dippel, & Beste, 2017; Obeso et al., 2017; Xu et al., 2017), the beamforming analysis, contrasting Go and Nogo trials, revealed activation differences in the superior frontal gyrus encompassing the supplemental motor area. Most interestingly, however, the lowbaseline group was characterized by stronger total theta power in the incompatible Nogo condition in comparison with the compatible Nogo condition. In the highbaseline group, no such differences between compatible and incompatible Nogo trials were observed. Processes related to the conflict monitoring modulate theta activity (Cohen & Donner, 2013; Lavallee et al., 2014; Tang et al., 2013; Wang et al., 2014). Moreover, inhibitory control relates to the detection of a response conflict (Klein, Petitjean, Olivier, & Duque, 2014; Stürmer, Siggelkow, Dengler, & Leuthold, 2000; Tandonnet, Garry, & Summers, 2011; Taylor, Nobre, & Rushworth, 2007; Verleger, Kuniecki, Möller, Fritzmannova, & Siebner, 2009). Importantly, however, the current data show that the strength of resting theta band power plays a decisive role in the modulation of cognitive control‐related total theta band activity, especially during conflict‐modulated response inhibition. The beamforming analysis revealed that parietal regions encompassing the superior parietal cortex (BA7), the angular gyrus (BA 39), as well as parts of inferior parietal areas (BA40) are associated with these effects. Previous data has already suggested that BA7 and BA39 are involved in inhibitory control when these processes are modulated by perceptual conflicts (Bodmer & Beste, 2017). Parietal areas seem to be involved in cognitive control whenever sensory information is complex or conflicting yet essential for behavioral control (Adelhöfer et al., 2018; Fokin et al., 2008; Ocklenburg et al., 2011; Takeichi et al., 2010). This notion fits in well with findings showing that BA40 and BA7 bridge perception and action (Gottlieb, 2007) and that elevated demands on conflict monitoring involve the superior and inferior parietal cortices (Gothelf et al., 2007). It has also been shown for response inhibition processes modulated by perceptual conflicts (Chmielewski & Beste, 2016). Theta activity likely reflects the coding of an “alarm/surprise signal” (Cavanagh & Frank, 2014) leading to task‐specific adjustments during response inhibition (Dippel et al., 2017; Wessel, 2018). Parietal areas have also been shown to be involved in such surprise signal processing (O'Reilly et al., 2013). The current data suggest that the emergence of signals used during conflict‐modulated response inhibition depends on the strength of the subject‐specific resting theta activity. Only in individuals with a comparatively low level of resting theta activity we observed an increase of theta‐associated processes when it was necessary to encode an alarm/surprise signal during conflict‐modulated response inhibition. The fact that the highbaseline group showed better behavioral performance and no conflict‐related deterioration in behavior suggests that high resting theta activity makes conflict‐ and alarm‐signal‐related increases in theta‐band power unnecessary. It appears that a high resting theta level is associated with processing advantages during response inhibition. In individuals with low resting theta activity (i.e., lowbaseline group), these theta‐associated processes (i.e., increases in theta activity) are only triggered when cognitive control requirements are increased. However, we assume that this is a time‐consuming process, and it is possible that theta‐related cognitive control processes are not volatile enough if they are needed during conflicting Nogo trials in the lowbaseline group. This would also explain the inhibitory control deficits in that group during conflicting Nogo trials. The finding that resting theta activity impacts theta activity during response inhibition underlines that there are similarities between resting dynamics and task‐related activity. While this is increasingly recognized in the literature (Becker et al., 2018; Haag et al., 2015; Mahjoory et al., 2019; Tavor et al., 2016), the current study is the first to show this for the theta band oscillations in the context of inhibitory control. Notably, the data analysis of the PLF in Nogo trials revealed no differential effects between the highbaseline group and the lowbaseline group, which was confirmed by Bayesian statistics. Thus, it is specifically the total power of theta‐related processes during conflict‐modulated response inhibition that is relevant to consider for similarities between resting dynamics and task‐related activity during conflict‐modulated inhibitory control. This finding bears theoretical importance in the light of evidence suggesting that heterogeneous computations manifest in theta oscillations (Cohen, 2014a) and that conflict‐related theta consists of only nonphase‐locked oscillations (Cohen, 2014a; Cohen & Donner, 2013). It is possible that nonphase‐locked power of the resting theta band activity is the basis of the observed effect and leads to the fact that a resting state dynamic can have an influence on the task‐related activity.
4.2. Modulation grouping
The analysis of the behavioral and neurophysiological data with respect to the ability to modulate/upregulate theta activity revealed a dissociation from the effects obtained on the basis of the resting theta activity grouping; that is, no differential effects were observed between the two modulation groups. The lack of effects was supported by Bayesian data analysis, which provided substantial evidence for the null hypothesis. As outlined above (see Section 4.1), it is likely that total theta band activity plays a major role in the encoding of an alarm/surprise signal during conflict‐modulated response inhibition. Since a neurofeedback‐like approach was used to investigate whether the ability to modulate theta band activity impacts conflict‐modulated response inhibition, the lack of effects observed with this approach may have implications for the usefulness of cognitive enhancement procedures in nonclinical populations. The data suggest that neurofeedback approaches training the subject's ability to self‐induce modulations of an EEG parameter beyond a (resting) baseline level (Bluschke et al., 2016; Enriquez‐Geppert et al., 2013; Enriquez‐Geppert et al., 2017; Enriquez‐Geppert, Huster, Scharfenort, et al., 2014; Sitaram et al., 2017) may possibly not be suitable to enhance processes needed for conflict and inhibitory control. One possible explanation may be that these approaches might not be sufficient to modulate nonphase‐locked (total) theta frequency activity, for which the current data shows the strongest group effects. Our methodological approach was very specific, however, as we assessed the ability to spontaneously modulate theta activity beyond a baseline level during 1 min without implementing any strategies on how to do so. Thus, it has to be taken into consideration that different methodological approaches and the modification of some parameters like time‐interval or spontaneity might lead to different results. Future research should clarify these aspects. Interestingly, it has been shown that an entire neurofeedback training in healthy individuals did not modulate conflict monitoring or inhibitory control processes when examined using a Stroop or Stop‐signal task (Enriquez‐Geppert, Huster, Figge, & Herrmann, 2014). Hence, if upcoming research supports the current data neurofeedback protocols may require some refinement when using these approaches to modulate conflict or inhibitory control related mechanisms in healthy populations as a “cognitive enhancement” strategy.
4.3. Conclusions
In the current study, we examined the relevance of resting theta band activity and its modulation for inhibitory control processes that are also closely linked to oscillations in the theta frequency band. We showed that the strength of resting state theta activity modulates the effects of conflicts during motor inhibitory control. Especially when resting theta activity was low, conflicts strongly affected response inhibition performance and total theta band activity during Nogo trials. These effects were associated with theta‐related activity differences in the superior (BA7) and inferior parietal cortex (BA40). These results were specific for total theta band activity; evoked theta activity and measures of intertrial phase coherency (PLF) were not affected. The data implies that resting state theta activity modulates the processing of a theta‐related alarm or surprise signal during inhibitory control. The ability to voluntarily modulate theta band activity does not affect conflict‐modulated inhibitory control. These findings provide important implications for cognitive enhancement approaches, including neurofeedback, aimed at optimizing human cognitive control.
DATA AVAILABILITY STATEMENT
The data that support the findings of this study are available from the corresponding author upon reasonable request.
Supporting information
Appendix S1: Supplementary Information
ACKNOWLEDGMENT
This work was partly supported by a grant from the Deutsche Forschungsgemeinschaft (DFG) SFB940 project B8.
Pscherer C, Mückschel M, Summerer L, Bluschke A, Beste C. On the relevance of EEG resting theta activity for the neurophysiological dynamics underlying motor inhibitory control. Hum Brain Mapp. 2019;40:4253–4265. 10.1002/hbm.24699
Data Availability Statement: The data that support the findings of this study are available from the corresponding author upon reasonable request.
Funding information Deutsche Forschungsgemeinschaft, Grant/Award Number: SFB940
REFERENCES
- Adelhöfer, N. , Gohil, K. , Passow, S. , Teufert, B. , Roessner, V. , Li, S.‐C. , & Beste, C. (2018). The system‐neurophysiological basis for how methylphenidate modulates perceptual‐attentional conflicts during auditory processing. Human Brain Mapping, 39, 5050–5061. [DOI] [PMC free article] [PubMed] [Google Scholar]
- Alkoby, O. , Abu‐Rmileh, A. , Shriki, O. , & Todder, D. (2018). Can we predict who will respond to Neurofeedback? A review of the inefficacy problem and existing predictors for successful EEG Neurofeedback learning. Neuroscience, 378, 155–164. [DOI] [PubMed] [Google Scholar]
- Aron, A. R. , Robbins, T. W. , & Poldrack, R. A. (2014). Inhibition and the right inferior frontal cortex: One decade on. Trends in Cognitive Sciences, 18, 177–185. [DOI] [PubMed] [Google Scholar]
- Bard, I. , Gaskell, G. , Allansdottir, A. , da Cunha, R. V. , Eduard, P. , Hampel, J. , … Zwart, H. (2018). Bottom up ethics ‐ Neuroenhancement in education and employment. Neuroethics, 11, 309–322. [DOI] [PMC free article] [PubMed] [Google Scholar]
- Bari, A. , & Robbins, T. W. (2013). Inhibition and impulsivity: Behavioral and neural basis of response control. Progress in Neurobiology, 108, 44–79. [DOI] [PubMed] [Google Scholar]
- Bauer, M. , Oostenveld, R. , Peeters, M. , & Fries, P. (2006). Tactile spatial attention enhances gamma‐band activity in somatosensory cortex and reduces low‐frequency activity in Parieto‐occipital areas. The Journal of Neuroscience, 26, 490–501. [DOI] [PMC free article] [PubMed] [Google Scholar]
- Becker, R. , Van de Ville, D. , & Kleinschmidt, A. (2018). Alpha oscillations reduce temporal long‐range dependence in spontaneous human brain activity. The Journal of Neuroscience, 38, 755–764. [DOI] [PMC free article] [PubMed] [Google Scholar]
- Bluschke, A. , Roessner, V. , & Beste, C. (2016). Editorial perspective: How to optimise frequency band neurofeedback for ADHD. Journal of Child Psychology and Psychiatry, 57, 457–461. [DOI] [PubMed] [Google Scholar]
- Bodmer, B. , & Beste, C. (2017). On the dependence of response inhibition processes on sensory modality. Human Brain Mapping, 38, 1941–1951. [DOI] [PMC free article] [PubMed] [Google Scholar]
- Cavanagh, J. F. , & Frank, M. J. (2014). Frontal theta as a mechanism for cognitive control. Trends in Cognitive Sciences, 18, 414–421. [DOI] [PMC free article] [PubMed] [Google Scholar]
- Chmielewski, W. X. , & Beste, C. (2016). Perceptual conflict during sensorimotor integration processes ‐ a neurophysiological study in response inhibition. Scientific Reports, 6, 26289. [DOI] [PMC free article] [PubMed] [Google Scholar]
- Chmielewski, W. X. , Mückschel, M. , Dippel, G. , & Beste, C. (2016). Concurrent information affects response inhibition processes via the modulation of theta oscillations in cognitive control networks. Brain Structure & Function, 221, 3949–3961. [DOI] [PubMed] [Google Scholar]
- Chmielewski, W. X. , Wolff, N. , Mückschel, M. , Roessner, V. , & Beste, C. (2016). Effects of multisensory integration processes on response inhibition in adolescent autism spectrum disorder. Psychological Medicine, 46, 2705–2716. [DOI] [PubMed] [Google Scholar]
- Cohen, M. X. (2014a). A neural microcircuit for cognitive conflict detection and signaling. Trends in Neurosciences, 37, 480–490. [DOI] [PubMed] [Google Scholar]
- Cohen, M. X. (2014b). Analyzing neural time series data: Theory and practice. MIT Press. [Google Scholar]
- Cohen, M. X. , & Donner, T. H. (2013). Midfrontal conflict‐related theta‐band power reflects neural oscillations that predict behavior. Journal of Neurophysiology, 110, 2752–2763. [DOI] [PubMed] [Google Scholar]
- De Blasio, F. M. , & Barry, R. J. (2013). Prestimulus delta and theta determinants of ERP responses in the go/NoGo task. International Journal of Psychophysiology, 87, 279–288. [DOI] [PubMed] [Google Scholar]
- Diamond, A. (2013). Executive functions. Annual Review of Psychology, 64, 135–168. [DOI] [PMC free article] [PubMed] [Google Scholar]
- Dippel, G. , Chmielewski, W. , Mückschel, M. , & Beste, C. (2016). Response mode‐dependent differences in neurofunctional networks during response inhibition: An EEG‐beamforming study. Brain Structure & Function, 221, 4091–4101. [DOI] [PubMed] [Google Scholar]
- Dippel, G. , Mückschel, M. , Ziemssen, T. , & Beste, C. (2017). Demands on response inhibition processes determine modulations of theta band activity in superior frontal areas and correlations with pupillometry––Implications for the norepinephrine system during inhibitory control. NeuroImage, 157, 575–585. [DOI] [PubMed] [Google Scholar]
- Dockree, P. M. , Bellgrove, M. A. , O'Keeffe, F. M. , Moloney, P. , Aimola, L. , Carton, S. , & Robertson, I. H. (2006). Sustained attention in traumatic brain injury (TBI) and healthy controls: Enhanced sensitivity with dual‐task load. Experimental Brain Research, 168, 218–229. [DOI] [PubMed] [Google Scholar]
- Dockree, P. M. , Kelly, S. P. , Roche, R. A. P. , Hogan, M. J. , Reilly, R. B. , & Robertson, I. H. (2004). Behavioural and physiological impairments of sustained attention after traumatic brain injury. Brain Research. Cognitive Brain Research, 20, 403–414. [DOI] [PubMed] [Google Scholar]
- Enriquez‐Geppert, S. , Huster, R. J. , Figge, C. , & Herrmann, C. S. (2014). Self‐regulation of frontal‐midline theta facilitates memory updating and mental set shifting. Frontiers in Behavioral Neuroscience, 8, 420. [DOI] [PMC free article] [PubMed] [Google Scholar]
- Enriquez‐Geppert, S. , Huster, R. J. , & Herrmann, C. S. (2013). Boosting brain functions: Improving executive functions with behavioral training, neurostimulation, and neurofeedback. International Journal of Psychophysiology, 88, 1–16. [DOI] [PubMed] [Google Scholar]
- Enriquez‐Geppert, S. , Huster, R. J. , & Herrmann, C. S. (2017). EEG‐Neurofeedback as a tool to modulate cognition and behavior: A review tutorial. Frontiers in Human Neuroscience, 11, 51. [DOI] [PMC free article] [PubMed] [Google Scholar]
- Enriquez‐Geppert, S. , Huster, R. J. , Scharfenort, R. , Mokom, Z. N. , Zimmermann, J. , & Herrmann, C. S. (2014). Modulation of frontal‐midline theta by neurofeedback. Biological Psychology, 95, 59–69. [DOI] [PubMed] [Google Scholar]
- Faul, F. , Erdfelder, E. , Lang, A.‐G. , & Buchner, A. (2007). G*power 3: A flexible statistical power analysis program for the social, behavioral, and biomedical sciences. Behavior Research Methods, 39, 175–191. [DOI] [PubMed] [Google Scholar]
- Fokin, V. A. , Shelepin, Y. E. , Kharauzov, A. K. , Trufanov, G. E. , Sevost'yanov, A. V. , Pronin, S. V. , & Koskin, S. A. (2008). Localization of human cortical areas activated on perception of ordered and chaotic images. Neuroscience and Behavioral Physiology, 38, 677–685. [DOI] [PubMed] [Google Scholar]
- Gevensleben, H. , Holl, B. , Albrecht, B. , Schlamp, D. , Kratz, O. , Studer, P. , … Heinrich, H. (2009). Distinct EEG effects related to neurofeedback training in children with ADHD: A randomized controlled trial. International Journal of Psychophysiology, 74, 149–157. [DOI] [PubMed] [Google Scholar]
- Gothelf, D. , Hoeft, F. , Hinard, C. , Hallmayer, J. F. , Stoecker, J. V. D. , Antonarakis, S. E. , … Reiss, A. L. (2007). Abnormal cortical activation during response inhibition in 22q11.2 deletion syndrome. Human Brain Mapping, 28, 533–542. [DOI] [PMC free article] [PubMed] [Google Scholar]
- Gottlieb, J. (2007). From thought to action: The parietal cortex as a bridge between perception, action, and cognition. Neuron, 53, 9–16. [DOI] [PubMed] [Google Scholar]
- Gross, J. , Kujala, J. , Hämäläinen, M. , Timmermann, L. , Schnitzler, A. , & Salmelin, R. (2001). Dynamic imaging of coherent sources: Studying neural interactions in the human brain. Proceedings of the National Academy of Sciences of the United States of America, 98, 694–699. [DOI] [PMC free article] [PubMed] [Google Scholar]
- Haag, L. , Quetscher, C. , Dharmadhikari, S. , Dydak, U. , Schmidt‐Wilcke, T. , & Beste, C. (2015). Interrelation of resting state functional connectivity, striatal GABA levels, and cognitive control processes. Human Brain Mapping, 36, 4383–4393. [DOI] [PMC free article] [PubMed] [Google Scholar]
- Harper, J. , Malone, S. M. , & Bernat, E. M. (2014). Theta and delta band activity explain N2 and P3 ERP component activity in a go/no‐go task. Clinical Neurophysiology, 125, 124–132. [DOI] [PMC free article] [PubMed] [Google Scholar]
- Hoogenboom, N. , Schoffelen, J.‐M. , Oostenveld, R. , Parkes, L. M. , & Fries, P. (2006). Localizing human visual gamma‐band activity in frequency, time and space. NeuroImage, 29, 764–773. [DOI] [PubMed] [Google Scholar]
- Hung, Y. , Gaillard, S. L. , Yarmak, P. , & Arsalidou, M. (2018). Dissociations of cognitive inhibition, response inhibition, and emotional interference: Voxelwise ALE meta‐analyses of fMRI studies. Human Brain Mapping, 39, 4065–4082. [DOI] [PMC free article] [PubMed] [Google Scholar]
- Huster, R. J. , Enriquez‐Geppert, S. , Lavallee, C. F. , Falkenstein, M. , & Herrmann, C. S. (2013). Electroencephalography of response inhibition tasks: Functional networks and cognitive contributions. International Journal of Psychophysiology, 87, 217–233. [DOI] [PubMed] [Google Scholar]
- Inzlicht, M. , & Tullett, A. M. (2010). Reflecting on god: Religious primes can reduce neurophysiological response to errors. Psychological Science, 21, 1184–1190. [DOI] [PubMed] [Google Scholar]
- Kayser, J. , & Tenke, C. E. (2015). On the benefits of using surface Laplacian (current source density) methodology in electrophysiology. International Journal of Psychophysiology, 97, 171–173. [DOI] [PMC free article] [PubMed] [Google Scholar]
- Klein, P.‐A. , Petitjean, C. , Olivier, E. , & Duque, J. (2014). Top‐down suppression of incompatible motor activations during response selection under conflict. NeuroImage, 86, 138–149. [DOI] [PubMed] [Google Scholar]
- Lansbergen, M. M. , Schutter, D. J. L. G. , & Kenemans, J. L. (2007). Subjective impulsivity and baseline EEG in relation to stopping performance. Brain Research, 1148, 161–169. [DOI] [PubMed] [Google Scholar]
- Lavallee, C. F. , Herrmann, C. S. , Weerda, R. , & Huster, R. J. (2014). Stimulus‐response mappings shape inhibition processes: A combined EEG‐fMRI study of contextual stopping. PLoS One, 9, e96159. [DOI] [PMC free article] [PubMed] [Google Scholar]
- Liu, Z.‐X. , Woltering, S. , & Lewis, M. D. (2014). Developmental change in EEG theta activity in the medial prefrontal cortex during response control. NeuroImage, 2, 873–887. [DOI] [PubMed] [Google Scholar]
- Mahjoory, K. , Cesnaite, E. , Hohlefeld, F. U. , Villringer, A. , & Nikulin, V. V. (2019). Power and temporal dynamics of alpha oscillations at rest differentiate cognitive performance involving sustained and phasic cognitive control. NeuroImage, 188, 135–144. [DOI] [PubMed] [Google Scholar]
- Masson, M. E. J. (2011). A tutorial on a practical Bayesian alternative to null‐hypothesis significance testing. Behavior Research Methods, 43, 679–690. [DOI] [PubMed] [Google Scholar]
- Moore, R. A. , Mills, M. , Marshman, P. , & Corr, P. J. (2012). Behavioural inhibition system (BIS) sensitivity differentiates EEG theta responses during goal conflict in a continuous monitoring task. International Journal of Psychophysiology, 85, 135–144. [DOI] [PubMed] [Google Scholar]
- Mückschel, M. , Dippel, G. , & Beste, C. (2017). Distinguishing stimulus and response codes in theta oscillations in prefrontal areas during inhibitory control of automated responses. Human Brain Mapping, 38, 5681–5690. [DOI] [PMC free article] [PubMed] [Google Scholar]
- Mückschel, M. , Stock, A.‐K. , Dippel, G. , Chmielewski, W. , & Beste, C. (2016). Interacting sources of interference during sensorimotor integration processes. NeuroImage, 125, 342–349. [DOI] [PubMed] [Google Scholar]
- Müller, V. , Anokhin, A. P. , & Lindenberger, U. (2017). Genetic influences on phase synchrony of brain oscillations supporting response inhibition. International Journal of Psychophysiology, 115, 125–132. [DOI] [PMC free article] [PubMed] [Google Scholar]
- Nakao, T. , Bai, Y. , Nashiwa, H. , & Northoff, G. (2013). Resting‐state EEG power predicts conflict‐related brain activity in internally guided but not in externally guided decision‐making. NeuroImage, 66, 9–21. [DOI] [PubMed] [Google Scholar]
- Nunez, P. L. , & Pilgreen, K. L. (1991). The spline‐Laplacian in clinical neurophysiology: A method to improve EEG spatial resolution. Journal of Clinical Neurophysiology, 8, 397–413. [PubMed] [Google Scholar]
- Obeso, I. , Wilkinson, L. , Teo, J. T. , Talelli, P. , Rothwell, J. C. , & Jahanshahi, M. (2017). Theta burst magnetic stimulation over the pre‐supplementary motor area improves motor inhibition. Brain Stimulat, 10, 944–951. [DOI] [PubMed] [Google Scholar]
- Ocklenburg, S. , Güntürkün, O. , & Beste, C. (2011). Lateralized neural mechanisms underlying the modulation of response inhibition processes. NeuroImage, 55, 1771–1778. [DOI] [PubMed] [Google Scholar]
- Oostenveld, R. , Fries, P. , Maris, E. , & Schoffelen, J.‐M. (2011). FieldTrip: Open source software for advanced analysis of MEG, EEG, and invasive electrophysiological data. Computational Intelligence and Neuroscience, 2011, 156869. [DOI] [PMC free article] [PubMed] [Google Scholar]
- Oostenveld, R. , Stegeman, D. F. , Praamstra, P. , & van Oosterom, A. (2003). Brain symmetry and topographic analysis of lateralized event‐related potentials. Clinical Neurophysiology, 114, 1194–1202. [DOI] [PubMed] [Google Scholar]
- O'Reilly, J. X. , Schüffelgen, U. , Cuell, S. F. , Behrens, T. E. J. , Mars, R. B. , & Rushworth, M. F. S. (2013). Dissociable effects of surprise and model update in parietal and anterior cingulate cortex. Proceedings of the National Academy of Sciences of the United States of America, 110, E3660–E3669. [DOI] [PMC free article] [PubMed] [Google Scholar]
- Quetscher, C. , Yildiz, A. , Dharmadhikari, S. , Glaubitz, B. , Schmidt‐Wilcke, T. , Dydak, U. , & Beste, C. (2015). Striatal GABA‐MRS predicts response inhibition performance and its cortical electrophysiological correlates. Brain Structure & Function, 220, 3555–3564. [DOI] [PMC free article] [PubMed] [Google Scholar]
- Raftery, A. E. (1995). Bayesian model selection in social research In Mardsen P. V. (Ed.), Sociological methodology (pp. 11–196). Cambridge: Blackwell. [Google Scholar]
- Reiner, M. , Gruzelier, J. , & Bamidis, P. D. (2017). Cognitive enhancement: A system view. International Journal of Psychophysiology, 122, 1–5. [DOI] [PubMed] [Google Scholar]
- Rigoni, D. , Pourtois, G. , & Brass, M. (2015). “Why should I care?” challenging free will attenuates neural reaction to errors. Social Cognitive and Affective Neuroscience, 10, 262–268. [DOI] [PMC free article] [PubMed] [Google Scholar]
- Rigoni, D. , Wilquin, H. , Brass, M. , & Burle, B. (2013). When errors do not matter: Weakening belief in intentional control impairs cognitive reaction to errors. Cognition, 127, 264–269. [DOI] [PubMed] [Google Scholar]
- Roach, B. J. , & Mathalon, D. H. (2008). Event‐related EEG time‐frequency analysis: An overview of measures and an analysis of early gamma band phase locking in schizophrenia. Schizophrenia Bulletin, 34, 907–926. [DOI] [PMC free article] [PubMed] [Google Scholar]
- Schiller, B. , Gianotti, L. R. R. , Nash, K. , & Knoch, D. (2014). Individual differences in inhibitory control—Relationship between baseline activation in lateral PFC and an electrophysiological index of response inhibition. Cerebral Cortex, 24, 2430–2435. [DOI] [PubMed] [Google Scholar]
- Schmüser, L. , Sebastian, A. , Mobascher, A. , Lieb, K. , Feige, B. , & Tüscher, O. (2016). Data‐driven analysis of simultaneous EEG/fMRI reveals neurophysiological phenotypes of impulse control. Human Brain Mapping, 37, 3114–3136. [DOI] [PMC free article] [PubMed] [Google Scholar]
- Schneider, T. R. , Debener, S. , Oostenveld, R. , & Engel, A. K. (2008). Enhanced EEG gamma‐band activity reflects multisensory semantic matching in visual‐to‐auditory object priming. NeuroImage, 42, 1244–1254. [DOI] [PubMed] [Google Scholar]
- Sitaram, R. , Ros, T. , Stoeckel, L. , Haller, S. , Scharnowski, F. , Lewis‐Peacock, J. , … Sulzer, J. (2017). Closed‐loop brain training: The science of neurofeedback. Nature Reviews. Neuroscience, 18, 86–100. [DOI] [PubMed] [Google Scholar]
- Stürmer, B. , Siggelkow, S. , Dengler, R. , & Leuthold, H. (2000). Response priming in the Simon paradigm. A transcranial magnetic stimulation study. Experimental Brain Research, 135, 353–359. [DOI] [PubMed] [Google Scholar]
- Takeichi, H. , Koyama, S. , Terao, A. , Takeuchi, F. , Toyosawa, Y. , & Murohashi, H. (2010). Comprehension of degraded speech sounds with m‐sequence modulation: An fMRI study. NeuroImage, 49, 2697–2706. [DOI] [PubMed] [Google Scholar]
- Tandonnet, C. , Garry, M. I. , & Summers, J. J. (2011). Selective suppression of the incorrect response implementation in choice behavior assessed by transcranial magnetic stimulation. Psychophysiology, 48, 462–469. [DOI] [PubMed] [Google Scholar]
- Tang, D. , Hu, L. , & Chen, A. (2013). The neural oscillations of conflict adaptation in the human frontal region. Biological Psychology, 93, 364–372. [DOI] [PubMed] [Google Scholar]
- Tavor, I. , Jones, O. P. , Mars, R. B. , Smith, S. M. , Behrens, T. E. , & Jbabdi, S. (2016). Task‐free MRI predicts individual differences in brain activity during task performance. Science, 352, 216–220. [DOI] [PMC free article] [PubMed] [Google Scholar]
- Taylor, P. C. J. , Nobre, A. C. , & Rushworth, M. F. S. (2007). Subsecond changes in top down control exerted by human medial frontal cortex during conflict and action selection: A combined transcranial magnetic stimulation electroencephalography study. Journal of Neuroscience: The Official Journal of the Society for Neuroscience, 27, 11343–11353. [DOI] [PMC free article] [PubMed] [Google Scholar]
- Vahid, A. , Mückschel, M. , Neuhaus, A. , Stock, A.‐K. , & Beste, C. (2018). Machine learning provides novel neurophysiological features that predict performance to inhibit automated responses. Scientific Reports, 8, 16235. [DOI] [PMC free article] [PubMed] [Google Scholar]
- Verleger, R. , Kuniecki, M. , Möller, F. , Fritzmannova, M. , & Siebner, H. R. (2009). On how the motor cortices resolve an inter‐hemispheric response conflict: An event‐related EEG potential‐guided TMS study of the flankers task. The European Journal of Neuroscience, 30, 318–326. [DOI] [PubMed] [Google Scholar]
- Wang, K. , Li, Q. , Zheng, Y. , Wang, H. , & Liu, X. (2014). Temporal and spectral profiles of stimulus‐stimulus and stimulus‐response conflict processing. NeuroImage, 89, 280–288. [DOI] [PubMed] [Google Scholar]
- Wessel, J. R. (2018). Surprise: A more realistic framework for studying action stopping? Trends in Cognitive Sciences, 22, 741–744. [DOI] [PMC free article] [PubMed] [Google Scholar]
- Xu, K. Z. , Anderson, B. A. , Emeric, E. E. , Sali, A. W. , Stuphorn, V. , Yantis, S. , & Courtney, S. M. (2017). Neural basis of cognitive control over movement inhibition: Human fMRI and primate electrophysiology evidence. Neuron, 96, 1447–1458.e6. [DOI] [PMC free article] [PubMed] [Google Scholar]
- Yordanova, J. , & Kolev, V. (1998). Single‐sweep analysis of the theta frequency band during an auditory oddball task. Psychophysiology, 35, 116–126. [PubMed] [Google Scholar]
Associated Data
This section collects any data citations, data availability statements, or supplementary materials included in this article.
Supplementary Materials
Appendix S1: Supplementary Information
Data Availability Statement
The data that support the findings of this study are available from the corresponding author upon reasonable request.