

Abstract
Training‐induced neuroplasticity has been described in athletes' population. However, it remains largely unknown how regular training and sports proficiency modifies neuronal circuits in the human brain. In this study, we used voxel‐based morphometry and stepwise functional connectivity (SFC) analyses to uncover connectivity changes in the functional stream architecture in student‐athletes at early stages of sensorimotor skill training. Thirty‐two second‐year student‐athletes whose major was little‐ball sports and thirty‐four nonathlete controls were recruited for the study. We found that athletes showed greater gray matter volume in the right sensorimotor area, the limbic lobe, and the anterior lobe of the cerebellum. Furthermore, SFC analysis demonstrated that athletes displayed significantly smaller optimal connectivity distance from those seed regions to the dorsal attention network (DAN) and larger optimal connectivity distance to the default mode network (DMN) compared to controls. The Attention Network Test showed that the reaction time of the orienting attention subnetwork was positively correlated with SFC between the seeds and the DAN, while negatively correlated with SFC between the seeds and the DMN. Our findings suggest that neuroplastic adaptations on functional connectivity streams after motor skill training may enable novel information flow from specific areas of the cortex toward distributed networks such as the DAN and the DMN. This could potentially regulate the focus of external and internal attention synchronously in athletes, and consequently accelerate the reaction time of orienting attention in athletes.
Keywords: athlete training, functional magnetic resonance imaging, neuroplasticity, optimal connectivity distance, stepwise functional connectivity
1. INTRODUCTION
The human brain shows neuroplastic adaptations induced by physical exercise and motor skill training. How sensory, motor, and cognitive functions adapt in the process of skill acquisition is still not well understood (Lappi, 2015). Neuroscience research on the brains of athletes allows us to explore the structural and functional plasticity of the brain during motor skill training. Based on structural magnetic resonance imaging (MRI), skilled professionals showed morphological enlargement in distributed regions of the frontal, parietal, subcortical areas, and cerebellum. For example, at the brain structural level, triathlon masters athletes show greater cortical thickness in the medial prefrontal cortex (MPFC), pre and postcentral gyri, and insula (Wood, Nikolov, & Shoemaker, 2016); handball players display increased gray matter volume (GMV) in the somatosensory‐motor area (Hanggi et al., 2015); skilled golfers exhibit larger GMV in premotor and parietal areas (Jancke, Koeneke, Hoppe, Rominger, & Hanggi, 2009); and basketball and badminton players have morphological enlargements in cerebellum compared to controls (Di et al., 2012; Park et al., 2009). Moreover, resting‐state functional connectivity (FC), a method that detects connectivity properties of the brain based on low‐frequency fluctuations of blood oxygen level dependent (BOLD) oscillations, has facilitated the study of brain adaptations in athletes' population. Recently, seed‐based FC studies have found that the parietal cortex exhibits increased connectivity with the anterior cingulate and middle frontal cortices, and decreased connectivity with the inferior and middle frontal cortex in badminton players (Di et al., 2012). Other studies find increased connectivity from the medial frontal cortex to the posterior cingulate cortex (PCC), the fusiform gyrus, and the inferior parietal lobule (IPL) in badminton players compared to controls (Xu et al., 2016). Therefore, convergence evidence from different neuroimaging techniques has shown that regional brain changes occur across heteromodal regions in a wide range of sports modalities.
It has been suggested that sensorimotor information flows undergoes extensive associative elaboration and attentional modulation as it becomes incorporated into the texture of cognition (Mesulam, 1998). This process occurs hierarchically, with information transferring from unimodal to transmodal and multimodal areas (Mesulam, 1998). Recently, a novel graph theory‐based analysis applied to functional MRI data has identified relay stations that bridge unimodal systems to the multimodal integration network for higher order brain systems (Sepulcre, 2014a; Sepulcre, 2014b; Sepulcre, Sabuncu, Yeo, Liu, & Johnson, 2012). This approach, called stepwise functional connectivity (SFC), has the ability to dissect detailed functional streams by describing direct and indirect connections through linked neighbors of a given region of interest (ROI; or seed region) in the human brain (Sepulcre, 2014a; Sepulcre, 2015; Sepulcre et al., 2012). As motor skill training has been suggested to enhanced sensory, motor, and cognitive functions in athletes, we combined voxel‐based morphometry (VBM) (Ashburner & Friston, 2000) and SFC analyses to examine neuroplasticity on functional connectivity streams in student‐athletes who play sports with fast demands of sensorimotor integration such as badminton and table tennis. In fast‐paced racket sports like badminton and table tennis, the players require well‐refined hand–eye coordination and visuospatial ability to achieve improved perception, focus, anticipation, planning, and fast responses (Di et al., 2012; Wolf et al., 2014). We hypothesized that the little‐ball athletes would show changes in brain plasticity in both structural morphology and functional connectivity architecture in brain regions related to the integration of visual attention and visual motor coordination processing. These plastic changes in cerebral connectivity integration would consequently affect their final multimodal attentional performance.
2. MATERIALS AND METHODS
2.1. Participants
We recruited second‐year student‐athletes whose major was little‐ball sports (badminton & table tennis) from Chengdu Sport University. As there are distinct phases of motor training from novices to experts, and we speculate that the brain adaptations would be different in early and advanced stages of motor skill training (Halsband & Lange, 2006; Lappi, 2015), we target student‐athletes trained <2 years. Moreover, they were trained <12 hours per week, meeting the criteria of experienced athletes (whose training intensity is generally <30 hours per week), plus one additional hour of special basic theory per week. They all followed the same training sessions until the third year when they would be divided into badminton or table tennis based both on their willingness to play and the trainers' suggestions. The skill training included special physical preparation as well as technical training in badminton and table tennis. The badminton technical training consisted of service, receiving, forehand clear/lift, spin drop, forehand/backhand drive, and footwork including striding‐step, jumping‐step, crossover, and so forth. The table tennis technical training included service, receiving, forehand and backhand counter spin/stroke/chop/attack, backhand block and forehand attack, and footwork including level‐step, striding‐step, and jumping‐step. Thirty‐four nonathlete controls were also recruited. All subjects were right‐handed as tested by the Chinese version of Edinburgh‐Handedness Questionnaire (coefficients >50) (Oldfield, 1971), and had no history of neurological or psychiatric diseases or concussions. This study protocol was approved by the research ethical committee of School of Life Science and Technology, University of Electronic Science and Technology of China and was carried out in accordance with the approved guidelines. The informed written consents were obtained from all participants. Demographic data of the recruited subjects are shown in Table 1.
Table 1.
Demographics of the subjects
| Age (year) | Number (male/female) | Education (year) | Years of training (year) | Intensity of training (h/day) | |
|---|---|---|---|---|---|
| Athletes | 19.9 ± 0.7 | 29(17/12)b | 14.2 ± 0.3 | 1.4 ± 0.5 | 3.4 ± 0.5 |
| Controls | 20.2 ± 1.1 | 29(17/12)b | 14.8 ± 0.7 | NA | NA |
| p value | 0.26a | / | 0.37a | / | / |
Note. Data are presented as mean ± SD. NA = not applicable.
The p value was obtained by two‐sample t test.
The data of three athletes and five controls excluded because of head motion.
2.2. Data acquisition
All MRI scans were acquired on a 3.0 T GE Signa MR750 system (GE Healthcare, Milwaukee) with an 8‐channel phased array head coil. High‐resolution 3D T1‐weighted anatomical images were obtained in axial orientation using a 3D spoiled gradient‐recalled (SPGR) sequence. The acquisition parameters were as follows: TR = 5.97 ms, TE = 1.96 ms, field of view (FOV) = 240 × 240 mm2, flip angle = 12°, matrix size = 512 × 512, 156 slices, and voxel size = 1 × 1 × 1 mm3. Resting‐state fMRI images were acquired using a gradient‐recalled echo planar imaging (EPI) sequence. The parameters were as follows: TR = 2,000 ms, TE = 30 ms, FOV = 220 × 220 mm2, flip angle = 90°, matrix size = 64 × 64, 43 transverse slices without slice gap, voxel size = 3.75 × 3.75 × 3.2 mm3, and a total of 266 volumes for each subject. During the scan, the subjects were instructed to lie down with their eyes closed, not to think of anything in particular, and not to fall asleep. Padded foams were used to restrict head motion, and earplugs were used to attenuate scanner noise.
2.3. Voxel‐based morphometry analysis
VBM analysis was performed with the Statistical Parametric Mapping software (SPM8, http://www.fil.ion.ucl.ac.uk/spm) (Ashburner, 2009) using the VBM8 toolbox (http://dbm.neuro.uni-jena.de/vbm). The anatomical images were segmented into gray matter, white matter, and cerebrospinal fluid. The segmented images were then registered to the three‐dimensional Montreal Neurological Institute (MNI) space and spatially normalized via diffeomorphic anatomical registration through exponentiated lie algebra (DARTEL) algorithm (Ashburner, 2007), using an existing DARTEL template in VBM8. The image intensity of each voxel was modulated by Jacobian determinants to obtain the absolute gray matter volume for each subject (Mechelli, Price, Friston, & Ashburner, 2005). Finally, the resulting gray matter images were smoothed with an 8 mm full‐width half‐maximum (FWHM) isotropic Gaussian kernel. The group differences of GMV at voxel level were computed by two‐sample t tests. Age, gender, and total GMV were modeled as covariates of no interest. The statistical significance of the group differences was estimated via a Monte Carlo simulation (Alphasim) for multiple comparisons with p < .01. The DPABI toolbox (Yan, Wang, Zuo, & Zang, 2016) was used to determine the cluster size for the Alphasim correction significance, and a brain mask for gray matter was used.
2.4. Functional connectivity preprocessing
Conventional fMRI data preprocessing was performed using Data Processing Assistant for Resting‐State fMRI software (DPARSF, Advanced Edition, V3.2) (http://www.restfmri.net/forum/). The first 10 volumes were discarded to ensure steady‐state longitudinal magnetization. The remaining 256 resting‐state fMRI images were first corrected for the acquisition time delay between different slices and then realigned to the first volume to correct for head‐motion. The dataset with translational or rotational parameters exceeding ±1.0 mm or ±1.0° would be excluded, and 29 athletes' and 29 controls' data sets remained for further analysis. The images were further spatially normalized into a standard stereotaxic space at 3 × 3 × 3 mm3, using the Montreal Neurological Institute template in SPM8. Spatial smoothing was applied to our fMRI data with an isotropic Gaussian kernel (FWHM = 8 mm). Images were then linearly detrended and were corrected using linear regression to remove the possible spurious variances including six head motion parameters, the white matter, and the ventricular signals averaged from a white matter mask and a ventricular mask, respectively. In this study, we did not remove the global signal due to the possibility of it introducing a shift in the distribution of resting‐state functional connectivity data making biological interpretation ambiguous (Murphy et al., 2007; Saad et al., 2012). The residuals of these regressions were temporally band‐pass filtered (0.01 < f < 0.08 Hz) to reduce low‐frequency drifts and physiological high‐frequency respiratory and cardiac noises.
2.5. Optimal connectivity distance analysis based on stepwise functional connectivity
SFC analysis was performed on each subject's image. Briefly, the correlation matrices corresponding to each subject's whole‐brain functional connectivity network were first computed using the Pearson's correlations of each voxel to every voxel time series of the BOLD images. To remove low correlation coefficients, we used a false discovery rate (FDR) correction at a q level of 0.01 to control for multiple comparisons. Then, the degree of stepwise connectivity of voxel j, for a given link‐step distance l (), was computed from the count of all paths that (1) connected voxel j and any voxel in the seed area i and (2) had an exact length of l (Sepulcre et al., 2012). We consider a link‐step l as a specific number of functional connections from each voxel (or node) of the brain to the ROI/seed region. SFC was calculated up to seven link‐step distances as the SFC patterns became stable above that number with no gain in network topological information (Sepulcre et al., 2012). The data were downsampled to 8 mm isotropic voxels for computational efficiency (Sepulcre et al., 2012).
SFC analysis uses a priori selected seeds/voxels of interest to characterize regions that connect to specific seed brain areas at different levels of link‐step distances (Sepulcre et al., 2012). In this study, we used the brain areas showing altered GMV as ROI or seed regions for the SFC analysis. ROIs were defined as spheres centered at the local maxima of the statistic t map of the group differences in GMV, with radius of 12 mm. Therefore, of a brain voxel represents the sum of the number of pathways that connect to any one of the voxels in the ROI. The optimal connectivity distance Oji was further defined by the strongest path between j and i of all 7 link‐steps, which was calculated by the following formula:
where step(∙) is the function mapping the SFC value to its corresponding link‐step. Oji represents the link step with the strongest path between the seed ROI and a brain voxel.
Please note that conventional shortest path detection algorithms heavily rely on direct connections between nodes. In functional connectivity, there are many direct connections that do not represent the predominant (or optimal) connectivity pattern between two nodes (See an illustrative example in Supporting Information, Figure S1). To overcome this problem, we have developed the novel metric Oji that is able to capture the optimal distance between nodes independently of possibly spurious shortest paths. Thus, we would like to remark that our optimal distance approach computes the relative distance of a given voxel to the rest of the whole brain. Therefore, a global increase in inter‐regional correlations without a specific change in intrinsic network structure will not lead to apparent decrease in th path length of that voxel. In fact, the output of our metric will remain stable, as it will take into account all relative distances among voxels. Supporting Information, Figure S2 shows an example of two‐step connectivity for clarifications purposes. It also demonstrates how we compute our optimal distance metric.
The values of the optimal distance map are integers from 1 to 7, which are not normally distributed. Therefore, voxel‐wise comparisons of each optimal distance between the athlete group and the control group were performed using permutation test.
2.6. The attention network test
To test whether the optimal connectivity distance relates to attentional processes, all subjects were asked to perform a revised attention network test (ANT) (Wang et al., 2016b). Figure 1 demonstrates the diagram of the experimental design. The Stimuli were presented via E‐Prime 2.0 (http://www.pstnet.com; Psychology Software Tools, Inc) on a Lenovo‐PC computer with a 20‐in color screen monitor. The distance from participants' eyes to the screen was about 60 cm. Responses were collected via Q (for left targets) and P (for right targets) on the keyboard. All participants completed four blocks (alerting block, orienting block, executive control block, and baseline block) of the ANT. The order of the four blocks was counterbalanced across subjects. Each block took 424 s, which contained a buffer time of 4 s, two practice trials of 10 s, and 40 experimental trials of 10 s. As shown in Figure 1, each trial began with a fixation or cue for 100 ms which was followed by 300 ms fixation. After that, a target (congruent or incongruent, central, or spatial) appeared for 2,000 ms or until the participant pressed a key. Last, another fixation was presented to ensure the overall time of one trial was 10,000 ms (0.1 Hz). The subjects were asked to judge the direction of the third arrow (the central one) by pressing Q if it points to the left and P if it points to the right. Fixation was a plus sign and subtended 0.22° visual angle. The length of the whole target (five arrows and interarrow blank) was 3.1°.
Figure 1.
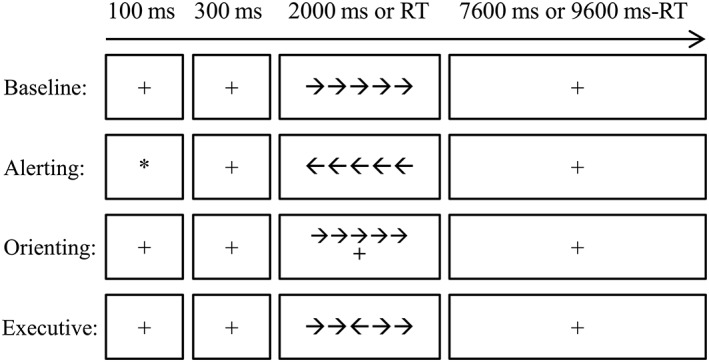
Diagram for the attention network test (ANT) procedure. The baseline, alerting, orienting, and executive control conditions were arranged in separated blocks. Each trial started with a cue (the alerting condition) or a fixation lasting for 100 ms. After a 300 ms interval, the target was presented for 2,000 ms or disappeared after one key was pressed. After that, a fixation was presented until the end of that trial. Each trial lasted for 10 s. RT, Reaction time
The attention network scores (ANSs) were computed to measure the reaction time of each attention subnetwork of alerting, orienting, and executive control compared to the baseline (Wang et al., 2016b). The difference in ANSs between the two groups was further analyzed using two‐sample t test for the three attention subnetworks separately.
2.7. Imaging correlation analysis
We examined if the reaction time was associated with the altered optimal distance between the two groups. We only used ANT scores and optimal connectivity distance measures that showed group differences. Partial correlation analysis was used to test the relationship between these scores using age and gender as cofounding factors. Correlation analyses were separately performed for the athlete group and the control group.
3. RESULTS
3.1. Morphometry analysis
After two‐sample t test, the athlete group showed significantly increased GMV in two main clusters compared with the control group. One cluster was mainly located in the right sensorimotor region including the right insula, parietal operculum [or operculum parietale (OP)], and supramarginal gyrus extending to the IPL. The other cluster was located in the limbic lobe and anterior lobe of the cerebellum encompassing the bilateral lingual gyrus, PCC, precuneus (PCUN), anterior cerebellar lobules IV–V, and anterior vermian lobules IV–V.
However, in this study, we did not find areas with significantly smaller GMV in the athlete group than in the control group. Figure 2 shows the group statistical parametric images of voxel‐based morphometry analysis between the two groups (Alphasim corrected p < .01, and continuous cluster size >2,383). Seed ROIs based on the two‐sample t test results were selected to obtain SFC maps between the seed regions and the remaining brain regions. They were centered at the peak t values in the VBM analysis. Table 2 illustrates the details of the chosen seed regions, including the MNI coordinates of peak voxels, statistical t values, and cluster sizes.
Figure 2.
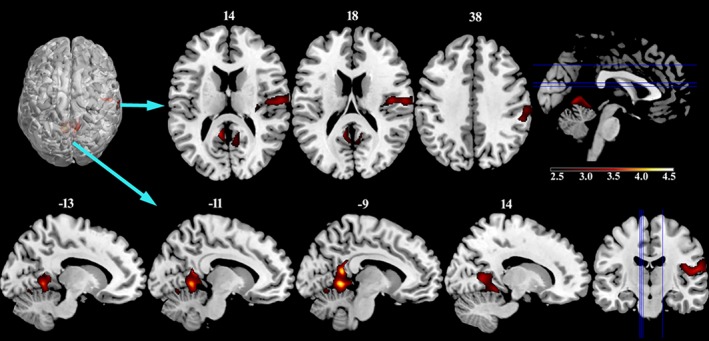
Increased gray matter volume in the athlete group compared to the control group (p < .01, Alphasim corrected)
Table 2.
Locations of seed regions used in the stepwise functional connectivity analysis
| Region name | Hem | Peak coordinates | Peak t value | Cluster size |
|---|---|---|---|---|
| Insula | R | (40 −10 21) | 3.91 | 345 |
| Inferior parietal | R | (43 −40 52) | 3.55 | 326 |
| Parietal operculum | R | (62 −14 15) | 3.85 | 698 |
| Supramarginal | R | (54 −33 39) | 3.60 | 859 |
| Posterior cingulate | L | (−11 −49 12) | 4.41 | 490 |
| Lingual | R | (12 −59 5) | 3.60 | 957 |
| Cerebellum IV–V | L | (−6 −51 0) | 4.61 | 531 |
| Vermis IV–V | / | (6 −45 −3) | 4.16 | 571 |
3.2. Stepwise functional connectivity pattern in athletes and controls
For each ROI defined in Table 2, we computed the optimal connectivity distance of each individual from the two groups based on the stepwise functional connectivity maps. Figures 3 and 4 show the averaged SFC maps of the seeds of the right insula, right OP, left PCC, and vermian lobules IV–V in one, three, five, and seven steps in the athlete and control groups. These four ROIs showed significantly different optimal connectivity distances toward the rest of the connectome (Figure 5). SFC maps of ROIs showed similar qualitative cortical distribution in both groups of athletes and controls (Figures 3 and 4).
Figure 3.
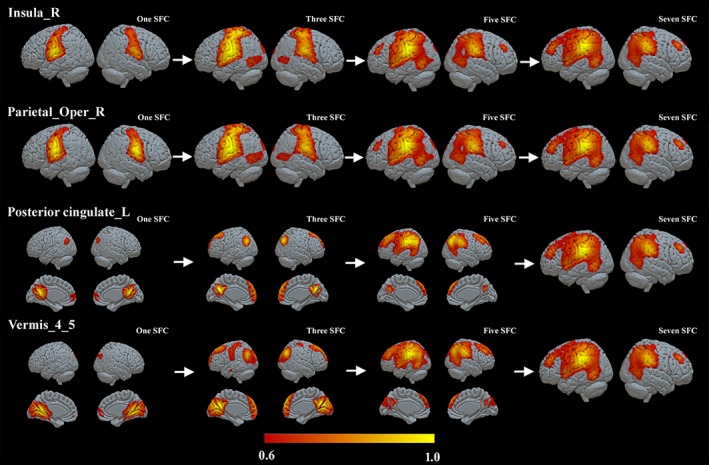
The stepwise functional connectivity (SFC) maps of the right insula, right parietal operculum, left posterior cingulate cortex, and vermian lobules IV–V in the athlete group. L, left; R, right; SFC, stepwise functional connectivity
Figure 4.
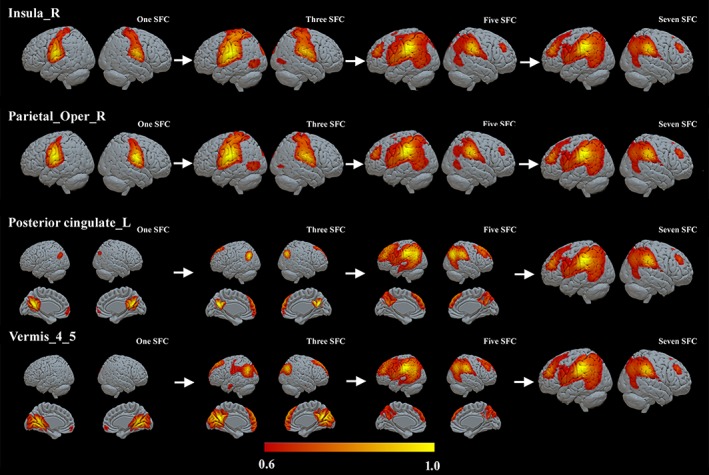
The stepwise functional connectivity (SFC) maps of the right insula, right parietal operculum, left posterior cingulate cortex, and vermian lobules IV–V in the control group. The abbreviations are the same as those in Figure 3
Figure 5.
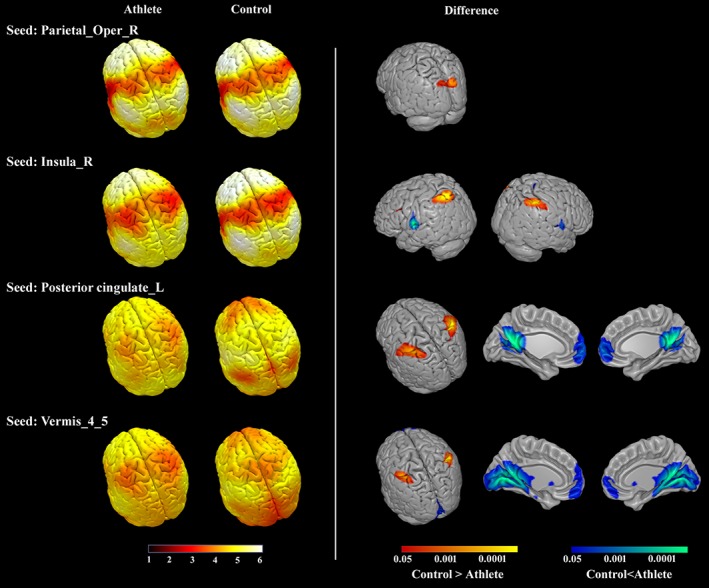
Mean optimal connectivity distance maps in the athlete group and the control group (left), and the significant differences of optimal distance between the groups (right, FDR corrected q < .05). L, left; R, right
For instance, the direct functional connectivity (one step distance) of the right insula and right OP seeds reached bilateral OP regions, and, in subsequent steps, expanded toward the bilateral middle/superior temporal lobe, middle/superior occipital lobe and cuneus (three‐step distance), and bilateral middle frontal lobe, MPFC, and supplementary motor area (SMA) (five‐ and seven‐step distances).
The left PCC seed directly connected to bilateral PCUN, bilateral middle/superior occipital cortex, angular gyrus, and bilateral MPFC, and later connected to the prefrontal lobe, bilateral middle, superior frontal cortex, and inferior parietal cortex (three and five steps). For the vermian lobules IV–V seed, we observed direct functional connections to bilateral cerebellar lobules IV–V expanding to the lingual gyrus, PCUN and PCC, and bilateral MPFC. Then the connectivity expanded to superior occipital cortex, middle/superior temporal cortex, and middle/superior frontal cortex in Step 3. Note that the absolute significant threshold (FDR p < .01) was used to construct the functional connectivity network; however, the integration connectivity patterns kept consistent when different relative thresholds were used (Supporting Information, Figures S3 and S4).
Although SFC maps can be analyzed separately to explore changes in individual steps of connectivity from specific ROIs, we use an optimal distance analysis to integrate all SFC information into one single map that captures how functional streams of specific ROIs connect to the rest of the voxels in the brain. Thus, our optimal distance analysis uses all SFC maps to determinate the preferential distance in which ROIs connect to other voxels, ranking from direct connectivity (one step) to indirect connectivity via relay stations (up to seven steps).
3.3. Optimal connectivity distance in athletes and controls
We detected statistically significant differences between athletes and controls in the optimal distance maps of four ROIs (FDR corrected q < .05): right OP, right insula, left PCC, and vermian lobules IV–V. Compared with the control group, the athlete group had a significantly smaller optimal connectivity distance between: the right OP seed and the bilateral superior occipital gyrus, the right insula seed and the bilateral superior parietal lobule (SPL) extending to the intraparietal sulcus (IPS), the left PCC seed and the bilateral postcentral gyrus extending to SPL/IPS, and the vermian lobules IV–V seed, and the bilateral SPL/IPS. Significantly larger optimal connectivity distance was detected in the athlete group compared to the control group between the right insula seed and the bilateral central opercular cortex; the left PCC seed and the bilateral PCC extending to PCUN; the left PCC seed and the MPFC; the vermian lobules IV–V seed and the bilateral lingual gyrus, PCC, and PCUN extending to cerebellar lobules IV–V and vermian lobules IV–V; and the vermian lobules IV–V seed and the MPFC. Figure 5 depicts the mean optimal connectivity distance maps in the athlete and control groups respectively, and group difference maps of optimal connectivity distance. The information of the peak voxels in the group difference maps is summarized in Table 3. The results kept consistent when different relative thresholds were used (Supporting Information, Figure S5).
Table 3.
Brain regions showed significantly different optimal link steps with seed regions between the athlete group and the control group
| Seed | Region name | Hem | Peak coordinates | Mean steps | |
|---|---|---|---|---|---|
| Control | Athlete | ||||
| R parietal operculum | Superior occipital | L | (−16 −72 24) | 5.37 ± 1.14 | 4.02 ± 1.10 |
| R | (16 −88 32) | 5.27 ± 0.94 | 4.15 ± 1.05 | ||
| R insula | Superior parietal | L | (−40 −48 40) | 6.14 ± 0.44 | 4.12 ± 0.78 |
| R | (48 −48 56) | 5.82 ± 0.75 | 4.08 ± 0.90 | ||
| Central opercular | L | (−56 −8 8) | 2.18 ± 0.77 | 4.17 ± 0.75 | |
| R | (56 −8 16) | 1.90 ± 0.48 | 3.98 ± 0.54 | ||
| L posterior cingulate | Postcentral | L | (−48 −32 48) | 5.30 ± 0.90 | 3.62 ± 1.02 |
| R | (40 −32 48) | 5.35 ± 0.96 | 3.30 ± 1.47 | ||
| Precuneus | L | (−16 −50 16) | 1.35 ± 0.43 | 3.54 ± 0.72 | |
| R | (16 −56 24) | 1.54 ± 0.43 | 3.99 ± 0.54 | ||
| Medial prefrontal | L | (0 56 0) | 2.36 ± 0.63 | 4.39 ± 0.93 | |
| Vermis IV–V | Superior parietal | L | (−56 −24 48) | 5.28 ± 0.65 | 3.57 ± 0.90 |
| R | (50 −36 48) | 5.24 ± 0.85 | 3.22 ± 1.21 | ||
| Lingual | L | (0 −80 −8) | 1.70 ± 0.62 | 4.30 ± 1.08 | |
| Medial prefrontal | L | (0 56 0) | 2.97 ± 1.07 | 4.70 ± 1.09 | |
L = left; R = right.
3.4. ANT scores and relationships with optimal connectivity distance
The reaction time and accuracy of each task condition is summarized in Table 4. The reaction time of alerting (A) is shorter than that of the baseline; meanwhile, the baseline reaction time is shorter than those of orienting (O) and executive control (E). The mean ANS of A was negative while O and E were positive. The significantly smaller O was found in the athlete group compared to the control group (p < .05), whereas no significant difference was found between groups for the other two ANSs (Figure 6). No further analysis was made on accuracy due to the ceiling effect.
Table 4.
The reaction time, attention network score, and accuracy per condition (mean ± SD)
| Condition | Athlete group | Control group | ||||
|---|---|---|---|---|---|---|
| RT (ms) | ANS (%) | Accuracy (%) | RT (ms) | ANS (%) | Accuracy (%) | |
| Baseline | 448.87 ± 56.96 | / | 98.88 ± 12.65 | 514.12 ± 171.01 | / | 98.97 ± 12.53 |
| Alerting | 398.08 ± 43.95 | −0.11 ± 0.06 | 98.19 ± 14.78 | 466.45 ± 154.28 | −0.09 ± 0.08 | 98.10 ± 14.42 |
| Orienting | 545.45 ± 65.89 | 0.22 ± 0.09 | 98.53 ± 14.20 | 671.96 ± 248.76 | 0.30 ± 0.15 | 98.45 ± 19.38 |
| Executive | 558.50 ± 89.88 | 0.24 ± 0.10 | 98.45 ± 16.92 | 651.57 ± 283.95 | 0.25 ± 0.10 | 98.45 ± 15.55 |
Figure 6.
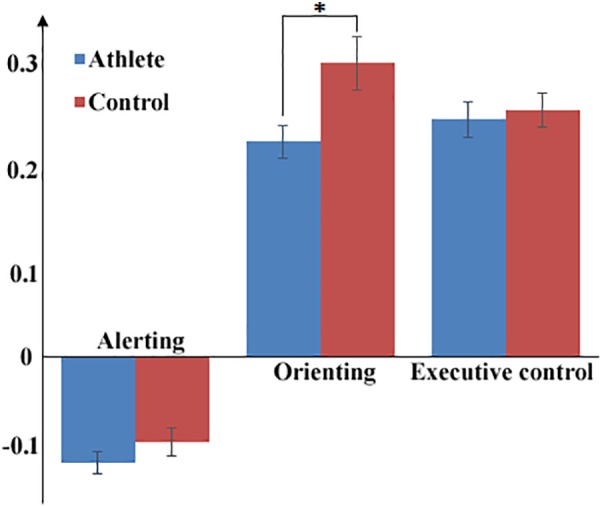
Mean attention network scores for the three attention subnetworks and the group differences between the athlete group and the control group (*significant threshold p < .05)
Figure 7 depicts the significant correlations between the optimal connectivity distance and the reaction time of orienting in the athlete/control group. In the athlete group, the optimal connectivity distance between the right insula and the left SPL, the left PCC and the right postcentral gyrus, and the vermis and the right SPL showed significant positive correlations with the orienting reaction time. On the other hand, the optimal connectivity distance between the left PCC and the left MPFC and the left PCC and the left PCUN showed significant negative correlations with the orienting reaction time. In the control group, the optimal connectivity distance between the right insula and the left SPL, the vermis and the right SPL, and the left PCC and the left MPFC did not show significant correlations with the orienting reaction time. This might be due to the floor effect.
Figure 7.
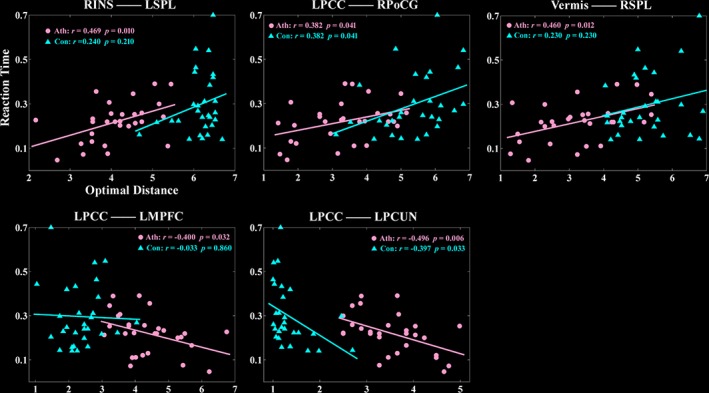
Significant correlations between reaction time and optimal connectivity distance in the athlete group and the control group. Ath, the athlete group; con, the control group; INS, insula; L, left; MPFC, medial prefrontal cortex; PCC, posterior cingulate cortex; PCUN, precuneus; PoCG, postcentral gyrus; R, right; SPL, superior parietal lobule
4. DISCUSSION
In this study, we found that little‐ball student athletes demonstrated greater GMV in the limbic lobe and the anterior lobe of the cerebellum, and the right sensorimotor area. These two clusters were mainly embedded in the two functional modules accompanying motor skill training and acquisition (Bassett, Yang, Wymbs, & Grafton, 2015; Di et al., 2012; Lappi, 2015). The volumetric enlargement detected in the athletes' brain may result from neuroplasticity caused by sports‐related motor training and exercise (Di et al., 2012; Park et al., 2009). Further SFC analysis based on the VBM results demonstrated that the athlete group and the control group shared similar functional streams for motor process. However, we found significant differences in the optimal connectivity distance of functional streams between the athlete group and the control group, implying that plastic adaptations of functional pathways were induced by the motor skill training in the athlete group.
4.1. GMV differences between athletes and controls
The greater cerebellum GMV in athletes has been consistently reported, such as in basketball players (Park et al., 2009), speed skaters (Park et al., 2012), badminton players (Di et al., 2012), and mountain climbers (Di Paola, Caltagirone, & Petrosini, 2013). These findings were interpreted as evidence for morphological plasticity in the cerebellum activated by long‐term motor skill training. In this study, the greater cerebellum GMV was specifically located in the lobules IV–V of the cerebellum and the IV–V vermian lobules in the anterior cerebellum lobe. These areas represent the arms, hands, and feet (Buckner, Krienen, Castellanos, Diaz, & Yeo, 2011; Manni & Petrosini, 2004) and are especially involved in motor execution, synchronization, coordination, control, and prediction (Cerasa et al., 2017; Koziol et al., 2014; Stoodley & Schmahmann, 2010; Wenzel, Taubert, Ragert, Krug, & Villringer, 2014). In addition, the GMV expansion in the athlete group extended to the bilateral lingual gyrus, PCC, and PCUN, which played important roles in visual attention. These areas have been reported to show increased activity in visual spatial attention and skill learning tasks (Bassett et al., 2015; Engelmann, Damaraju, Padmala, & Pessoa, 2009; Leech & Sharp, 2014), and have also been found with increased GMV in basketball players (Tan et al., 2016). In little‐ball players, the movement is mainly linked to hand–eye coordination to be able to visually guide hitting the ball. The improved visual attention processing and visual motor coordination were especially crucial in such fast reactive sports as badminton and table tennis, where athletes have to process many cues simultaneously to react appropriately (Wolf et al., 2014).
The other cluster showing increased GMV in the athlete group compared to the control group was located in the right sensorimotor regions including right OP, insula, and supramarginal gyrus extending to IPL. There are consistent with other studies of athletes, such as basketball players (Tan et al., 2016), triathlon athletes (Wood et al., 2016), handball players (Hanggi et al., 2015), and skilled golfers (Jancke et al., 2009). This cluster plays an important role in complex cognitive functions including visual perception, spatial perception, visuomotor integration, and motor control (Anderson, 2011; Sepulcre, 2014b; Tan et al., 2016). The increased GMV in this module in the athlete group suggested the structural plasticity induced by motor skill training in these regions for improved sensory, motor, and cognition regulation.
Interestingly, our findings were also in line with studies detecting regional brain morphology in juggling, a frequently used tool to investigate neuroplasticity associated with motor‐training (Draganski et al., 2004; Driemeyer, Boyke, Gaser, Buchel, & May, 2008; Gerber et al., 2014). To coordinate goal‐directed hand movements and to orient themselves in space were skills crucially important to both jugglers and little‐ball players (Driemeyer et al., 2008; Gerber et al., 2014; van de Water, Huijgen, Faber, & Elferink‐Gemser, 2017; Wolf et al., 2014). Thereby, the structural cortical plasticity involved in the regions responsible for visuomotor control and eye–hand coordination were found in both players.
4.2. Optimal connectivity distance differences between athletes and controls
The seed‐based SFC approach was further applied to answer the questions on how the brain's functional connectivity structure supports the plastic adaptations of athletes' brains. In both the athlete group and the control group, SFC maps converged to the same network, which were known as the cortical hubs of the human functional brain (Buckner et al., 2009; Sepulcre, 2014b; Sepulcre et al., 2010). As reported in previous work (Sepulcre, 2014b), modality‐specific streams propagate from local networks to the common functional hubs of the human brain.
In our optimal distance analysis, the seeds of the right insula, the left PCC, and the vermian lobules IV–V were found to have significantly smaller optimal distances to the hubs mainly in the dorsal attention network (DAN) in the athlete group compared to the control group, on average 2 link steps less. The SFC between the seed regions and the hubs of the attention network (SPL/intraparietal sulcus) suggested that spatial attention and visuomotor coordination among these areas are important to accomplish the tasks demanding externalized attention (Spreng, Stevens, Chamberlain, Gilmore, & Schacter, 2010; Vincent, Kahn, Snyder, Raichle, & Buckner, 2008; Vossel, Geng, & Fink, 2014).
Of the three attention subnetworks, orienting involves the prioritization of sensory input by selecting a special modality or location (Petersen & Posner, 2012). The DAN is one of the main parts of the orienting network. It is important in top–down processes of visuospatial attention, focuses on the presentation of a cue, and has been identified with rapid strategic control over attention (Petersen & Posner, 2012). A significantly faster orienting reaction time was found in the athlete group compared to that of the control group (p < .05). Further correlation analysis showed that orienting reaction time in the athlete group were positively correlated with the optimal distance between the right insula and the left SPL, the left PCC and the right postcentral, and the vermis and the right SPL. The results demonstrated that faster orienting reaction time was associated with smaller optimal distance. The behavioral results verified that by comparing it to the control group.
The athlete group had shorter reaction time of orienting, and this was associated with a smaller optimal distance when referring to the number of steps between the seed regions and the DAN. The findings implied that the motor skill training would shorten the link‐step distance to accelerate the reaction, movement planning and execution with high attentional demands (Wolf et al., 2014). This is especially important for the fast‐pace racket athletes of badminton and table tennis (van de Water et al., 2017; Wang, Guo, & Zhou, 2016a).
Interestingly, the seeds of the right insula, left PCC, and vermian lobules IV–V were found to have significantly larger optimal distance to the brain hubs of the PCC and the MPFC in the athlete group when compared to the control group, on average 2 link steps more. Further correlation analysis showed that the optimal distance between the left LPCC and the left MPFC and between the left PCC and the left PCUN were negatively correlated with the orienting reaction time in the athlete group, demonstrating that slower reaction time was associated with smaller optimal distance between these regions. These two hubs, PCC and MPFC, are the central nodes in the default mode network (DMN) of the brain. The results suggested that in contrast to improving the integration from seed regions to the DAN in the athlete group, the connectivity integration from the seed regions to the DMN reduced in the athlete group compared to that in the control group. These findings are in agreement with previous interpretations about competitive relationship between the DAN and the DMN (Fox et al., 2005; Kelly, Uddin, Biswal, Castellanos, & Milham, 2008; Spreng et al., 2010).
The processed information might be gathered from both externally directed and internally directed attention. Prior studies have stated that the DMN deactivates during tasks with externally directed attention while activating during planning and daydreaming when attention is internally directed (Leech & Sharp, 2014; Spreng et al., 2010). A failure of the DMN to deactivate at proper times is associated with poor cognitive function (Leech & Sharp, 2014). Note that the control group had mean steps ranging from 5.24 to 6.14 between the seed regions and the hubs in the DAN and mean steps ranging from 1.35 to 2.97 between the seed regions and the hubs in the DMN; as for the athlete group, the mean steps between the seed regions and the DAN ranged from 3.22 to 4.12, and between the seed regions and the DMN, from 3.54 to 4.74. The motor skill training probably narrowed the difference of the distance from the seed regions reaching the DAN and the DMN. This training‐induced narrowing enabled the information flow from the seed regions to reach the DAN and the DMN almost in the same step, and to regulate the focus of external and internal attention synchronously. Consequently, we observe a functional connectivity reorganization in the athlete group compared to the control group that suggest a distinctive ability to balance internally and externally focused attention systems (Leech, Kamourieh, Beckmann, & Sharp, 2011).
4.3. Relationship between structural and functional changes
Our findings showed larger GMV and different functional stream architecture in various cortical networks in the athlete group compared to the control group. This suggested that complex motor and cognitive functions combining visual attention, perceptual anticipation, and motor execution among the brain regions were required in little‐ball athletes (Di et al., 2012; Tan et al., 2016). The brain structural and functional architectures as well as their dynamic changes were strongly associated (Honey, Thivierge, & Sporns, 2010; Koch, Norris, & Hund‐Georgiadis, 2002). In general, an increase in gray matter could be due to microscopic alterations such as an increase in cell size, neural or glial cell genesis, spine density, or even changes in blood flow or interstitial fluid (Draganski et al., 2004; Driemeyer et al., 2008), which could also result in functional changes. Motor skill training would induce cortical plasticity in the underlying neuronal components and facilitate the communication of the components within the corresponding networks (Tan et al., 2016). Therefore, it is not surprising that in athletes, brain areas related to visuomotor coordination showed increased GMV and enhanced functional connectivity with other cortical areas related to the regulation of internally and externally focused attention. Interestingly, we found a consistently increase in GMV of specific brain regions while adaptations in the optimal distance of DAN and DMN connectivity were not constrained to one direction. This could be due to specific functions of the DAN and DMN associated with attention. The joint action of the structural and functional changes in the networks would largely contribute to the enhancement of the reaction and execution with high attentional demands in athletes.
4.4. Limitations
Several limitations of this study are worth mentioning. First, given the lack of directionality information provided by functional connectivity MRI data, in the SFC analysis, we did not include any restrictions about recurrent pathways crossing the voxels multiple times (Sepulcre et al., 2012). The optimal connectivity distance analysis based on SFC might include repeated paths. In addition, the fMRI data contain both spatial and temporal information; however, SFC approach is unable to capture the temporal information. Further dynamic SFC approach may help solve the problem. When temporal information is added, the pathway is not reversible. Second, note that in our study, we used a nonathlete control group. Therefore, some of our findings may be due to concomitant factors that are beyond little‐ball sport training demands, such as fitness or general workouts, and may be associated with common athletes. Further longitudinal studies performed along the training course may help address this question.
5. CONCLUSIONS
Using structural and resting‐state functional imaging techniques, this study revealed that there were GMV increases, and altered functional stream architecture among the brain hubs mainly in the DAN and DMN in little‐ball student athletes compared to controls. Specifically, athletes showed greater GMV in the two brain clusters mainly embedded in the functional module accompanying motor skill training. Notably, the new SFC approach explored smaller optimal connectivity distance to the DAN and larger optimal connectivity distance to the DMN in athletes compared to controls. The functional connectivity adaptations narrowed the differences in distance from the seed regions to the DAN and DMN, and might regulate the focus of external and internal attention synchronously in athletes. Furthermore, the reaction time of the orienting attention subnetwork was positively correlated with optimal connectivity distance between the seeds and the DAN while negatively correlated with optimal connectivity distance between the seeds and the DMN, suggesting the association between link‐step distance and reaction acceleration of orienting attention.
Supporting information
S‐Figure S1 Different results from the shortest path and optimal distance. If we have a pair of nodes (D and B) with a direct pathway of moderate connectivity value and two indirect pathways of high connectivity values, any shortest path algorithm will mark the direct connectivity as the shortest path (Dijkstra algorithm here for instance). However, they will ignore that the predominant pattern of connectivity between our pair of nodes is actually through two steps of connectivity.
S‐Figure S2. An example of two‐steps connectivity showing that a global increase in inter‐regional correlations without a specific change in intrinsic network structure will not lead to apparent decrease in path length of that voxel.
S‐Figure S3. The stepwise functional connectivity (SFC) maps of right insula, and left posterior cingulate cortex in the athlete group using the relative thresholds of 10% links and 20% links, respectively.
S‐Figure S4. The stepwise functional connectivity (SFC) maps of right insula and left posterior cingulate cortex in the control group using the relative thresholds of 10% links and 20% links, respectively.
R‐Figure S5. The mean optimal connectivity distance maps in the athlete group and the control group (left), and the significant differences of optimal distance between the groups (right) using the relative thresholds of 10% links and 20% links, respectively.
ACKNOWLEDGMENTS
The work is supported by the National Natural Science Foundation of China (61573085, 61533006, 11271001, 31600930, and 6137014), Sichuan Science and Technology Program (2018TJP0016, 2015FZ0088, and 2017JY0198), and China Scholarship Council (201506075025).
Gao Q, Yu Y, Su X, et al. Adaptation of brain functional stream architecture in athletes with fast demands of sensorimotor integration. Hum Brain Mapp. 2019;40:420–431. 10.1002/hbm.24382
Funding information China Scholarship Council, Grant/Award Number: 201506075025; Sichuan Science and Technology Program, Grant/Award Numbers: 2017JY0198, 2015FZ0088, 2018TJP0016; National Natural Science Foundation of China, Grant/Award Numbers: 6137014, 31600930, 11271001, 61533006, 61573085
Huafu Chen and Jorge Sepulcre share senior authorship.
Contributor Information
Jorge Sepulcre, Email: sepulcre@nmr.mgh.harvard.edu.
Huafu Chen, Email: chenhf@uestc.edu.cn.
REFERENCES
- Anderson, R. A. (2011). Inferior parietal lobule function in spatial perception and visuomotor integration. Comprehensive physiology, 5, 483–518. [Google Scholar]
- Ashburner, J. (2007). A fast diffeomorphic image registration algorithm. NeuroImage, 38, 95–113. [DOI] [PubMed] [Google Scholar]
- Ashburner, J. (2009). Computational anatomy with the SPM software. Magnetic Resonance Imaging, 27, 1163–1174. [DOI] [PubMed] [Google Scholar]
- Ashburner, J. , & Friston, K. J. (2000). Voxel‐based morphometry‐‐The methods. NeuroImage, 11, 805–821. [DOI] [PubMed] [Google Scholar]
- Bassett, D. S. , Yang, M. , Wymbs, N. F. , & Grafton, S. T. (2015). Learning‐induced autonomy of sensorimotor systems. Nature Neuroscience, 18, 744–751. [DOI] [PMC free article] [PubMed] [Google Scholar]
- Buckner, R. L. , Krienen, F. M. , Castellanos, A. , Diaz, J. C. , & Yeo, B. T. (2011). The organization of the human cerebellum estimated by intrinsic functional connectivity. Journal of Neurophysiology, 106, 2322–2345. [DOI] [PMC free article] [PubMed] [Google Scholar]
- Buckner, R. L. , Sepulcre, J. , Talukdar, T. , Krienen, F. M. , Liu, H. , Hedden, T. , … Johnson, K. A. (2009). Cortical hubs revealed by intrinsic functional connectivity: Mapping, assessment of stability, and relation to Alzheimer's disease. The Journal of Neuroscience, 29, 1860–1873. [DOI] [PMC free article] [PubMed] [Google Scholar]
- Cerasa, A. , Sarica, A. , Martino, I. , Fabbricatore, C. , Tomaiuolo, F. , Rocca, F. , … Quattrone, A. (2017). Increased cerebellar gray matter volume in head chefs. PLoS One, 12, e0171457. [DOI] [PMC free article] [PubMed] [Google Scholar]
- Di Paola, M. , Caltagirone, C. , & Petrosini, L. (2013). Prolonged rock climbing activity induces structural changes in cerebellum and parietal lobe. Human Brain Mapping, 34, 2707–2714. [DOI] [PMC free article] [PubMed] [Google Scholar]
- Di, X. , Zhu, S. , Jin, H. , Wang, P. , Ye, Z. , Zhou, K. , … Rao, H. (2012). Altered resting brain function and structure in professional badminton players. Brain Connectivity, 2, 225–233. [DOI] [PMC free article] [PubMed] [Google Scholar]
- Draganski, B. , Gaser, C. , Busch, V. , Schuierer, G. , Bogdahn, U. , & May, A. (2004). Neuroplasticity: Changes in grey matter induced by training. Nature, 427, 311–312. [DOI] [PubMed] [Google Scholar]
- Driemeyer, J. , Boyke, J. , Gaser, C. , Buchel, C. , & May, A. (2008). Changes in gray matter induced by learning‐‐revisited. PLoS One, 3, e2669. [DOI] [PMC free article] [PubMed] [Google Scholar]
- Engelmann, J. B. , Damaraju, E. , Padmala, S. , & Pessoa, L. (2009). Combined effects of attention and motivation on visual task performance: Transient and sustained motivational effects. Frontiers in Human Neuroscience, 3, 4. [DOI] [PMC free article] [PubMed] [Google Scholar]
- Fox, M. D. , Snyder, A. Z. , Vincent, J. L. , Corbetta, M. , Van Essen, D. C. , & Raichle, M. E. (2005). The human brain is intrinsically organized into dynamic, anticorrelated functional networks. Proceedings of the National Academy of Sciences of the United States of America, 102, 9673–9678. [DOI] [PMC free article] [PubMed] [Google Scholar]
- Gerber, P. , Schlaffke, L. , Heba, S. , Greenlee, M. W. , Schultz, T. , & Schmidt‐Wilcke, T. (2014). Juggling revisited ‐ a voxel‐based morphometry study with expert jugglers. NeuroImage, 95, 320–325. [DOI] [PubMed] [Google Scholar]
- Halsband, U. , & Lange, R. K. (2006). Motor learning in man: A review of functional and clinical studies. Journal of Physiology, Paris, 99, 414–424. [DOI] [PubMed] [Google Scholar]
- Hanggi, J. , Langer, N. , Lutz, K. , Birrer, K. , Merillat, S. , & Jancke, L. (2015). Structural brain correlates associated with professional handball playing. PLoS One, 10, e0124222. [DOI] [PMC free article] [PubMed] [Google Scholar]
- Honey, C. J. , Thivierge, J. P. , & Sporns, O. (2010). Can structure predict function in the human brain? NeuroImage, 52, 766–776. [DOI] [PubMed] [Google Scholar]
- Jancke, L. , Koeneke, S. , Hoppe, A. , Rominger, C. , & Hanggi, J. (2009). The architecture of the golfer's brain. PLoS One, 4, e4785. [DOI] [PMC free article] [PubMed] [Google Scholar]
- Kelly, A. M. , Uddin, L. Q. , Biswal, B. B. , Castellanos, F. X. , & Milham, M. P. (2008). Competition between functional brain networks mediates behavioral variability. NeuroImage, 39, 527–537. [DOI] [PubMed] [Google Scholar]
- Koch, M. A. , Norris, D. G. , & Hund‐Georgiadis, M. (2002). An investigation of functional and anatomical connectivity using magnetic resonance imaging. NeuroImage, 16, 241–250. [DOI] [PubMed] [Google Scholar]
- Koziol, L. F. , Budding, D. , Andreasen, N. , D'Arrigo, S. , Bulgheroni, S. , Imamizu, H. , … Yamazaki, T. (2014). Consensus paper: The cerebellum's role in movement and cognition. Cerebellum, 13, 151–177. [DOI] [PMC free article] [PubMed] [Google Scholar]
- Lappi, O. (2015). The Racer's brain ‐ how domain expertise is reflected in the neural substrates of driving. Frontiers in Human Neuroscience, 9, 635. [DOI] [PMC free article] [PubMed] [Google Scholar]
- Leech, R. , Kamourieh, S. , Beckmann, C. F. , & Sharp, D. J. (2011). Fractionating the default mode network: Distinct contributions of the ventral and dorsal posterior cingulate cortex to cognitive control. The Journal of Neuroscience, 31, 3217–3224. [DOI] [PMC free article] [PubMed] [Google Scholar]
- Leech, R. , & Sharp, D. J. (2014). The role of the posterior cingulate cortex in cognition and disease. Brain, 137, 12–32. [DOI] [PMC free article] [PubMed] [Google Scholar]
- Manni, E. , & Petrosini, L. (2004). A century of cerebellar somatotopy: A debated representation. Nature Reviews. Neuroscience, 5, 241–249. [DOI] [PubMed] [Google Scholar]
- Mechelli, A. , Price, C. J. , Friston, K. J. , & Ashburner, J. (2005). Voxel‐based morphometry of the human brain: Methods and applications. Current Medical Imaging Reviews, 1, 105–113. [Google Scholar]
- Mesulam, M. M. (1998). From sensation to cognition. Brain, 121(Pt 6), 1013–1052. [DOI] [PubMed] [Google Scholar]
- Murphy, K. J. , Meyer, B. J. , Mori, T. A. , Burke, V. , Mansour, J. , Patch, C. S. , … Howe, P. R. (2007). Impact of foods enriched with n‐3 long‐chain polyunsaturated fatty acids on erythrocyte n‐3 levels and cardiovascular risk factors. The British Journal of Nutrition, 97, 749–757. [DOI] [PubMed] [Google Scholar]
- Oldfield, R. C. (1971). The assessment and analysis of handedness: The Edinburgh inventory. Neuropsychologia, 9, 97–113. [DOI] [PubMed] [Google Scholar]
- Park, I. S. , Lee, K. J. , Han, J. W. , Lee, N. J. , Lee, W. T. , Park, K. A. , & Rhyu, I. J. (2009). Experience‐dependent plasticity of cerebellar vermis in basketball players. Cerebellum, 8, 334–339. [DOI] [PubMed] [Google Scholar]
- Park, I. S. , Lee, N. J. , Kim, T. Y. , Park, J. H. , Won, Y. M. , Jung, Y. J. , … Rhyu, I. J. (2012). Volumetric analysis of cerebellum in short‐track speed skating players. Cerebellum, 11, 925–930. [DOI] [PubMed] [Google Scholar]
- Petersen, S. E. , & Posner, M. I. (2012). The attention system of the human brain: 20 years after. Annual Review of Neuroscience, 35, 73–89. [DOI] [PMC free article] [PubMed] [Google Scholar]
- Saad, Z. S. , Gotts, S. J. , Murphy, K. , Chen, G. , Jo, H. J. , Martin, A. , & Cox, R. W. (2012). Trouble at rest: How correlation patterns and group differences become distorted after global signal regression. Brain Connectivity, 2, 25–32. [DOI] [PMC free article] [PubMed] [Google Scholar]
- Sepulcre, J. (2014a). Functional streams and cortical integration in the human brain. The Neuroscientist, 20, 499–508. [DOI] [PubMed] [Google Scholar]
- Sepulcre, J. (2014b). Integration of visual and motor functional streams in the human brain. Neuroscience Letters, 567, 68–73. [DOI] [PubMed] [Google Scholar]
- Sepulcre, J. (2015). An OP4 functional stream in the language‐related neuroarchitecture. Cerebral Cortex, 25, 658–666. [DOI] [PubMed] [Google Scholar]
- Sepulcre, J. , Liu, H. , Talukdar, T. , Martincorena, I. , Yeo, B. T. , & Buckner, R. L. (2010). The organization of local and distant functional connectivity in the human brain. PLoS Computational Biology, 6, e1000808. [DOI] [PMC free article] [PubMed] [Google Scholar]
- Sepulcre, J. , Sabuncu, M. R. , Yeo, T. B. , Liu, H. , & Johnson, K. A. (2012). Stepwise connectivity of the modal cortex reveals the multimodal organization of the human brain. The Journal of Neuroscience, 32, 10649–10661. [DOI] [PMC free article] [PubMed] [Google Scholar]
- Spreng, R. N. , Stevens, W. D. , Chamberlain, J. P. , Gilmore, A. W. , & Schacter, D. L. (2010). Default network activity, coupled with the frontoparietal control network, supports goal‐directed cognition. NeuroImage, 53, 303–317. [DOI] [PMC free article] [PubMed] [Google Scholar]
- Stoodley, C. J. , & Schmahmann, J. D. (2010). Evidence for topographic organization in the cerebellum of motor control versus cognitive and affective processing. Cortex, 46, 831–844. [DOI] [PMC free article] [PubMed] [Google Scholar]
- Tan, X. Y. , Pi, Y. L. , Wang, J. , Li, X. P. , Zhang, L. L. , Dai, W. , … Wu, Y. (2016). Morphological and functional differences between athletes and novices in cortical neuronal networks. Frontiers in Human Neuroscience, 10, 660. [DOI] [PMC free article] [PubMed] [Google Scholar]
- van de Water, T. , Huijgen, B. , Faber, I. , & Elferink‐Gemser, M. (2017). Assessing cognitive performance in badminton players: A reproducibility and validity study. Journal of Human Kinetics, 55, 149–159. [DOI] [PMC free article] [PubMed] [Google Scholar]
- Vincent, J. L. , Kahn, I. , Snyder, A. Z. , Raichle, M. E. , & Buckner, R. L. (2008). Evidence for a frontoparietal control system revealed by intrinsic functional connectivity. Journal of Neurophysiology, 100, 3328–3342. [DOI] [PMC free article] [PubMed] [Google Scholar]
- Vossel, S. , Geng, J. J. , & Fink, G. R. (2014). Dorsal and ventral attention systems: Distinct neural circuits but collaborative roles. The Neuroscientist, 20, 150–159. [DOI] [PMC free article] [PubMed] [Google Scholar]
- Wang, B. , Guo, W. , & Zhou, C. (2016a). Selective enhancement of attentional networks in college table tennis athletes: A preliminary investigation. PeerJ, 4, e2762. [DOI] [PMC free article] [PubMed] [Google Scholar]
- Wang, Y. F. , Long, Z. , Cui, Q. , Liu, F. , Jing, X. J. , Chen, H. , … Chen, H. F. (2016b). Low frequency steady‐state brain responses modulate large scale functional networks in a frequency‐specific means. Human Brain Mapping, 37, 381–394. [DOI] [PMC free article] [PubMed] [Google Scholar]
- Wenzel, U. , Taubert, M. , Ragert, P. , Krug, J. , & Villringer, A. (2014). Functional and structural correlates of motor speed in the cerebellar anterior lobe. PLoS One, 9, e96871. [DOI] [PMC free article] [PubMed] [Google Scholar]
- Wolf, S. , Brolz, E. , Scholz, D. , Ramos‐Murguialday, A. , Keune, P. M. , Hautzinger, M. , … Strehl, U. (2014). Winning the game: Brain processes in expert, young elite and amateur table tennis players. Frontiers in Behavioral Neuroscience, 8, 370. [DOI] [PMC free article] [PubMed] [Google Scholar]
- Wood, K. N. , Nikolov, R. , & Shoemaker, J. K. (2016). Impact of long‐term endurance training vs. guideline‐based physical activity on brain structure in healthy aging. Frontiers in Aging Neuroscience, 8, 155. [DOI] [PMC free article] [PubMed] [Google Scholar]
- Xu, H. , Wang, P. , Ye, Z. , Di, X. , Xu, G. , Mo, L. , … Jin, H. (2016). The role of medial frontal cortex in action anticipation in professional badminton players. Frontiers in Psychology, 7, 1817. [DOI] [PMC free article] [PubMed] [Google Scholar]
- Yan, C. G. , Wang, X. D. , Zuo, X. N. , & Zang, Y. F. (2016). DPABI: Data processing & analysis for (resting‐state) brain imaging. Neuroinformatics, 14, 339–351. [DOI] [PubMed] [Google Scholar]
Associated Data
This section collects any data citations, data availability statements, or supplementary materials included in this article.
Supplementary Materials
S‐Figure S1 Different results from the shortest path and optimal distance. If we have a pair of nodes (D and B) with a direct pathway of moderate connectivity value and two indirect pathways of high connectivity values, any shortest path algorithm will mark the direct connectivity as the shortest path (Dijkstra algorithm here for instance). However, they will ignore that the predominant pattern of connectivity between our pair of nodes is actually through two steps of connectivity.
S‐Figure S2. An example of two‐steps connectivity showing that a global increase in inter‐regional correlations without a specific change in intrinsic network structure will not lead to apparent decrease in path length of that voxel.
S‐Figure S3. The stepwise functional connectivity (SFC) maps of right insula, and left posterior cingulate cortex in the athlete group using the relative thresholds of 10% links and 20% links, respectively.
S‐Figure S4. The stepwise functional connectivity (SFC) maps of right insula and left posterior cingulate cortex in the control group using the relative thresholds of 10% links and 20% links, respectively.
R‐Figure S5. The mean optimal connectivity distance maps in the athlete group and the control group (left), and the significant differences of optimal distance between the groups (right) using the relative thresholds of 10% links and 20% links, respectively.