

Abstract
Widespread white matter connectivity disruptions have commonly been reported in schizophrenia. However, it is questionable whether structural connectivity decline is specifically associated with schizophrenia or whether it extends along a continuum of psychosis into the healthy population. Elucidating brain structure changes associated with psychotic‐like experiences in healthy individuals is insofar important as it is a necessary first step towards our understanding of brain pathology preceding florid psychosis. High resolution, multishell diffusion‐weighted magnetic resonance images (MRI) were acquired from 89 healthy individuals. Whole‐brain white matter fibre tracking was performed to quantify the strength of white matter connections. Network‐based statistics were applied to white matter connections in a regression model in order to test for a linear relationship between streamline count and psychotic‐like experiences. A significant subnetwork was identified whereby streamline count declined with increasing psychotic‐like experiences. This network of structural connectivity reductions affected all cortical lobes, subcortical structures and the cerebellum and spanned along prominent association and commissural white matter pathways. A widespread network of linearly declining connectivity strength with increasing number of psychotic‐like experiences was identified in healthy individuals. This finding is in line with white matter connectivity reductions reported from early to chronic stages of schizophrenia and might therefore aid the development of tools to identify individuals at risk of transitioning to psychosis.
Keywords: connectivity, continuum of psychosis, diffusion MRI, psychotic‐like experiences, structural connectome
1. INTRODUCTION
Schizophrenia has long been conceptualised as a disorder of dysconnectivity (Friston, 1998), whereby poorly integrated brain regions are thought to lead to impaired functioning and the development of psychotic symptoms such as hallucinations and delusions. Neuronal connections of the central nervous system, which constitute the human connectome, are highly interdependent and crucial for healthy brain functioning (Narr & Leaver, 2015). Dysconnectivity at any level of these networks may impact on other networks and affect behaviour and cognition in such a way that disorders like schizophrenia manifest (Narr & Leaver, 2015). In support of this contention, a multitude of studies have reported abnormal functional, structural and effective connectivity in patients with schizophrenia (Pettersson‐Yeo, Allen, Benetti, McGuire, & Mechelli, 2011).
Diffusion‐weighted imaging (DWI) studies using region‐of‐interest (ROI) approaches have reported heterogeneous findings of localised white matter disruptions in schizophrenia (Parnanzone et al., 2017). In recent years, brain connectivity studies have benefited from advances in neuroimaging connectomics (Fornito, Zalesky, Pantelis, & Bullmore, 2012), which enables the mapping of large‐scale structural and functional brain networks across the brain without the requirement for a‐priori hypotheses about affected ROIs (Sporns, 2011). Structural connectomics studies suggest that white matter pathology in schizophrenia is more widespread than previously reported in studies using ROI approaches, affecting all cerebral lobes, the cerebellum and encompassing most of the brain's white matter (Di Biase et al., 2017; Klauser et al., 2017; Van den Heuvel, Mandl, Stam, Kahn, & Hulshoff Pol, 2010; Zalesky et al., 2011).
Confounding variables such as medication, hospitalisation, deterioration of cognitive functioning and comorbidities like substance abuse further complicate the interpretation of white matter changes observed in schizophrenia (Frith, 1992), as they render it impossible to decipher which white matter changes are due to the illness itself. A study investigating 22q11 deletion syndrome, which is a genetic risk factor for schizophrenia, reported reduced network coherence, while other graph indices were preserved, which indicates that disruptions in certain white matter networks are associated with a genetic vulnerability for schizophrenia (Ottet et al., 2013). Collin, Kahn, de Reus, Cahn, and van den Heuvel (2014) reported reduced rich club connectivity in unaffected siblings of patients with schizophrenia that resemble findings in schizophrenia patients, suggesting a familial vulnerability for schizophrenia (Collin et al., 2014). Lastly, Di Biase et al. (2017) reported a significant linear decline of white matter connectivity strength from early to chronic stages of schizophrenia, indicating that white matter pathology deteriorates with illness duration.
To date, only one study investigated structural connectome changes in healthy individuals with psychotic‐like experiences (i.e., sub‐clinical psychotic symptoms in the general population) (Drakesmith et al., 2015). The study did not observe any significant brain networks with reduced connectivity strength between groups of individuals with high and low quantities of psychotic experiences. However, the topology measures global and local efficiency as well as global density were found to be significantly reduced in healthy individuals with a high quantity of psychotic‐like experiences. These findings were interpreted to indicate that white matter changes in healthy individuals with psychotic‐like experiences are subtle but detectable when examining network topology (Drakesmith et al., 2015). This is insofar important as prodromal psychotic‐like experiences have been implicated in the development of florid psychosis (Kelleher & Cannon, 2011; Poulton et al., 2000) and may therefore help to identify individuals at high‐risk for developing psychosis, who might benefit from prophylactic treatments.
The study by Drakesmith et al. (2015) used the psychotic‐like symptoms semi‐structured interview, which only assesses the positive symptoms hallucinations, delusions and bizarre symptoms (Horwood et al., 2008). However, individuals at risk for developing psychosis also possess various other sub‐clinical symptoms, such as depression, negative symptoms and distress (Yung et al., 2007). The present study therefore set out to investigate the structural connectome in healthy individuals with psychotic‐like experiences as measured by the prodromal questionnaire, which assesses a wide variety of pre‐clinical psychosis symptoms (Loewy, Bearden, Johnson, Raine, & Cannon, 2005). It was hypothesised that as the number of psychotic‐like experiences increases, white matter connectivity strength decreases, similar to previously reported findings of declining connectivity strength with illness duration in schizophrenia (Di Biase et al., 2017).
2. MATERIALS AND METHODS
2.1. Participants
Eighty‐nine healthy participants were recruited through the online recruitment system SONA and the weekly electronic newsletter UQ Update, which is distributed to staff and alumni at the University of Queensland, Australia. This study was approved by the University of Queensland Research Ethics Committee. All participants gave written informed consent and were monetarily reimbursed for their time. Participants ranged in age from 18 to 63 years (M = 24.69, SD = 10.13), 92.1% (n = 82) reported to be right‐handed and 51% (n = 57.3) were female. In order to avoid potential effects of cognitive deficits on connectivity strength, participants with an IQ < 80 and individuals who were not able to converse fluently in English were excluded from the study. All participants completed the prodromal questionnaire (PQ), which is a 92‐item self‐report measure for prodromal psychotic symptoms (Loewy et al., 2005) and includes items assessing depressive, positive and negative symptoms as well as distress. All items are rated on a scale from 0 to 5, whereby 0 = never, 1 = 1–2 times, 3 = once per week, 4 = few times per week and 5 = daily. Each question is followed‐up with a question asking whether the experience has been distressing (yes/no).
2.2. Data acquisition
T1‐weighted magnetic resonance imaging (MRI) scans were acquired on a Siemens Trio 3T system (Erlangen, Germany) with the magnetisation‐prepared two rapid acquisition gradient echo (MP2RAGE) sequence (Marques et al., 2010) with field of view (FoV) 240 mm, 176 slices, 0.9 mm isotropic resolution, TR = 4,000 ms, TE = 2.92 ms, TI1 = 700 ms, TI2 = 2,220 ms, first flip angle = 6°, second flip angle = 7° and 5 min acquisition time. Two diffusion‐weighted (DW) image series were acquired using an echo‐planar imaging (EPI) sequence. The first DW image series was acquired with the following parameters: FoV 220 mm, phase partial Fourier (PPF) 6/8, parallel acceleration factor 2, 55 slices, 2 mm isotropic resolution, 32 diffusion‐sensitization directions at b = 1,000 s/mm2 and one b = 0 volume, TR = 8,600 ms, TE = 116 ms and 5 min acquisition time. The second DW image series had a FoV of 220 mm, PPF 6/8, parallel acceleration factor 2, 55 slices, 2 mm isotropic resolution, 64 diffusion‐sensitization directions at b = 3,000 s/mm2 and two b = 0 volumes, TR = 8,600 ms, TE = 116 ms and 10 min acquisition time. Three additional b = 0 images were acquired interspersed between the DW image series, with reversal of the acquisition direction along the phase‐encoded axis for one of the three images and acquisition time of 30 ms each.
2.3. Pre‐processing and connectome generation
Figure 1 summarises the analysis workflow. FreeSurfer (v6.0) (http://surfer.nmr.mgh.harvard.edu/) was used for the segmentation of T1‐weighted images as described previously (Dale, Fischl, & Sereno, 1999). In short, a two‐dimensional cortical surface was computed and automatically divided into grey‐matter areas for each hemisphere. Subcortical areas were also automatically parcellated based on probabilistic estimation of subcortical structure location (Fischl et al., 2004). Segmentations and anatomical labelling were based on the Desikan–Killiany atlas (84 nodes) (Desikan et al., 2006) and validated by manual inspection. In order to assess result consistency across node size and parcellation atlas, all analyses were repeated with the Destrieux cortical segmentation atlas (164 nodes) (Destrieux, Fischl, Dale, & Halgren, 2010). All cortical and subcortical structures were used to generate the connectivity matrix.
Figure 1.
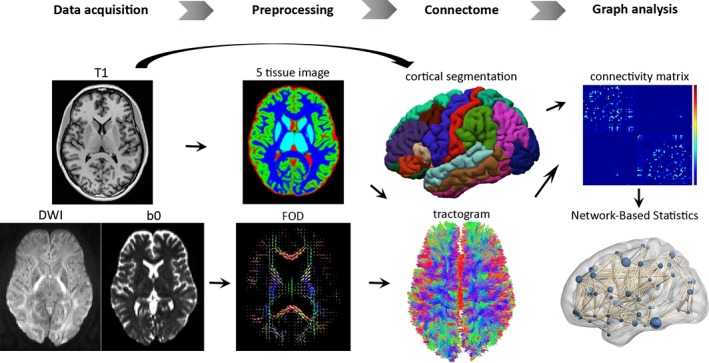
Flowchart of the steps involved in the structural connectome analysis. The T1‐weighted image and diffusion weighted image (DWI) were co‐registered, from which a five‐tissue‐type segmented image was generated. Multi‐shell, multi‐tissue response functions were estimated and multi‐tissue constrained spherical deconvolution was applied to obtain fibre orientation distributions (FOD). Cortical segmentation was used to define 84 structural nodes and individual tractograms were generated for each participant using anatomically constrained tractography. Separate connectivity matrices were populated with the streamline count between the corresponding pairs of nodes, as well as fractional anisotropy (FA) estimates averaged over all voxels traversed by streamlines between node pairs. Network‐based statistics were used to test for local white matter connectivity effects
DW images were corrected for eddy current distortions and head movements using the FSL TOPUP (Smith et al., 2004) and EDDY (Andersson & Sotiropoulos, 2016) commands and signal intensity inhomogeneities were removed (Zhang, Brady, & Smith, 2001). The remaining processing steps were conducted in the MRtrix3 toolbox (Tournier, Calamante, & Connelly, 2012). T1‐ and DW‐weighted images were co‐registered using boundary‐based registration (Greve & Fischl, 2009). A five‐tissue‐type segmented image (cortical grey matter, white matter, sub‐cortical grey matter, cerebrospinal fluid, pathological tissue) was generated from the structural images pre‐processed with the recon‐all command in FreeSurfer (Dale et al., 1999). Response functions were estimated using the multi‐shell, multitissue algorithm implemented in MRtrix3 (Jeurissen, Tournier, Dhollander, Connelly, & Sijbers, 2014). Multi‐tissue constrained spherical deconvolution was applied to obtain fibre orientation distributions (Jeurissen et al., 2014). Eighty‐four structural connectome nodes were defined using the Desikan–Killiany cortical segmentation atlas (Desikan et al., 2006). Individual tractograms were generated for each participant using anatomically constrained tractography (Smith, Tournier, Calamante, & Connelly, 2012) with the second order integration over Fibre Orientation Distribution (iFOD2) algorithm (Tournier et al., 2012). Tractograms were generated until 100 million streamlines were obtained with a length of 5–250 mm, step size of 1 mm and FOD amplitude threshold of 0.1. The spherical‐deconvolution informed filtering of tractograms (SIFT) algorithm was applied to reduce the overall streamline count to 10 million streamlines, which are more biologically meaningful (Smith, Tournier, Calamante, & Connelly, 2013). To generate individual connectivity matrices, the streamlines from the tractograms were then mapped onto the nodes of each participants’ parcellation image, which was generated from the anatomical (T1‐weighted) images. Separate connectivity matrices were populated with the streamline count between the corresponding pairs of nodes, as well as fractional anisotropy (FA) estimates averaged over all voxels traversed by streamlines between node pairs.
2.4. Statistical analysis
Network‐based statistics (NBS) was used to investigate a putative linear relationship between PQ scores and white matter connectivity strength (Zalesky, Fornito, & Bullmore, 2010). For this purpose, two multiple linear regressions were employed with PQ scores as the predictor variable and the interregional connectivity matrices for streamline count and FA as outcome variables. Distress was added to the regression models as a nuisance covariate. Due to the association of age, intelligence and lifestyle factors such as illicit drug use with connectivity strength, these variables were also added as nuisance covariates to the regression model. Test statistics were computed independently for each connection. Supra‐threshold connections were considered if their test‐statistic exceeded a p‐value of .001 with 5,000 permutations (t‐statistic >3). More conservative test‐statistic supra‐thresholds of 3.5 (p < .0005) and 4 (p < .0001) were also used in order to assess result consistency. Cross‐validations were performed across five sub‐samples of 60 individuals, drawn without replacement from the total sample of 89 participants. Subnetworks (connected components) were then identified with a family‐wise error (FWE)‐corrected p‐value of .05. Connections with a connectivity strength of zero across all subjects were excluded from analyses to avoid spurious connections, which resulted in a network density of approximately 10%.
3. RESULTS
Participants' scores on the PQ ranged between 0 and 162 (M = 49.34, SD = 43.99), distress between 0 and 48 (M = 11.59, SD = 13.35), age between 18 and 63 years (M = 24.69, SD = 10.13), full‐scale IQ between 87 and 127 (M = 110.64, SD = 8.512) and 8.3% (74/89) of participants reported illicit drug use.
3.1. Connectivity disruptions
NBS identified a subnetwork of reducing streamline count with increasing PQ score (p = .041, FWE) (see Figure 2a). The network comprised 55 brain regions and 88 edges. Most connectivity changes were identified between inter‐hemispheric regions (62.5%, n = 55) and in the right (29.5%, n = 26) more so than the left (8%, n = 7) hemisphere (see Figure 2b). These findings indicate that inter‐regional connectivity strength declines with increasing quantity of psychotic‐like experiences. The identified network affected all cortical lobes, subcortical structures and the cerebellum. Significantly declining connectivity strength was observed in the corpus callosum, the bilateral superior longitudinal fasciculus, inferior longitudinal fasciculus, as well as the mid‐anterior and mid‐posterior parts of the cingulum bundles. In the right hemisphere, connectivity reductions were localised to the inferior occipito‐frontal fasciculus, corona radiata, and the uncinate fasciculus. Figure 2c shows a significant linear decline of mean streamline count in the identified subnetwork with increasing PQ scores (r = −.225, p = .034), indicating that psychotic‐like experiences increase as white matter connectivity decreases.
Figure 2.
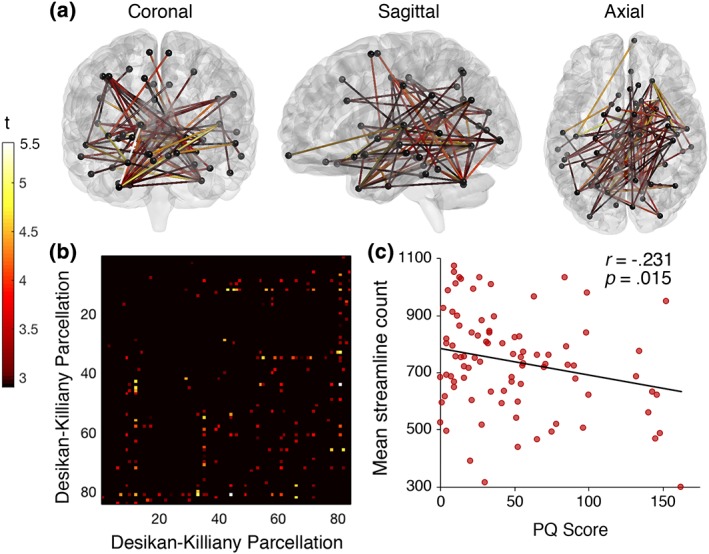
T‐statistic is set to a supra‐threshold of 3, which corresponds to p = .001. Subnetwork is significant at p FWE = < .05. (a) Widespread network of linearly declining streamline count with increasing number of prodromal psychotic‐like experiences in healthy individuals. The network comprised 55 nodes and 88 edges. (b) Connectivity matrix according to brain regions (seed region) from the Desikan–Killiany atlas (Supporting Information Table S1). (c) Mean streamline count declines linearly with increasing PQ scores, indicating white matter connectivity loss with increasing psychotic‐like experiences [Color figure can be viewed at http://wileyonlinelibrary.com]
Using parcellations from the Destrieux atlas (Destrieux et al., 2010), NBS identified a network of reducing streamline count with increasing PQ scores (p = .024, FWE). The network included 131 brain regions and 340 edges. Most connectivity reductions were again identified between inter‐hemispheric regions (51%, n = 173) and in the right (30%, n = 101) more so than the left (19%, n = 66) hemisphere. The identified network affected similar brain regions to those identified by using parcellations from the Desikan–Killiany atlas, spanning across all cortical lobes, subcortical structures and the cerebellum (see Figure 3). Significantly declining connectivity strength was observed in all white matter pathways previously identified by parcellations from the Desikan–Killiany atlas in addition to the left inferior occipito‐frontal fasciculus and uncinate fasciculus. The replication with a different parcellation atlas suggests that the findings are robust to the choice and size of nodes.
Figure 3.
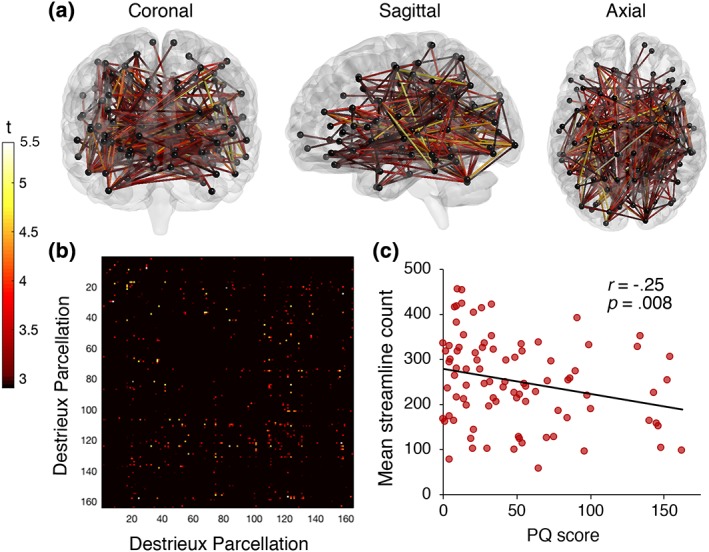
T‐statistic is set to a supra‐threshold of 3, which corresponds to p = .001. Subnetwork is significant at p FWE = < .05. (a) Widespread network of linearly declining streamline count with increasing number of prodromal psychotic‐like experiences in healthy individuals. The network comprised 131 nodes and 340 edges. (b) Connectivity matrix according to brain regions (seed region) from the Destrieux atlas (Supporting Information Table S2). (c) Mean streamline count declines linearly with increasing PQ scores, indicating white matter connectivity loss with increasing psychotic‐like experiences [Color figure can be viewed at http://wileyonlinelibrary.com]
Networks of significant connectivity reductions with increasing PQ scores were identified across several supra‐thresholds (p < .001; p < .0005; p < .0001) with parcellations from both atlases, consistently affecting the same areas across all cortical lobes and subcortical structures, the right superior longitudinal fasciculus and the posterior part of the corpus callosum (see Figure 4). While effects at more liberal supra‐thresholds (i.e., p < .001) are likely to be subtle but topologically extended, the effects we observed across all thresholds (p < .001; p < .0005; p < .0001) are additionally characterised by strong, topologically focal differences. The correlation strengths between PQ score and mean streamline count of the identified networks were similar across parcellation and threshold validation.
Figure 4.
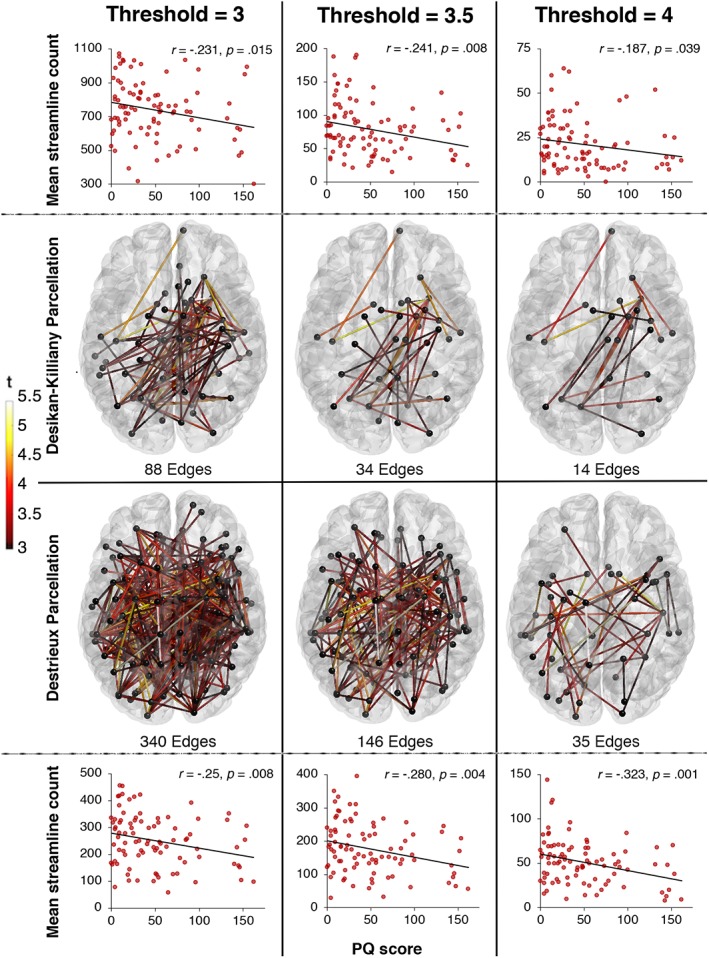
Networks of reducing connectivity strength with increasing PQ scores using parcellations from the Desikan–Killiany (top) and Destrieux (bottom) atlases across t‐statistic supra‐thresholds of 3, 3.5 and 4. Connection colour reflects t‐statistic magnitude, ranging from red (3 left, 3.5 middle, 4 right) to yellow (5.5). Scatterplots represent the correlations between mean streamline count of the identified network and PQ scores. Scatterplots represent the correlations between mean streamline count of the identified network and PQ scores [Color figure can be viewed at http://wileyonlinelibrary.com]
The network of widespread declining streamline count with increasing PQ scores identified in the full sample (n = 89) were also replicated for five randomly sampled sub‐samples of 60 individuals (see Figure 5). All resulting weighted connectivity matrices derived from the sub‐samples significantly correlated with the weighted connectivity matrix generated from the full sample with p < .001, which further underscores the robustness of our findings (see Figure 5). While the correlation strength between PQ score and mean streamline count of the identified networks were similar across validations, validation 2 and 3 did not reach significance.
Figure 5.
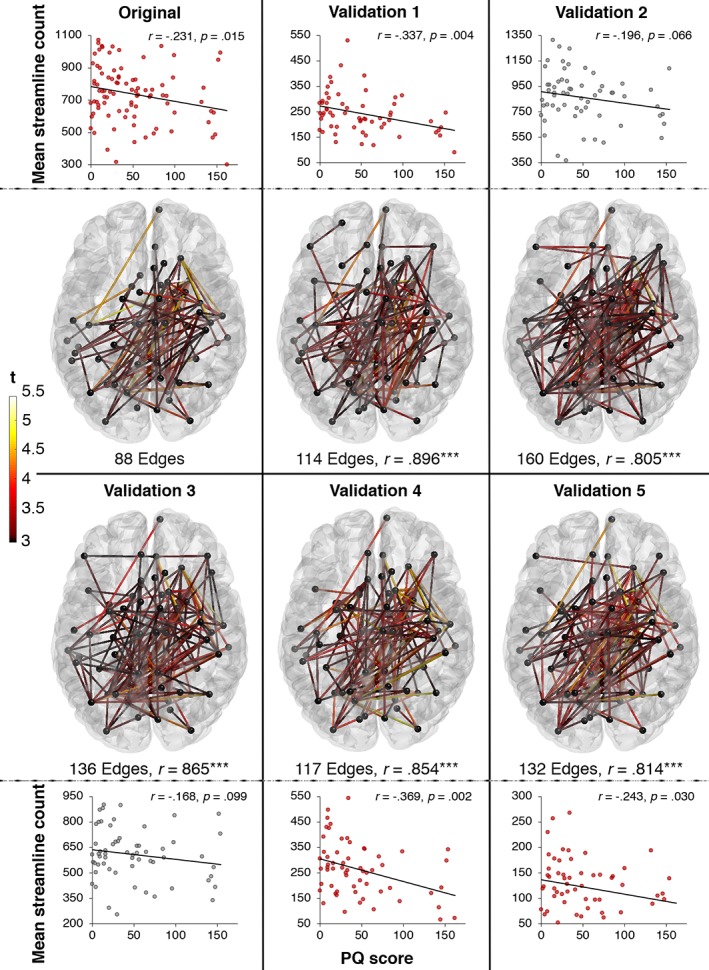
Cross‐validation of reducing streamline count with increasing PQ scores across five sub‐samples (validation 1–5). The robustness of the association between streamline count and PQ scores was verified by replicating significant networks in five randomly chosen sub‐samples of 60 individuals. r below the network maps denotes the correlation coefficient between the weighted connectivity matrices derived from the sub‐samples (validations 1–5) and the weighted connectivity matrix generated from the full sample (original). Connection colour reflects t‐statistic magnitude, ranging from red (3) to yellow (5.5). Scatterplots represent the correlations between mean streamline count of the identified network and PQ scores [Color figure can be viewed at http://wileyonlinelibrary.com]
No significant subnetworks of reduced streamline count were observed for decreasing PQ scores, nor did we find reduced FA with increasing or decreasing PQ scores.
4. DISCUSSION
Studies of white matter pathology in schizophrenia are plentiful; however, the extent to which these changes translate to sub‐clinical manifestations of psychotic‐like experiences remains questionable. As predicted, the present study observed widespread linearly declining white matter connectivity strength with increasing psychotic‐like experiences in healthy individuals. In particular, we identified connectivity reductions in main association fibres such as the superior longitudinal fasciculus, inferior longitudinal fasciculus, cingulum bundle, corona radiata, inferior occipito‐frontal fasciculus and uncinate fasciculus as well as the corpus callosum. This is in line with findings from a study by Di Biase et al. (2017), which previously reported similar global connectivity reductions from early to chronic illness stages of schizophrenia in prominent white matter pathways such as the inferior longitudinal fasciculus, uncinate fasciculus, cingulum bundle corona radiata and the corpus callosum. Taken together, these findings indicate that psychotic‐like experiences may progress into pathological symptom expression with declining white matter connectivity.
A study by Drakesmith et al. (2015) also investigated the structural connectome in healthy individuals with a high quantity of psychotic‐like experiences but did not find any significant white matter network disruptions. The inconsistencies between the two studies might be explained by the fact that while the study by Drakesmith et al. (2015) investigated a group of heathly individuals with a high quantity of positive symptoms, the present study focuses on a more comprehensive set of prodromal psychotic‐like experiences, such as positive, negative and depressive symptoms as well as the distress associated with the experiences of these symptoms. It is therefore possible that the white matter connectivity loss in the network identified by the present study is associated with prodromal psychotic‐like experiences in general rather than pre‐clinical positive symptoms specifically.
Our finding of widespread white matter decline in healthy individuals with psychotic‐like experiences is in line with whole‐brain changes reported from post‐mortem, neuroimaging and histology studies in schizophrenia. Neuropathology studies report global reductions of neural density and a decrease of axons, dendrites and glia cells to be associated with schizophrenia (Boksa, 2012). These findings are supported by molecular studies, which report reductions in several presynaptic protein markers across the brain in patients with schizophrenia (Faludi & Mirnics, 2011). Post‐mortem studies have provided evidence that several neurotransmitter systems across the brain are abnormal in schizophrenia, including dopamine, serotonin, γ‐aminobutyric acid (GABA) and glutamate (Harrison, 2000). Furthermore, neuroimaging studies have reported widespread reduced cortical folding in patients with schizophrenia, which has been interpreted to reflect abnormal neural connectivity during brain maturation (Sallet et al., 2003). These findings, together with the findings from the present study, indicate that brain changes related to pre‐clinical psychotic experiences and schizophrenia are more widespread than initially anticipated and that whole‐brain approaches might be more suitable to study the pathophysiology of schizophrenia as opposed to ROI approaches.
While we replicated networks and correlation strengths across two parcellation schemes, varying thresholds and sub‐sampling validations, which underscores the robustness of our findings, the present study failed to observe an association between psychotic‐like experiences and fractional anisotropy. One potential explanation for this discrepancy is that the reconstructed streamlines are heavily dependent on morphometric measures such as fibre branching, length and curvature as well as tractography algorithms (Jones, Knosche, & Turner, 2013). Fractional anisotropy on the other hand is sensitive to microstructural tissue properties and depends on fibre density, diameter, myelination and membrane permeability (Fornito, Zalesky, & Bullmore, 2016). Therefore, even though the overall streamline count may be reducing with increasing number of psychotic‐like experiences, the remaining fibres may still be densely packed, well myelinated and coherently oriented. All of these factors contribute to a strong constrained of water molecules to diffuse along the axon, leading to an increase in fractional anisotropy. It is conceivable that the commonly reported fractional anisotropy reductions in schizophrenia studies represent a further step in the disease trajectory, such that initial streamline reductions are followed by a degeneration of the remaining fibres. This, however, is speculative at this stage and therefore represents, we suggest, a fruitful avenue for future research.
The age of onset for schizophrenia is usually in the early 20s for men and the late 20s to early 30s in women, with approximately 15–20% of patients experiencing late‐onset schizophrenia (defined as onset of symptoms after the age of 44) (Folsom et al., 2006). The mean age of the present sample was 24.69 years of age and only 7.9% of the participants in this sample are over 44 years of age. The present study therefore captures the entire age range at which pre‐clinical psychotic experiences may emerge. A limitation of this study is the inability to separately investigate positive, negative and depressive sub‐scales due to the fact that the prodromal questionnaire was not designed for this purpose. Future research may examine the individual contribution of these pre‐clinical symptom sets on connectivity strength by using scales such as the Structured Interview for Psychosis‐risk Syndromes (SIPS), which affords sub‐scale distinctions. Another limitation of the present study is the lack of a clinical schizophrenia group. A direct comparison of structural connectomics between healthy individuals with a high quantity of psychotic‐like experiences and schizophrenia patients would provide a better understanding of brain networks that might be particularly useful to investigate as potential prodromal psychosis biomarkers.
In sum, we identified a widespread network of white matter connections that declined in streamline count as psychotic‐like experiences in healthy individuals increased, similar to the white matter connectivity decline reported from early to chronic illness stages of schizophrenia (Di Biase et al., 2017). The disrupted network spanned over several cortical and subcortical brain regions and affected the majority of prominent commissural and association pathways. This is in line with findings from post‐mortem, neuroimaging and molecular studies of schizophrenia, which report pathological changes across the entire brain as opposed to circumscribed regions. The findings from this study indicate that widespread white matter connectivity reductions may help to identify individuals at high‐risk of transitioning to florid psychosis, who might benefit from prophylactic treatments.
CONFLICT OF INTERESTS
The authors declare that they have no conflicts of interest.
Supporting information
Table S1 Brain parcellation and labelling according to the Desikan‐Killiany atlas
Table S2. Brain parcellation and labelling according to the Destrieux atlas
ACKNOWLEDGMENTS
This work was funded by the Australian Research Council Centre of Excellence for Integrative Brain Function (ARC Centre Grant CE140100007), a University of Queensland Fellowship (2016000071), and a Foundation Research Excellence Award (2016001844) to MIG, as well as a University of Queensland International Research Scholarship to RR. The authors thank the participants for their time and Aiman Al‐Najjar and Nicole Atcheson for assisting with data collection.
Oestreich LKL, Randeniya R, Garrido MI. White matter connectivity reductions in the pre‐clinical continuum of psychosis: A connectome study. Hum Brain Mapp. 2019;40:529–537. 10.1002/hbm.24392
Funding information: Foundation Research Excellence Award, Grant/Award Number: 2016001844; University of Queensland Fellowship, Grant/Award Number: 2016000071; Australian Research Council Centre of Excellence for Integrative Brain Function, Grant/Award Number: CE140100007
REFERENCES
- Andersson, J. L. R. , & Sotiropoulos, S. N. (2016). An integrated approach to correction for off‐resonance effects and subject movement in diffusion MR imaging. NeuroImage, 125, 1063–1078. 10.1016/j.neuroimage.2015.10.019 [DOI] [PMC free article] [PubMed] [Google Scholar]
- Boksa, P. (2012). Abnormal synaptic pruning in schizophrenia: Urban myth or reality? Journal of Psychiatry & Neuroscience, 37(2), 75–77. 10.1503/jpn.120007 [DOI] [PMC free article] [PubMed] [Google Scholar]
- Collin, G. , Kahn, R. S. , de Reus, M. A. , Cahn, W. , & van den Heuvel, M. P. (2014). Impaired rich club connectivity in unaffected siblings of schizophrenia patients. Schizophrenia Bulletin, 40(2), 438–448. 10.1093/schbul/sbt162 [DOI] [PMC free article] [PubMed] [Google Scholar]
- Dale, A. M. , Fischl, B. , & Sereno, M. I. (1999). Cortical surface‐based analysis. I. Segmentation and surface reconstruction. NeuroImage, 9(2), 179–194. 10.1006/nimg.1998.0395 [DOI] [PubMed] [Google Scholar]
- Desikan, R. S. , Ségonne, F. , Fischl, B. , Quinn, B. T. , Dickerson, B. C. , Blacker, D. , … Killiany, R. J. (2006). An automated labeling system for subdividing the human cerebral cortex on MRI scans into gyral based regions of interest. NeuroImage, 31(3), 968–980. 10.1016/j.neuroimage.2006.01.021 [DOI] [PubMed] [Google Scholar]
- Destrieux, C. , Fischl, B. , Dale, A. , & Halgren, E. (2010). Automatic parcellation of human cortical gyri and sulci using standard anatomical nomenclature. NeuroImage, 53(1), 1–15. 10.1016/j.neuroimage.2010.06.010 [DOI] [PMC free article] [PubMed] [Google Scholar]
- Di Biase, M. A. , Cropley, V. L. , Baune, B. T. , Olver, J. , Amminger, G. P. , Phassouliotis, C. , … Zalesky, A. (2017). White matter connectivity disruptions in early and chronic schizophrenia. Psychological Medicine, 47, 1–14. 10.1017/s0033291717001313 [DOI] [PubMed] [Google Scholar]
- Drakesmith, M. , Caeyenberghs, K. , Dutt, A. , Zammit, S. , Evans, C. J. , Reichenberg, A. , … Jones, D. K. (2015). Schizophrenia‐like topological changes in the structural connectome of individuals with subclinical psychotic experiences. Human Brain Mapping, 36(7), 2629–2643. 10.1002/hbm.22796 [DOI] [PMC free article] [PubMed] [Google Scholar]
- Faludi, G. , & Mirnics, K. (2011). Synaptic changes in the brain of subjects with schizophrenia. International Journal of Developmental Neuroscience, 29(3), 305–309. 10.1016/j.ijdevneu.2011.02.013 [DOI] [PMC free article] [PubMed] [Google Scholar]
- Fischl, B. , van der Kouwe, A. , Destrieux, C. , Halgren, E. , Segonne, F. , Salat, D. H. , … Dale, A. M. (2004). Automatically parcellating the human cerebral cortex. Cerebral Cortex, 14(1), 11–22. [DOI] [PubMed] [Google Scholar]
- Folsom, D. P. , Lebowitz, B. D. , Lindamer, L. A. , Palmer, B. W. , Patterson, T. L. , & Jeste, D. V. (2006). Schizophrenia in late life: Emerging issues. Dialogues in Clinical Neuroscience, 8(1), 45–52. [DOI] [PMC free article] [PubMed] [Google Scholar]
- Fornito, A. , Zalesky, A. , & Bullmore, E. T. (2016). Fundamentals of brain network analysis (Vol. 1). New York, NY: Elsevier Academic Press. [Google Scholar]
- Fornito, A. , Zalesky, A. , Pantelis, C. , & Bullmore, E. T. (2012). Schizophrenia, neuroimaging and connectomics. NeuroImage, 62(4), 2296–2314. 10.1016/j.neuroimage.2011.12.090 [DOI] [PubMed] [Google Scholar]
- Friston, K. J. (1998). The disconnection hypothesis. Schizophrenia Research, 30(2), 115–125. 10.1016/S0920-9964(97)00140-0 [DOI] [PubMed] [Google Scholar]
- Frith, C. D. (1992). The cognitive neuropsychology of schizophrenia. Hove, UK: Lawrence Erlbaum Associates. [Google Scholar]
- Greve, D. N. , & Fischl, B. (2009). Accurate and robust brain image alignment using boundary‐based registration. NeuroImage, 48(1), 63–72. 10.1016/j.neuroimage.2009.06.060 [DOI] [PMC free article] [PubMed] [Google Scholar]
- Harrison, P. J. (2000). Postmortem studies in schizophrenia. Dialogues in Clinical Neuroscience, 2(4), 349–357. [DOI] [PMC free article] [PubMed] [Google Scholar]
- Horwood, J. , Salvi, G. , Thomas, K. , Duffy, L. , Gunnell, D. , Hollis, C. , … Harrison, G. (2008). IQ and non‐clinical psychotic symptoms in 12‐year‐olds: Results from the ALSPAC birth cohort. The British Journal of Psychiatry, 193(3), 185–191. 10.1192/bjp.bp.108.051904 [DOI] [PMC free article] [PubMed] [Google Scholar]
- Jeurissen, B. , Tournier, J.‐D. , Dhollander, T. , Connelly, A. , & Sijbers, J. (2014). Multi‐tissue constrained spherical deconvolution for improved analysis of multi‐shell diffusion MRI data. NeuroImage, 103, 411–426. 10.1016/j.neuroimage.2014.07.061 [DOI] [PubMed] [Google Scholar]
- Jones, D. K. , Knosche, T. R. , & Turner, R. (2013). White matter integrity, fiber count, and other fallacies: The do's and don'ts of diffusion MRI. NeuroImage, 73, 239–254. 10.1016/j.neuroimage.2012.06.081 [DOI] [PubMed] [Google Scholar]
- Kelleher, I. , & Cannon, M. (2011). Psychotic‐like experiences in the general population: Characterizing a high‐risk group for psychosis. Psychological Medicine, 41(1), 1–6. 10.1017/s0033291710001005 [DOI] [PubMed] [Google Scholar]
- Klauser, P. , Baker, S. T. , Cropley, V. L. , Bousman, C. , Fornito, A. , Cocchi, L. , … Zalesky, A. (2017). White matter disruptions in schizophrenia are spatially widespread and topologically converge on brain network hubs. Schizophrenia Bulletin, 43(2), 425–435. 10.1093/schbul/sbw100 [DOI] [PMC free article] [PubMed] [Google Scholar]
- Loewy, R. L. , Bearden, C. E. , Johnson, J. K. , Raine, A. , & Cannon, T. D. (2005). The prodromal questionnaire (PQ): Preliminary validation of a self‐report screening measure for prodromal and psychotic syndromes. Schizophrenia Research, 79(1), 117–125. 10.1016/j.schres.2005.03.007 [DOI] [PubMed] [Google Scholar]
- Marques, J. P. , Kober, T. , Krueger, G. , van der Zwaag, W. , Van de Moortele, P.‐F. , & Gruetter, R. (2010). MP2RAGE, a self bias‐field corrected sequence for improved segmentation and T1‐mapping at high field. NeuroImage, 49(2), 1271–1281. 10.1016/j.neuroimage.2009.10.002 [DOI] [PubMed] [Google Scholar]
- Narr, K. L. , & Leaver, A. M. (2015). Connectome and schizophrenia. Current Opinion in Psychiatry, 28(3), 229–235. 10.1097/yco.0000000000000157 [DOI] [PubMed] [Google Scholar]
- Ottet, M. C. , Schaer, M. , Debbane, M. , Cammoun, L. , Thiran, J. P. , & Eliez, S. (2013). Graph theory reveals dysconnected hubs in 22q11DS and altered nodal efficiency in patients with hallucinations. Frontiers in Human Neuroscience, 7, 402 10.3389/fnhum.2013.00402 [DOI] [PMC free article] [PubMed] [Google Scholar]
- Parnanzone, S. , Serrone, D. , Rossetti, M. C. , D'Onofrio, S. , Splendiani, A. , Micelli, V. , … Pacitti, F. (2017). Alterations of cerebral white matter structure in psychosis and their clinical correlations: A systematic review of diffusion tensor imaging studies. Rivista di Psichiatria, 52(2), 49–66. 10.1708/2679.27441 [DOI] [PubMed] [Google Scholar]
- Pettersson‐Yeo, W. , Allen, P. , Benetti, S. , McGuire, P. , & Mechelli, A. (2011). Dysconnectivity in schizophrenia: Where are we now? Neuroscience & Biobehavioral Reviews, 35(5), 1110–1124. 10.1016/j.neubiorev.2010.11.004 [DOI] [PubMed] [Google Scholar]
- Poulton, R. , Caspi, A. , Moffitt, T. E. , Cannon, M. , Murray, R. , & Harrington, H. (2000). Children's self‐reported psychotic symptoms and adult schizophreniform disorder: A 15‐year longitudinal study. Archives of General Psychiatry, 57(11), 1053–1058. [DOI] [PubMed] [Google Scholar]
- Sallet, P. C. , Elkis, H. , Alves, T. M. , Oliveira, J. R. , Sassi, E. , de Castro, C. C. , … Gattaz, W. F. (2003). Reduced cortical folding in schizophrenia: An MRI morphometric study. American Journal of Psychiatry, 160(9), 1606–1613. 10.1176/appi.ajp.160.9.1606 [DOI] [PubMed] [Google Scholar]
- Smith, R. E. , Tournier, J.‐D. , Calamante, F. , & Connelly, A. (2012). Anatomically‐constrained tractography: Improved diffusion MRI streamlines tractography through effective use of anatomical information. NeuroImage, 62(3), 1924–1938. [DOI] [PubMed] [Google Scholar]
- Smith, R. E. , Tournier, J. D. , Calamante, F. , & Connelly, A. (2013). SIFT: Spherical‐deconvolution informed filtering of tractograms. NeuroImage, 67, 298–312. 10.1016/j.neuroimage.2012.11.049 [DOI] [PubMed] [Google Scholar]
- Smith, S. , Jenkinson, M. , Woolrich, M. W. , Beckmann, C. F. , Behrens, T. E. J. , Johansen‐Berg, H. , … Matthews, P. M. (2004). Advances in functional and structural MR image analysis and implementation as FSL. NeuroImage, 23, S208–S219. 10.1016/j.neuroimage.2004.07.051 [DOI] [PubMed] [Google Scholar]
- Sporns, O. (2011). The human connectome: A complex network. Annals of the New York Academy of Sciences, 1224, 109–125. 10.1111/j.1749-6632.2010.05888.x [DOI] [PubMed] [Google Scholar]
- Tournier, J. D. , Calamante, F. , & Connelly, A. (2012). MRtrix: Diffusion tractography in crossing fiber regions. International Journal of Imaging Systems and Technology, 22(1), 53–66. 10.1002/ima.22005 [DOI] [Google Scholar]
- Van den Heuvel, M. P. , Mandl, R. C. , Stam, C. J. , Kahn, R. S. , & Hulshoff Pol, H. E. (2010). Aberrant frontal and temporal complex network structure in schizophrenia: A graph theoretical analysis. The Journal of Neuroscience, 30(47), 15915–15926. 10.1523/jneurosci.2874-10.2010 [DOI] [PMC free article] [PubMed] [Google Scholar]
- Yung, A. R. , McGorry, P. D. , Francey, S. M. , Nelson, B. , Baker, K. , Phillips, L. J. , … Amminger, G. P. (2007). PACE: A specialised service for young people at risk of psychotic disorders. The Medical Journal of Australia, 187(7 Suppl), S43–S46. [DOI] [PubMed] [Google Scholar]
- Zalesky, A. , Fornito, A. , & Bullmore, E. T. (2010). Network‐based statistic: Identifying differences in brain networks. NeuroImage, 53(4), 1197–1207. 10.1016/j.neuroimage.2010.06.041 [DOI] [PubMed] [Google Scholar]
- Zalesky, A. , Fornito, A. , Seal, M. L. , Cocchi, L. , Westin, C.‐F. , Bullmore, E. T. , … Pantelis, C. (2011). Disrupted axonal fiber connectivity in schizophrenia. Biological Psychiatry, 69(1), 80–89. 10.1016/j.biopsych.2010.08.022 [DOI] [PMC free article] [PubMed] [Google Scholar]
- Zhang, Y. , Brady, M. , & Smith, S. (2001). Segmentation of brain MR images through a hidden Markov random field model and the expectation‐maximization algorithm. IEEE Transactions on Medical Imaging, 20(1), 45–57. 10.1109/42.906424 [DOI] [PubMed] [Google Scholar]
Associated Data
This section collects any data citations, data availability statements, or supplementary materials included in this article.
Supplementary Materials
Table S1 Brain parcellation and labelling according to the Desikan‐Killiany atlas
Table S2. Brain parcellation and labelling according to the Destrieux atlas