

Abstract
It has been proposed that autism spectrum disorder (ASD) may be characterized by an extreme male brain (EMB) pattern of brain development. Here, we performed the first investigation of how age‐related changes in functional brain connectivity may be expressed differently in females and males with ASD. We analyzed resting‐state functional magnetic resonance imaging data of 107 typically developing (TD) females, 114 TD males, 104 females, and 115 males with ASD (6–26 years) from the autism brain imaging data exchange repository. We explored how interhemispheric homotopic connectivity and its maturational curvatures change across groups. Differences between ASD and TD and between females and males with ASD were observed for the rate of changes in connectivity in the absence of overall differences in connectivity. The largest portion of variance in age‐related changes in connectivity was described through similarities between TD males, ASD males, and ASD females, in contrast to TD females. We found that shape of developmental curvature is associated with symptomatology in both males and females with ASD. We demonstrated that females and males with ASD tended to follow the male pattern of developmental changes in interhemispheric connectivity, supporting the EMB theory of ASD.
Keywords: autism, developmental trajectories, homotopic interhemispheric connectivity, sex differences
1. INTRODUCTION
Autism spectrum disorder (ASD) is a neurodevelopmental disorder which is diagnosed behaviorally based on deficits in social communication and restricted and repetitive behaviors and interests (APA, 2013). ASD has a heterogeneous genetic basis (Muhle, Trentacoste, & Rapin, 2004), and lacks clear objective biomarkers. Altered connectivity between brain areas is increasingly understood to be a characteristic feature of ASD (Geschwind & Levitt, 2007). There is considerable evidence that brain connectivity in ASD is associated with cognitive and affective alterations in this group (Hull, Jacokes, Torgerson, Irimia, & Van Horn, 2017; O'Reilly, Lewis, & Elsabbagh, 2017; Picci, Gotts, & Scherf, 2016; Rane et al., 2015). Both functional overconnectivity and underconnectivity, as well as normal levels of connectivity have been reported in ASD population (Cerliani et al., 2015; Cheng, Rolls, Gu, Zhang, & Feng, 2015; Di Martino et al., 2014; Monk et al., 2009; Vissers, Cohen, & Geurts, 2012). However, due to a significant number of contradictory findings, it has been argued that alterations in connectivity strength do not consistently explain ASD pathogenesis (Picci et al., 2016).
A number of recent studies have also indicated that rather than being overconnected or underconnected per se, atypical brain development in individuals with ASD can be characterized by an altered developmental trajectory of brain rhythms and connectivity (Uddin, Supekar, & Menon, 2013). Atypical maturational trajectories in ASD have been described in studies on brain connectivity estimated from functional magnetic resonance imaging (fMRI) (Dajani & Uddin, 2016; Nomi & Uddin, 2015). Also, a recent study based on neurophysiological recordings has reported complex spatial–temporal profiles of age‐related changes in neuromagnetic rhythms and spontaneous network synchrony in ASD, whereas no overall group differences were observed (Vakorin et al., 2017). Similar findings were reported using other imaging modalities and their derivatives, such as cortical thickness and brain volume estimated from structural MRI (Ecker, Bookheimer, & Murphy, 2015). A particularly promising recent study showed that the rate of change in infants' brain volume and surface areas was sensitive enough to predict ASD in the brains of individual participants using machine learning tools (Hazlett et al., 2017).
There is compelling evidence emerging that altered maturational trajectories in brain structure as well as functional network connectivity are hallmarks of ASD. However, whether atypical maturation of structural and functional features of the brain are expressed differently in males and females with ASD remains poorly understood. The prevalence of ASD is significantly greater in males (Werling & Geschwind, 2013). Epidemiological studies on ASD report the ratio of males to females to be between 1.9 and 16 males diagnosed for every female (Fombonne, 2003; Fombonne, 2005; Fombonne, 2009). This suggests that the female brain may have protective features, or conversely that the male brain may confer heightened vulnerability, or that ASD may manifest differently in the female brain (Lai et al., 2017). Our study aims to investigate sex‐related and clinical group differences in functional connectivity in ASD and typically developing (TD) populations under the framework of developmental trajectories. The autism brain imaging data exchange (ABIDE), a large repository of both structural and functional MRI data for ASD research, allowed us to form a large pool of both males and females for ASD and TD populations (Di Martino et al., 2014).
Our study tested the hypotheses that males and females with ASD would show distinct alterations in developmental trajectories of functional connectivity. Specifically, we focused on interhemispheric homotopic connectivity, and investigated voxel‐mirrored homotopic connectivity (VMHC) which reflects the similarity between fMRI time series of two symmetrical voxels in the right and left hemispheres. This measure previously was shown to have a potential to distinguish various neurological and neuropsychiatric populations, including ASD (Anderson et al., 2010; Hahamy, Behrmann, & Malach, 2015), schizophrenia (Lang et al., 2016), depression (Hou et al., 2016), Parkinson's disease (Zhu et al., 2016), Alzheimer's disease (Wang et al., 2015), amyotrophic lateral sclerosis (Zhang et al., 2016), and stroke (Yang et al., 2016). In addition, it has been reported to change throughout the lifespan in typical brains (Zuo et al., 2010). Another rational to explore interhemispheric connectivity was the evidence of great impact of sex hormones in brain lateralization, which makes VMHC particularly interesting to explore in terms of sex differences (Nguyen et al., 2012).
We studied age‐related changes in VMHC in 115 males and 104 females with ASD, 114 TD males, and 107 TD females, selected from the ABIDE database and aged between 6 and 26 years old. Using a data‐driven approach, we applied a multivariate technique to decompose the entire data into latent variables (LVs), each associated with a group contrast and z‐scores of how this contrast is expressed across specific brain regions. We found no overall group differences for VMHC. However, we observed significant differences between the groups in terms of the rate of age‐related changes in VMHC.
2. METHODS
2.1. Cross‐sectional participants
Structural and resting‐state fMRI data were provided by the ABIDE I and II releases initiative, which combines data across multiple centers (Di Martino et al., 2014).
First, to investigate sex differences in interhemispheric homotopic connectivity in ASD, we created four cross‐sectional groups of subjects: 104 females with ASD, 115 males with ASD, 114 TD males, and 107 TD females. Detailed phenotypic information is provided in Table 1 (due to limited phenotypic data available on ABIDEs I and II, not all the subjects included to this study had intelligence quotient (IQ) and Autism Diagnostic Observation Schedule (ADOS) measurements which we admit being a limitation of this study).
Table 1.
Characteristics of the participants
| Group characteristic | TD | ASD | ||
|---|---|---|---|---|
| Males | Females | Males | Females | |
| Number of subjects | 114 | 107 | 115 | 104 |
| Age (mean ± SD) | 12.9 ± 4.04 | 12.7 ± 4.16 | 13.0 ± 3.76 | 12.8 ± 4.31 |
| Full IQ (mean ± SD) | 110.7 ± 11.87 (98 subjects) | 113.5 ± 14.89 (93 subjects) | 104.8 ± 19.22a (101 subjects) | 105.2 ± 17.45b (92 subjects) |
| Verbal IQ (mean ± SD) | 112.4 ± 12.20 (79 subjects) | 113.7 ± 16.47 (75 subjects) | 105.8 ± 21.13a (83 subjects) | 104.4 ± 17.17b (79 subjects) |
| Performance IQ (mean ± SD) | 107.4 ± 12.87 (88 subjects) | 108.9 ± 19.93 (84 subjects) | 104.9 ± 18.7 (89 subjects) | 101.4 ± 18.09b (83 subjects) |
| ADOS total (mean ± SD) | 12.0 ± 4.25 (56 subjects) | 11.6 ± 3.66 (54 subjects) | ||
| ADOS communication (mean ± SD) | 3.7 ± 1.69 (56 subjects) | 3.5 ± 1.48 (54 subjects) | ||
| ADOS social interaction (mean ± SD) | 8.0 ± 3.08 (56 subjects) | 7.7 ± 2.32 (54 subjects) | ||
| Framewise displacement (mean ± SD) | 0.11 ± 0.107 | 0.12 ± 0.097 | 0.13 ± 0.121 | 0.12 ± 0.127 |
ADOS = Autism Diagnostic Observation Schedule, ASD = autistic spectrum disorder, TD = typical development.
There were no significant differences between males and females within the same diagnostic group.
Significant differences between ASD groups and TD groups of the same sex.
Significant differences between ASD groups and TD groups of the same sex which survived Bonferroni correction.
Due to limited number of female participants, we formed the female groups first. With the preponderance of males in ASD studies, and to alleviate a possible bias due to unbalanced sample sizes, we took a random subsample of male subjects from the larger TD and ASD cohorts of males, under the condition that all four below‐mentioned inclusion criteria were satisfied. There were no significant group differences in age in the final sample, as confirmed by six two‐sample t tests comparing all four groups on a pair‐wise basis. Our inclusion criteria were: (a) participants between 6 and 26 years of age (considering our research question we aimed for the widest age range as possible). As the number of participants available on ABIDEs I and II drops considerably after 30 years, we initially defined the age range 6–30 years, which was adjusted after preprocessing procedures to 6–26 years); (b) similar number of selected subjects for all four groups per center and total number of selected subjects per center more than 10 (please see Table S1, Supporting Information); (c) acceptable quality of structural MRI scans based on visual inspection; and (d) successful preprocessing using the Configurable Pipeline for the Analysis of Connectomes (C‐PAC; see Section 2.3).
2.2. Longitudinal participants
With the primary goal of investigating potential abnormalities of developmental trajectories of interhemispheric homotopic connectivity in ASD, we also analyzed longitudinal data available through the ABIDE II release, wherein subjects were scanned twice with an interval varying between 1 and 4 years. We applied the same inclusion criteria, as in the case of the cross‐sectional data, and generated two age‐ and sex‐matched groups of participants (aged between 9 and 18 when the first scan was obtained): n = 19 for ASD (16 males and 3 females, mean 12.5 ± 2.3 year of age) and n = 13 for TD (11 males and 2 females, mean 13.5 ± 1.8 year of age). Two‐sample t‐tests found no significant group differences in age, wherein age was determined either by the first scan or the second one or both.
2.3. Data acquisition and preprocessing
Data acquisition parameters varied across sites. Detailed descriptions of the scan parameters and site‐specific protocols are available at http://fcon_1000.projects.nitrc.org/indi/abide/. All data were preprocessed using the C‐PAC (Craddock et al., 2013). Preprocessing steps included the removing of the first four volumes to ensure magnetic stability was reached. All volume slices were time corrected and head motion was regressed on 24 parameters (Friston, Williams, Howard, Frackowiak, & Turner, 1996). Sources of spurious signal were removed, regressing out the global, linear, motion and quadratic signals, CompCor was applied calculating five components derived from nuisance signals from the white matter and cerebrospinal fluid (Behzadi, Restom, Liau, & Liu, 2007). Then, the functional images were temporally filtered between 0.1 and 0.01 Hz. Structural and functional images were aligned into Montreal Neurological Institute (MNI) standard space, and then a spatial smoothing using a Gaussian filter of 6 mm was performed.
2.4. VMHC calculation
Interhemispheric homotopic connectivity was computed by applying a standard implementation of C‐PAC where structural and functional images were fitted to MNI symmetrical template and the Pearson's correlation between each pair of symmetrical voxels in different hemispheres was calculated (C‐PAC Team, 2016). To assess the spatial features of interhemispheric homotopic connectivity, we used population‐level resting‐state fMRI atlas of intrinsic connectivity of homotopic areas (AICHAs) which clusters the cerebrum into 192 homotopic regional pairs (Joliot et al., 2015). To compute region of interest (ROI)‐specific VMHC, we averaged voxel‐specific VMHC values across all the voxels within a given ROI. A number of previous studies reported the multicenter variability in MRI‐based measures (Haar, Berman, Behrmann, & Dinstein, 2014). We removed the variability of homotopic connectivity across centers in ABIDE with a linear regression analysis, modeling the presence of centers with dummy (binary) variables. To avoid any issues caused by variability of scan parameters or recording procedures, we did not merge individuals from the same centers in ABIDE I and II. The schematic illustration of the analysis pipeline is displayed in Figure 1.
Figure 1.
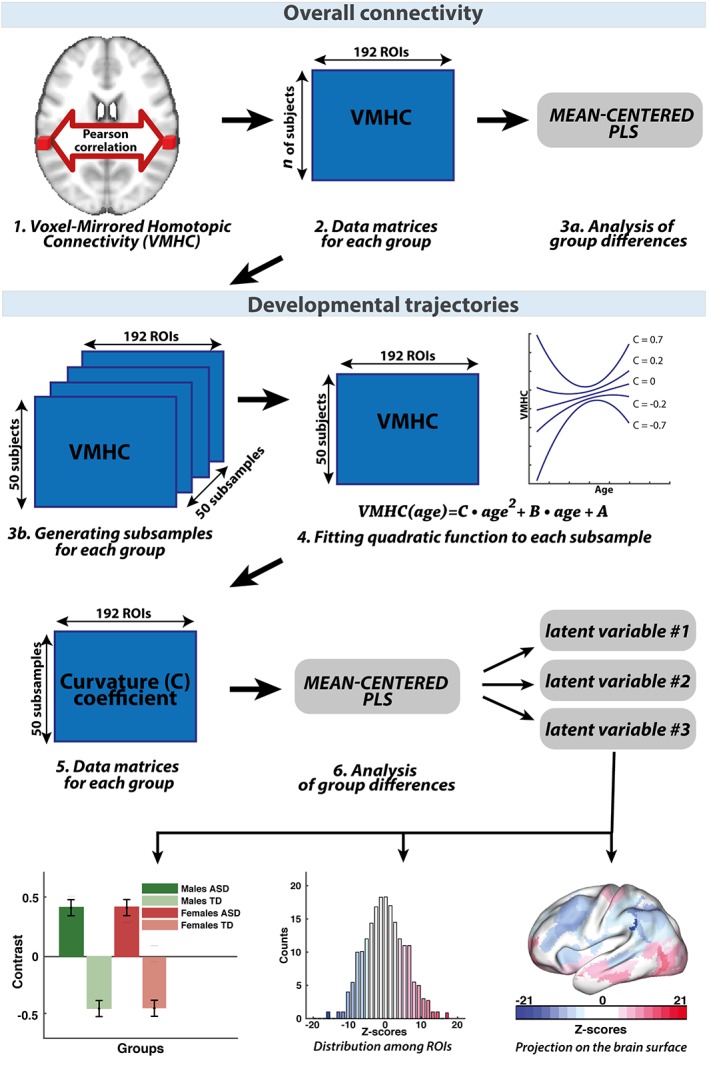
Schematic illustration of the data analysis: To investigate overall interhemispheric homotopic connectivity, we used C‐PAC to calculate the VMHC (1). We applied AICHA atlas and obtained data matrix (number of subjects × ROIs) for each of the group (2) which we explored the statistical differences by mean‐centered PLS (3a). We used the same data matrices to build developmental trajectories. First, we generated 50 subsamples for each group. Each subsample contained VMHC values of 50 subjects for 192 ROIs (3b). Then we fitted quadratic function to each subsample (4) and formed new data matrices of curvature coefficients (5), which define curvature shape. We compared these new data matrices by using PLS analysis (6). PLS analysis provides the LVs, for each of them we obtained between group contrast and z‐score distribution within ROIs which was projected back to the brain surface [Color figure can be viewed at https://wileyonlinelibrary.com]
2.5. Developmental trajectories of VMHC
A number of studies have reported U‐shaped, or inverted U‐shaped patterns for the age‐related changes in gray matter density within the age range which includes the onset of puberty, possibly reflecting synaptic reorganization (Giedd et al., 1999). Also, it has been shown to be a reasonable compromise between nonlinearity and complexity. Quadratic model was previously found optimal for exploring age‐related changes in VMHC when compared to cubic and linear models (Zuo et al., 2010) and was successfully applied in neuromagnetic and structural neuroimaging studies in ASD population (Vakorin et al., 2017).
To further support our choice of the quadratic model, we tested goodness of fit for VMHC as a function of age, using both linear and quadratic models. This was done for each ROI, separately for each group, by computing the Akaike information criterion (AIC) and Bayesian information criterion (BIC). We found that the model that best fit the data could be either linear or quadratic, depending on which ROI was being investigated. In addition, we performed paired t tests, separately for each group, comparing AIC or BIC values for linear and quadratic models across ROIs within a specific group, and found no significant differences (p‐values for AIC criterion were ranging from 0.44 to 0.84, and for BIC—from 0.2 to 0.95) indicating that there is no ultimate winner among the models. This would also support our choice of considering only quadratic functions, taking into account that a linear model represents a specific case of a quadratic function.
One unique property of quadratic functions is their curvature, which is mathematically defined as the second derivative, and represents how the rate of change of a variable is itself changing. The quadratic functions have constant curvatures, which can be either positive (concave upward or U‐shaped functions), negative (concave downward or inverted U‐shaped functions) or zero (linear function). Previously, curvature values were found to be a sensitive neurophysiological marker to differentiate ASD and TD groups (Vakorin et al., 2017). To test group differences in terms of the curvatures of age‐related changes, we need to introduce variability in the curvature values. Instead of calculating the curvature for the original groups which would result in one estimate per group, we used subsampling to generate a distribution of the curvature estimates per group. This was done by randomly choosing subsamples of subjects, separately for each group, subsequently estimating the trajectories of VMHC for each subsample. This method was adapted from a previous study on atypical developmental trajectories in ASD brain network connectivity (Vakorin et al., 2017).
One limitation of the ABIDE database is that subjects are not uniformly distributed across age. To mitigate this, we generated a large number of subsamples (10,000) of 50 subjects for each group (TD/ASD for males/females), but ultimately chose only 50 subsamples with the flattest age distribution. We used a criterion based on calculating the entropy of distributions, which is highest for uniform distributions Then, for each subsample, we fitted a quadratic function, estimating its curvature. Thus, each group was associated with 50 estimates of the curve parameter for each of 192 ROIs. Analysis of group differences was then performed in a multivariate manner, for all groups and ROIs simultaneously (see Analysis of group differences), resulting in three individual p‐values, each associated with a data‐driven group contrasts and ROI‐specific z‐scores. To increase the robustness of the results, we performed all these procedures 100 times including generation of subsamples (thus in total 100 × 50 subsamples were selected for each group), curve fitting, and group analysis), subsequently averaging the p‐values and z‐scores. In Section 3, we report the averaged three group contrasts, their p‐values, and z‐scores.
To assess group differences in the curvature parameter reflecting the trajectory of development of connectivity strength for each interhemispheric region pair from the longitudinal data, we applied a similar procedure. First, for each subject, we estimated the rate of changes in VMHC values computed as the ratio of VMHC changes between two longitudinal points to the corresponding age difference. Thus, each subject was associated with the 192 ROI‐specific first derivatives of the developmental trajectories, and these estimates were used for further analysis. For each round of trajectory analysis (out of total 100), we generated, separately for each group (TD and ASD), 10 randomly chosen subsamples of 10 subjects. For each subsample, we fitted a linear function, estimating its slope. Note that the slope parameter computed from the rate of changes in VMHC (from the first derivatives) represents how the rate of change in VMHC is changing, which is equivalent to the curvature estimated from the cross‐sectional data, as described above for the cross‐sectional data. Thus, each group was associated with 10 estimates of the curvature parameter for each of 192 ROIs.
We then performed an analysis of group differences, estimating the global contrast between the two groups (one p‐value), and assessing how the contrast is expressed across ROIs (a 192‐dimentional vector of z‐scores). The procedure that includes subsample generation, linear regression, and group analysis, was repeated 100 times to increase the robustness of the results. We report the group differences in the curvatures computed from the longitudinal data, as p‐value and ROI‐specific z‐scores averaged across the rounds of trajectory analysis (Figure 5).
Figure 5.
Group differences between ASD and TD in the curvature of developmental trajectories in interhemispheric homotopic connectivity (group analysis with PLS based on the longitudinal sample): (a) group contrast (p < .001); (b) corresponding distribution of z‐scores showing how the contrast is expressed across 192 ROIs; and (c) same z‐scores shown as a topographic map in the MNI space [Color figure can be viewed at https://wileyonlinelibrary.com]
2.6. Analysis of group differences
The analyses of group differences, both for homotopic connectivity and its trajectories, were performed with partial least squares (PLS) analysis. PLS is a multivariate statistical technique designed to extract LVs that account for the variance in the data, which is similar to principal component analysis (Lobaugh, West, & McIntosh, 2001; McIntosh & Lobaugh, 2004). Two versions of PLS are often applied in the neuroimaging literature: mean‐centered and behavioral PLS (Krishnan, Williams, McIntosh, & Abdi, 2011). Mean‐centered PLS is designed to derive data‐driven contrasts between two or more groups or conditions. Behavioral PLS investigates the significance of correlations between imaging data and continuous variables such as behavioral scores (ADOS generic scores in our case (Lord et al., 2000)).
For both versions of PLS, the entire data structure is considered at once, and the data are organized into matrices: subjects within groups by ROIs. Mathematically, PLS is based on singular value decomposition (SVD). SVD is a factorization of the original data matrix into three matrices: left matrix with vectors of dimensionality equal to the number of groups (overall group contrast), diagonal matrix showing the strength of each component (which is ultimately related to the amount of explained variance), and right matrix with vectors of dimensionality equal to the number of ROIs (robustness of overall group contrast).
Routinely, the PLS method includes one global test and a series of local tests. The global test is based on permutations and assesses the significance of the effect represented by the overall data‐driven contrasts or overall correlation between imaging and clinical data by measuring how it is different from random noise. Thus, PLS generates one p‐value for each LV associated with a group contrast or overall correlation mitigating the multiple comparison problems. Also, each LV is associated with local tests based on bootstrap procedures, which is performed separately for each ROIs, exploring how the overall contrast or correlation is expressed across ROIs. As a result, each ROI is associated with a bootstrap ratio value. Under the assumption of a Gaussian distribution, the bootstrap ratio value of 2.5 or −2.5 approximately corresponds to the limits of the 95% confidence interval. In this study, we use the terms of z‐scores and bootstrap ratio values from PLS interchangeably.
We applied the following PLS analyses: mean‐centered PLS for exploring group differences for VMHC and their curvatures, and behavioral PLS for exploring correlations between VMHC and ADOS as well as between the VMHC curvatures and ADOS (see Section 2.7). In each PLS analysis, we used 1,000 permutations for the global test, and 1,000 bootstrap samples (for local tests). For the longitudinal data, we used 500 permutations for the global test and 500 bootstrap samples for local tests. In each case, we report the significance of group contrast or over‐all correlation (p‐value), and if the p‐value is less than 0.05, we report the distribution of z‐scores across ROIs. The z‐scores that are largest in magnitude (positive or negative), indicate the most robust effects, which was identified as 5% tails of the overall distributions of z‐scores. ROIs with positive z‐scores directly support the given contrast or sign of the overall correlation. ROIs with negative z‐scores also support the same contrast or correlation, but in a reverse direction. Thus, for ROIs with negative z‐scores, we have to invert the overall group contrast to have an idea about the directionality of changes in the curvature values across the groups. Group differences in demographic, psychometric characteristics were explored by series of two‐sample t tests which were further corrected by Bonferroni method. The results are presented in Table 1.
2.7. Brain‐behavior correlations
We performed behavioral PLS analysis to investigate associations between VMHC values and ADOS‐Generic scores for communication, social interaction and total (social interaction and communication). In addition, we applied behavioral PLS analysis to investigate potential associations between ADOS with VMHC trajectories. We included only those participants who had information on all three ADOS modules: n = 56 for males with ASD, and n = 54 for females. There were no significant differences in any of the three subscales between females and males with ASD, as confirmed by two‐sample t tests.
Our approach for investigating potential associations between trajectories and ADOS scores was based on recent findings regarding slowing of cortical thinning in individuals with ASD (Nunes, Peatfield, Vakorin, & Doesburg, 2018 under review). Specifically, the study demonstrated that the shape of developmental curvature is related to ASD symptomatology. Following these methods, we investigated the relationship between curvature shape of fMRI‐based connectivity in ASD participants and mean ADOS score, separately for males and females.
First, we generated a set of 50 subsamples separately for males and females with ASD and calculated mean ADOS score for each subsample. Each subsample contained 20 subjects (the number of subjects was reduced in order to increase the impact of single subject on curvature shape and mean ADOS score). Then, we computed the ROI‐specific VMHC curves as functions of age, fitting a quadratic function to each subsample. In result, we obtained curvature coefficient for each ROI and mean ADOS score per subsample.
Finally, we performed six PLS analyses to correlate VMHC with ADOS scores (communication, social interaction, and total), separately for males and females. We also performed six PLS analyses to investigate correlations between three ADOS scores and the curvature coefficients (for males and females). In all cases, we used 1,000 permutations to assess the significance of an overall correlation between ADOS and VMHC or their curvatures (one p‐value from a global test), and 1,000 bootstrap samples to explore the robustness of the correlation effects across ROIs (ROI‐specific z‐scores from local tests, see group‐level analysis).
3. RESULTS
3.1. No group differences for overall connectivity
The multivariate group analysis, which we performed using mean‐centered PLS with all four groups included, did not find any significant group differences in interhemispheric homotopic connectivity.
3.2. Three significant group contrasts for age‐related changes
We thus tested the hypotheses that age‐related changes in homotopic connectivity would be atypical in ASD and differentially expressed in males and females with ASD. We characterized the development of functional connectivity in both TD and ASD in terms of anatomical loci, and tested for group differences in the curvature of maturational changes, including all four groups into the PLS analysis. PLS revealed, in a data‐driven manner, three significant group contrasts (LVs), which represent contrasts between TD females and all other groups (Figure 2; LV1), between TD and ASD (Figure 3; LV2), and between males and females in ASD (Figure 4; LV3). Note that each contrast is associated with a single P‐value, resulting from one global test for group differences in the multivariate PLS analysis. In turn, each contrast is associated with a vector of saliences representing contributions of individual ROIs to the overall group contrast. In our study we report the stability of those saliences, quantified as bootstrap ratio values (or z‐scores) from a series of local tests, each associated with a ROI, as described in the Methods section.
Figure 2.
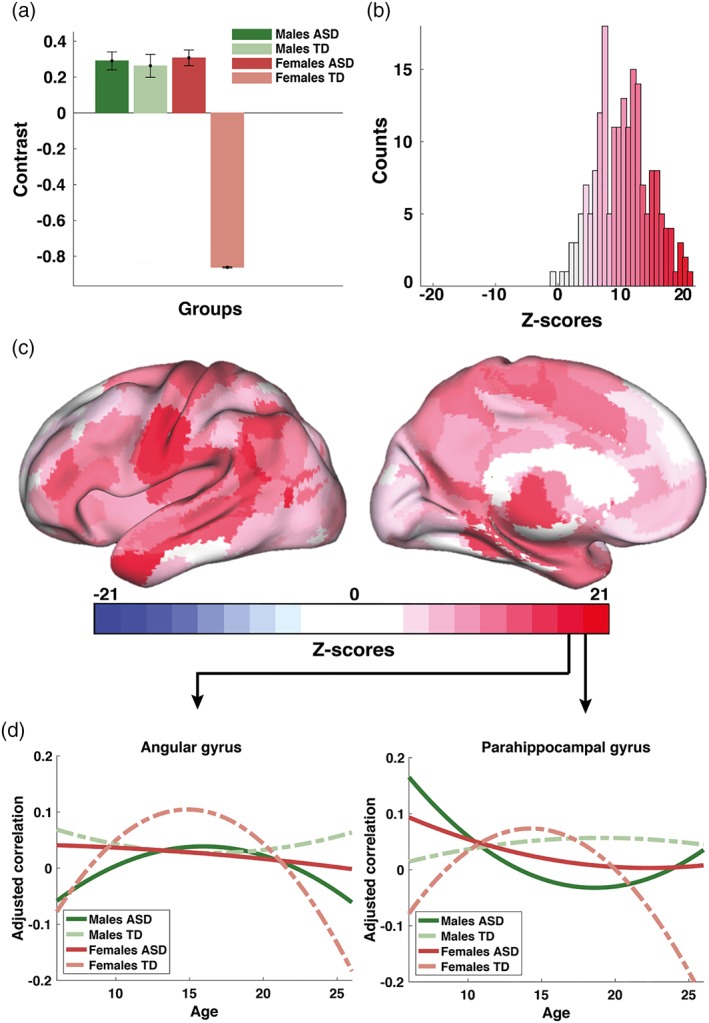
Male patterns of development of functional brain connectivity in ASD (cross‐sectional sample): (a) first significant data‐driven contrast (57% variance explained, LV1); (b) a corresponding distribution of z‐scores showing how the contrast is expressed across 192 ROIs from the AICHA atlas; (c) same z‐scores shown as a topographic map in the MNI space; and (d) estimated group‐specific trajectories exemplified for two ROIs (brain areas G Angular‐1 and G ParaHippocampal‐1 according to the nomenclature of the AICHA atlas). The contrast in (a) represents a similarity between two ASD groups and TD males in contrast TD females. Note that the PLS analysis of group differences revealed three significant contrast; the other two are described in Figures 3 and 4 [Color figure can be viewed at https://wileyonlinelibrary.com]
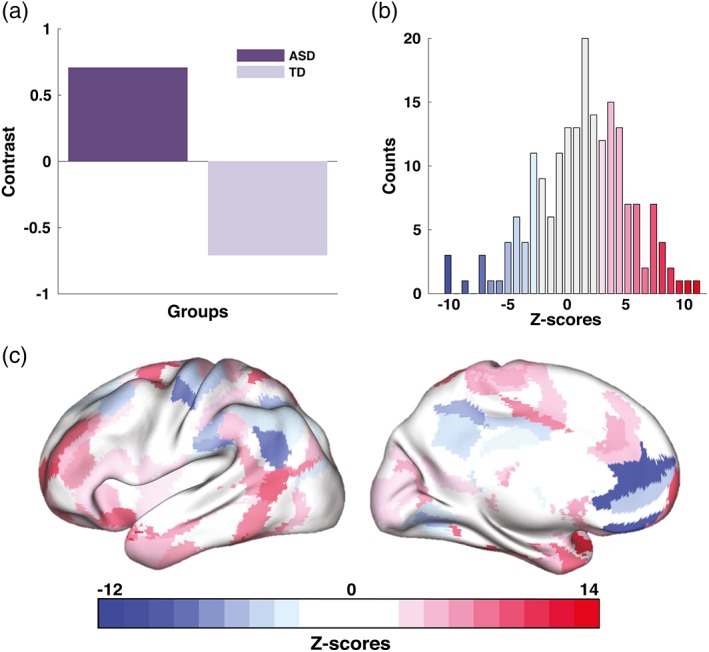
Figure 3.
Altered developmental trajectories in ASD (cross‐sectional data set): (a) second significant contrast (26% variance explained, LV2); (b) a corresponding distribution of z‐scores demonstrating the robustness of the overall group contrast across ROIs; (c) topographic distribution of the same z‐scores in the MNI space; and (d) group‐averaged trajectories for two ROIs with the largest positive and negative z‐scores (brain areas G SupraMarginal‐5 and G Occipital Lat‐2 in the AICHA atlas). The contrast in (a) represents differences between ASD and TD populations, driven mostly by males. Note that the contrast is supported by both highly positive and negative z‐scores. Positive z‐scores (shown in red) directly support the contrast in (a) whereas for interpretation purposes, the contrast has to be flipped to interpret its expression across ROIs with negative scores [Color figure can be viewed at https://wileyonlinelibrary.com]
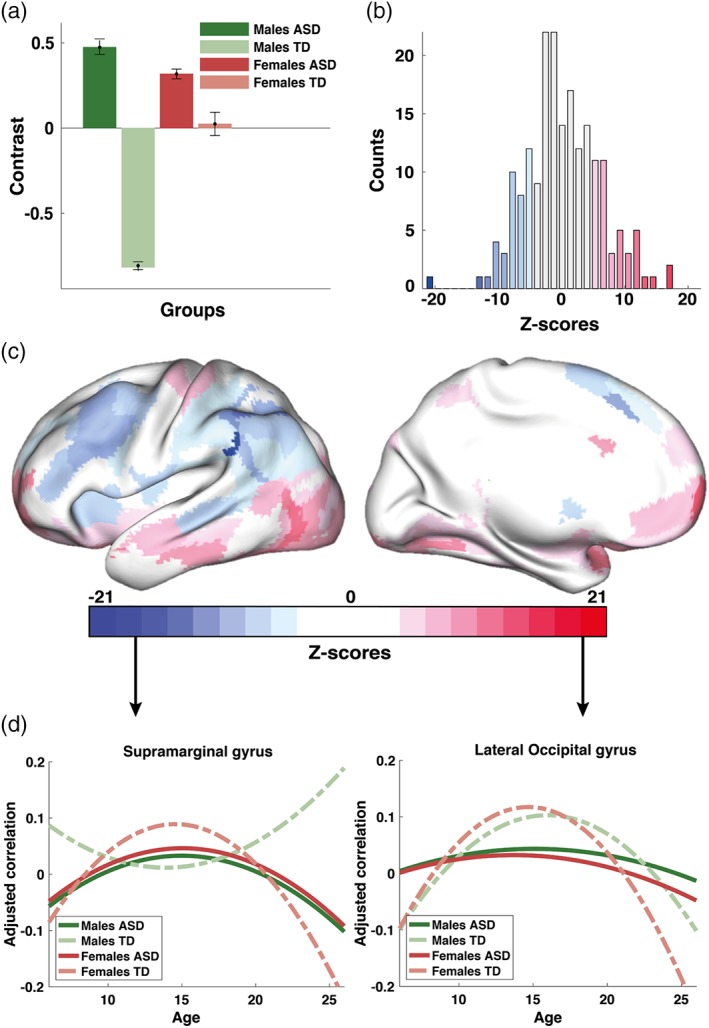
Figure 4.
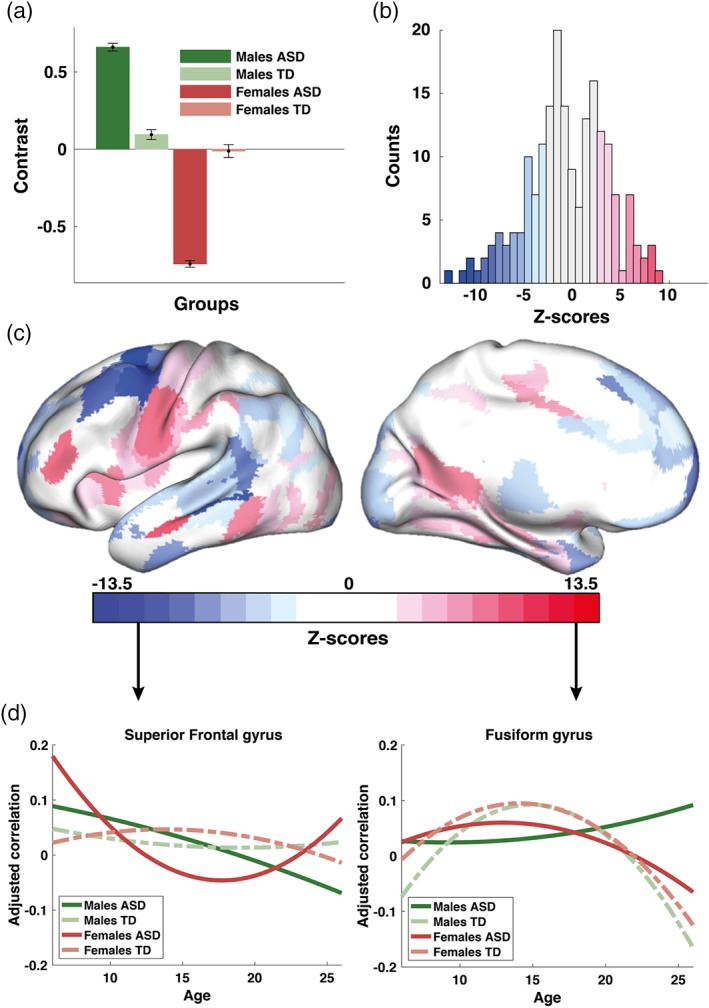
Sex differences in developmental trajectories of brain connectivity in ASD (cross‐sectional sample): (a) third significant contrast (17% variance explained, LV3); (b) a corresponding distribution of z‐scores each associated with ROIs from the AICHA; (c) same z‐scores shown topographically in the MNI space; and (d) group‐specific trajectories for two ROIs with the largest positive and negative scores (brain areas G Frontal Sup‐1 and G Fusiform‐6 according to the nomenclature of the AICHA atlas). The contrast in (a) represents differences between ASD males and ASD females. The contrast in (a) reflect mainly differences between males and females in ASD [Color figure can be viewed at https://wileyonlinelibrary.com]
3.3. Group differences between TD females and all other groups
The first group contrast (LV1) explained 57% of the total variance in the data, and represents overall group differences between TD females and three other groups, as illustrated in Figure 2a (p < .001). It essentially decomposes the variability in developmental trajectories of functional connectivity into two clusters: one cluster uncovering similarities between TD males with males and females with ASD, and the other one representing TD females. Figure 2b shows the corresponding distribution of z‐scores, each associated with one ROI, which reflects the robustness of the effects specified by the group contrast in Figure 2a. The largest absolute values of z‐scores, which in general, can be either positive (here shown in red) or negative, are associated with the most robust effect. The same distribution of z‐scores is illustrated in Figure 2c as a color map within a template of the brain in the MNI space, using the Computerized Anatomical Reconstruction Toolkit (Caret) (Van Essen et al., 2001).
To identify the most robust effects across ROIs specified by a given group contrast, we typically explore 5% left and right tails of the distribution of z‐scores (Vakorin et al., 2013; Vakorin et al., 2017). Note, however, that the distribution in Figure 2b is highly skewed. Thus, for the group differences in developmental trajectories of homotopic connectivity, which reflected TD females contrasted with all three other groups, we focus only on the largest positive z‐scores (shown in dark red in Figure 2b,c). Specifically, these group differences in the shape of trajectories of connectivity were expressed prominently in the middle frontal gyrus, paracentral lobule, intraparietal sulcus, and superior and middle temporal gyri. We report that, on average, the developmental trajectories were concave upward (an inverted U) to a larger degree in the group of TD females than in the other three groups. In other words, the trajectories of connectivity for TD males, ASD males, and ASD females were flatter, in comparison to TD females. To further illustrate these effects, we identified two ROIs with the largest positive z‐scores (angular and parahippocampal gyri). We then computed the mean fitted quadratic functions, which represent age‐related changes in homotopic connectivity, averaging across all ensembles of trajectories, separately for each group. The averaged trajectories for the two brain areas are plotted in Figure 2d.
3.4. Altered development of homotopic connectivity in ASD
Explaining 26% of the total variance, the second group contrast (LV2) in PLS (p < .001) represents a difference in the VMHC trajectories between ASD and TD populations, with the differences between ASD and TD males being stronger than those between ASD and TD females, as shown in Figure 3a. The robustness of these effects is represented by the distribution of z‐scores in Figure 3b, which shows how the group contrast is expressed across individual ROIs. Figure 3c illustrates the same z‐scores as a topographic map on the template of the brain in the MNI space, similar to Figure 2c.
The largest absolute values of z‐scores define the most robust effects. ROIs within the 5% positive tail of the distribution in Figure 3b (shown in red) include orbitofrontal cortex, middle and inferior temporal gyri, and the lateral occipital gyrus. On average, the developmental trajectories were concave upward (negative curvature) in both TD and ASD males; however, the curves tend to be flatter for males with ASD. ROIs belonging to the 5% negative tail of the distribution of z‐scores (shown in blue in Figure 3b,c) were mostly located in the middle frontal gyrus, intraparietal sulcus, and inferior parietal lobule. Quadratic functions describing the age‐related changes in VMHC for these ROIs tend to be concave downward (positive curvature for a U‐shaped function) for TD males, whereas they tend to be concave upward for ASD males (negative curvature for an inverted U function). To illustrate the contrast in Figure 3a, we chose two ROIs with the largest absolute values of z‐scores (one positive and one negative). Similar to Figure 2d, the averaged trajectories in VMHC for these ROIs are plotted in Figure 3d.
3.5. Group differences between males and females with ASD
The third group contrast (LV3, p = .003, 17% variance explained) identified significant differences in developmental trajectories between females and males with ASD as shown in Figure 4a. The corresponding distribution of ROI‐specific z‐scores is shown in Figure 4b as a histogram, and in Figure 4c as a topographic map. The most robust effects expressed by the group contrast in Figure 4a are supported by both positive and negative z‐scores.
Positive z‐scores represent a scenario wherein the estimated curvatures are higher in ASD males in comparison to ASD females. ROIs with the highest positive z‐scores were included the middle frontal gyrus, paracentral lobule, middle, inferior temporal and fusiform gyrus, and the precuneus (red areas in Figure 4c). For these ROIs, the trajectories in the ASD female group were concave downward (negative curvatures) and relatively flat for ASD males (small negative or positive values of the curvatures).
The same contrast is supported by negative z‐scores (curvature is higher for ASD females). ROIs with the most robust effects were observed in the prefrontal cortex, premotor cortex and inferior temporal gyrus (blue areas in Figure 4c). The fitted quadratic functions are concave upward for ASD males, whereas for ASD females they tend to follow the opposite U‐shaped pattern.
3.6. Longitudinal sample
The smaller longitudinal sample was used to test the hypothesis that atypical trajectories reported in the cross‐sectional analysis were also observed in a longitudinal analysis. Due to the small sample size, however we did not have that ability to further stratify differences between ASD and TD participants according to their sex. Our results based on the longitudinal sample were qualitatively similar to those obtained from analysis of the cross‐sectional data. Specifically, PLS analysis did not find significant overall group differences in VMHC between ASD and TD groups when either the first scans or second scans or both were used. However, group differences were significant in terms of the curvatures of the maturational trajectories. Note that we computed the normalized difference in VMHC between the two scans to estimate the rate of change in VMHC. These changes were further used to estimate the curvatures of the trajectories in VMHC, which were the foci of our analysis based on the cross‐sectional sample.
PLS analysis revealed an association between VMHC and age, which was measured in terms of the rate of changes in VMHC (curvatures), was significantly different between ASD and TD groups. The overall group contrast (p < .001) is illustrated in Figure 5a. The distribution of z‐scores associated with this contrast is shown in Figure 5b. The topographic map in Figure 5c shows the same distribution in anatomical space. Similar to the effects shown in Figure 3, the group contrast contributed to by brain areas showing expressing both positive and negative z‐scores. ROIs with the largest positive z‐scores (5% tail), which reflect the U‐shaped patterns for ASD as opposed to the inverted U‐shaped ones frequently observed for TD, include lateral prefrontal cortex, inferior temporal gyrus, and cingulate gyrus. These patterns are reversed for negative z‐scores. The 5% negative tail of the overall distribution of z‐scores in Figure 5b are composed of ROIs localized in medial prefrontal areas, intraparietal sulcus, inferior parietal lobule, and precuneus, as shown in Figure 5c.
3.7. Correlation with ASD symptomatology
Associations between VMHC and ASD symptomatology were analyzed only for the cross‐sectional data as the number of subjects in the longitudinal data set with ADOS scores was small. Our multivariate group analyses, which were performed with behavioral PLS separately for males and females did not find any significant correlations between VMHC and any of the ADOS scores. Significant correlations, however, were observed in the ASD groups between the mean social ADOS scores and shape of developmental trajectories. The latter was quantified as curvature coefficient (see Section 2.7). Correlations between the curvature shape of individual ASD participants and ADOS social interaction scores were positive (Figure 6a). More specifically, the significance of correlations was p = .004 for the ASD males and p = .02 for the ASD females. Essentially, the bigger curvature coefficient (the more curvature was concave upward), the higher severity of symptoms.
Figure 6.
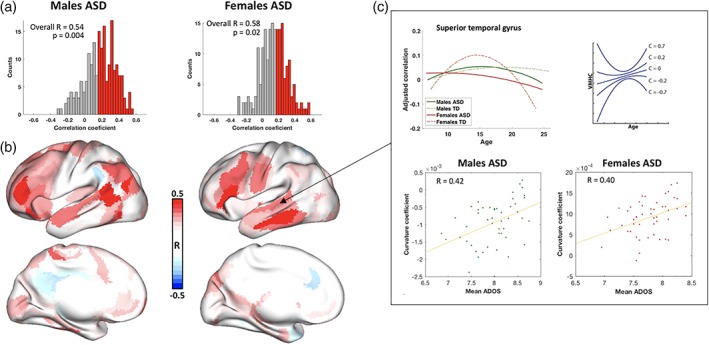
Association of curvature shape and ADOS (social subscale): (a) distribution of correlation coefficient among ROIs for ASD males (left) and ASD females (right); (b) ROIs where curvature shape correlated the most with ADOS scores for ASD males (left) and ASD females (right); (c) the association between ADOS (social subscale) and developmental trajectories exemplified in superior temporal gyrus. The top left plot illustrates developmental trajectories of interhemispheric homotopic connectivity in all four groups. The top left plot is a schematic illustration of curvature coefficient and curvature shape. The scatterplots in the bottom demonstrate the association between curvature coefficient and ADOS social scores. The bigger deviation from TD female down concaved trajectory to “U” shape correlates with higher ADOS score in both ASD males and ASD females [Color figure can be viewed at https://wileyonlinelibrary.com]
Interestingly, the spatial distribution of ROIs with highest correlation between curvature shape and mean ADOS scores (middle frontal gyrus, paracentral lobule, inferior parietal lobule and superior temporal sulcus [Figure 6b]) in both males and females with ASD were similar to the ones with highest z‐scores in the first group contrast (LV1). Note that the main difference revealed by LV1 was highly concaved down developmental curve (negative curvature coefficient [Figure 6c, top right]) for TD females, whereas ASD groups and TD males tended to have flatter (close to zero) or concaved up curvatures (positive curvature coefficient [Figure 6c, top right]). In other words, the higher curvature coefficient (the more the trajectory curved upward in contrast to the downward curving typical female trajectory) was associated with higher mean social interaction score on the ADOS (Figure 6c).
4. DISCUSSION
The present study has yielded several novel insights into sex differences in ASD, unified under the framework of developing trajectories of functional brain connectivity. First, based on a large cross‐sectional cohort of males and females, robust differences in interhemispheric homotopic connectivity (quantified as VMHC) between ASD and TD populations were identified by estimating the curvatures of age‐related changes. This analysis identified robust differences in the developmental trajectories of functional brain connectivity where no overall group differences were observed. Importantly, these results were replicated with a similar analysis on a smaller longitudinal sample. Thus, our results can be incorporated into the growing body of recent evidence which supports the view that atypical development of functional brain connectivity may be a cardinal feature of ASD (Dajani & Uddin, 2016; Nomi & Uddin, 2015; Uddin et al., 2013; Vakorin et al., 2017; Zielinski et al., 2014). The present study extends this line of research by delineating the critical role of sex differentiation in the development of brain network connectivity in ASD.
Previous studies reported both decreased interhemispheric homotopic connectivity in ASD compared to typical population as well as no differences between groups (Anderson et al., 2012; Di Martino et al., 2014; Hahamy et al., 2015). Our findings indicate no differences in VMHC between groups while differences in developmental changes of VMHC were very pronounced. This indicates that alterations found in VMHC might be highly dependent on the age range of participants and have to be taken into consideration (note that age ranges of participants in the studies mentioned above differ).
Importantly, our results found similarities between ASD populations and TD males, in contrast to TD females, in terms of the curvatures of age‐related changes in interhemispheric connectivity. This finding supports the extreme male brain (EMB) theory which considers many autism traits as an extreme profile of “typical male” strengths and challenges (Baron‐Cohen et al., 2011). It explains ASD as an extreme manifestation of a male inclination to perceive the external world through systemizing rather than the female inclination toward empathizing, (Baron‐Cohen, Knickmeyer, & Belmonte, 2005). Within a biological context, the most popular explanation of EMB theory is an alteration of the level of sex hormones, particularly fetal testosterone as it has been shown to have a considerable effect on prenatal and postnatal brain development (Auyeung et al., 2009).
Previously, the EMB theory has been supported by behavioral (Baron‐Cohen et al., 2005), endocrinological (Auyeung et al., 2009), and genetic (Chakrabarti et al., 2009) lines of research. Recent studies of brain morphometry are also consistent with the EMB theory (Beacher et al., 2012; Lai et al., 2013). Particularly, it has been shown that females with male‐typical cortical thickness pattern more likely to have ASD than biological females with a characteristically female brain phenotype (Ecker et al., 2017). An fMRI study showed that brain activity pattern in females with ASD was shifted to neural masculinization; however, at the same time, males with ASD demonstrated a shift toward the neuronal feminization (Alaerts, Swinnen, & Wenderoth, 2016). Another study got closer to EMB theory by focusing on default mode network (DMN) intraconnectivity. It was shown that among four groups, TD females had the highest connectivity between DMN nodes whereas ASD females had lower connectivity than TD males but higher connectivity than ASD males (Ypma et al., 2016). Our study provides one of the first robust neuroimaging evidence in support of the EMB theory with a large sample size.
Results from our investigations of associations between developmental trajectories of homotopic connectivity are also concordant with observed patterns of group differences. LV1 demonstrates that the curvature coefficient in TD males, males and females with ASD was on average more positive in contrast to negative curvature coefficient of TD females. Thus, the positive association between curvature coefficient and mean ADOS score is also consistent with the EMB theory. In other words, the more distinct is the shape of the curvature in ASD groups from that of the typical female trajectory the more severe the ASD symptomatology. This result is partially congruent with recent studies on ASD idiosyncrasy (Hahamy et al., 2015; Nunes et al., 2018; Vakorin et al., 2017). Although these prior studies demonstrated that ASD symptomatology increases with deviation from typical pattern, they did not investigate the impact of sex differences in this association.
Although the second group contrast explained only 26% variance in the data, it captured significant differences between TD males and ASD groups. Mapping of age‐related deviations from typical brain development has the potential to predict ASD from individual scans, which has thus far proven difficult using only estimates of overall connectivity. Although a number of studies reported relatively high predictive power of abnormal brain connectivity in ASD, in particular in adults (Yahata et al., 2016), other studies, especially those covering a wide range of ages during development are more conservative regarding the performance of machine learning tools, reporting accuracies indistinguishable from chance (Haar et al., 2014; Katuwal, Cahill, Baum, & Michael, 2015). A recent study, however, found that the rate of change in surface area and brain volume in infancy can predict, with high accuracy, the diagnosis of ASD in high risk siblings of children with ASD at 2 years of age (Hazlett et al., 2017). Thus, adopting a developmental perspective provides a promising framework to further clarify the nature and extent of atypicalities in ASD and is more likely to yield success in the search for imaging biomarkers for ASD than focusing on neural alterations which are expected to remain consistent throughout development.
Our results indicate that a developmental trajectories approach is effective when exploring sex differences in ASD. We show that although both males and females with ASD tend to follow typical male brain trajectory they still are significantly different from one another. We suspect that sex differences in ASD may be better characterized as differences in developmental trajectories of brain function in ASD rather than absolute differences which remain static throughout the course of development. Behavioral research shows a similar pattern of findings. Few consistent sex differences in ASD behavioral symptoms have been identified, particularly when IQ is in the average range. However, different developmental trajectories of symptom presentations are more commonly found for boys and girls with ASD. For example, boys were more impaired on social and communicative behavior at a young age, whereas females had more social deficits as adolescents and adults, specifically in reciprocal interaction and peer relationships (McLennan, Lord, & Schopler, 1993) and more lifetime sensory issues (Lai et al., 2011).
5. CONCLUSION
Using multivariate data‐driven techniques from computational neuroscience and neuroimaging, we uniquely demonstrate that the developmental trajectories of homotopic connectivity variable across young age with different typical or atypical patterns, providing a new framework for studying pathological alterations and sex differences. Moreover, our findings indicate that age‐ and sex‐specific alterations in connectivity might better characterize this group rather than specific overconnectivity or underconnectivity per se. Importantly, we provide one of the first direct evidences in support of the EMB theory in terms of developmental trajectories in homotopic functional connectivity. Finally, our results demonstrate the association between developmental trajectory shape and symptoms severity in both males and females with ASD.
CONFLICT OF INTERESTS
The authors declare no potential conflict of interests.
Supporting information
Table S1 ABIDE I and II acquisition sites and participants IDs
ACKNOWLEDGMENTS
This work was supported by the Canadian Institutes of Health Research (http://www.cihr-irsc.gc.ca) grant # to MOP‐136935 to SMD. This research was enabled in part by support provided by WestGrid (http://www.westgrid.ca) and Compute Canada (http://www.computecanada.ca).
Kozhemiako N, Vakorin V, Nunes AS, Iarocci G, Ribary U, Doesburg SM. Extreme male developmental trajectories of homotopic brain connectivity in autism. Hum Brain Mapp. 2019;40:987–1000. 10.1002/hbm.24427
Funding information Canadian Institutes of Health Research, Grant/Award Number: MOP‐136935
Nataliia Kozhemiako and Vasily Vakorin contributed equally to this study.
REFERENCES
- Alaerts, K. , Swinnen, S. P. , & Wenderoth, N. (2016). Sex differences in autism: A resting‐state fMRI investigation of functional brain connectivity in males and females. Social Cognitive and Affective Neuroscience, 11, 1002–1016. [DOI] [PMC free article] [PubMed] [Google Scholar]
- Anderson, G. R. , Galfin, T. , Xu, W. , Aoto, J. , Malenka, R. C. , & Südhof, T. C. (2012). Candidate autism gene screen identifies critical role for cell‐adhesion molecule CASPR2 in dendritic arborization and spine development. Proceedings of the National Academy of Sciences of the United States of America, 109, 18120–18125. [DOI] [PMC free article] [PubMed] [Google Scholar]
- Anderson, J. S. , Druzgal, T. J. , Froehlich, A. , DuBray, M. B. , Lange, N. , Alexander, A. L. , … Cooperrider, J. R. (2010). Decreased interhemispheric functional connectivity in autism. Cerebral Cortex, 21, 1134–1146. [DOI] [PMC free article] [PubMed] [Google Scholar]
- APA . (2013). Diagnostic and statistical manual of mental disorders (DSM‐5®). (5th ed.). Arlington, VA: American Psychiatric Association. [Google Scholar]
- Auyeung, B. , Baron‐Cohen, S. , Ashwin, E. , Knickmeyer, R. , Taylor, K. , & Hackett, G. (2009). Fetal testosterone and autistic traits. British Journal of Psychology, 100, 1–22. [DOI] [PubMed] [Google Scholar]
- Baron‐Cohen, S. , Knickmeyer, R. C. , & Belmonte, M. K. (2005). Sex differences in the brain: Implications for explaining autism. Science, 310, 819–823. [DOI] [PubMed] [Google Scholar]
- Baron‐Cohen, S. , Lombardo, M. V. , Auyeung, B. , Ashwin, E. , Chakrabarti, B. , & Knickmeyer, R. (2011). Why are autism spectrum conditions more prevalent in males? PLoS Biology, 9, e1001081. [DOI] [PMC free article] [PubMed] [Google Scholar]
- Beacher, F. , Minati, L. , Baron‐Cohen, S. , Lombardo, M. , Lai, M.‐C. , Gray, M. , … Critchley, H. (2012). Autism attenuates sex differences in brain structure: A combined voxel‐based morphometry and diffusion tensor imaging study. American Journal of Neuroradiology, 33, 83–89. [DOI] [PMC free article] [PubMed] [Google Scholar]
- Behzadi, Y. , Restom, K. , Liau, J. , & Liu, T. T. (2007). A component based noise correction method (CompCor) for BOLD and perfusion based fMRI. NeuroImage, 37, 90–101. [DOI] [PMC free article] [PubMed] [Google Scholar]
- Cerliani, L. , Mennes, M. , Thomas, R. M. , Di Martino, A. , Thioux, M. , & Keysers, C. (2015). Increased functional connectivity between subcortical and cortical resting‐state networks in autism spectrum disorder. JAMA Psychiatry, 72, 767–777. [DOI] [PMC free article] [PubMed] [Google Scholar]
- Chakrabarti, B. , Dudbridge, F. , Kent, L. , Wheelwright, S. , Hill‐Cawthorne, G. , Allison, C. , … Baron‐Cohen, S. (2009). Genes related to sex steroids, neural growth, and social–emotional behavior are associated with autistic traits, empathy, and Asperger syndrome. Autism Research, 2, 157–177. [DOI] [PubMed] [Google Scholar]
- Cheng, W. , Rolls, E. T. , Gu, H. , Zhang, J. , & Feng, J. (2015). Autism: Reduced connectivity between cortical areas involved in face expression, theory of mind, and the sense of self. Brain, 138, 1382–1393. [DOI] [PMC free article] [PubMed] [Google Scholar]
- Craddock, C. , Sikka, S. , Cheung, B. , Khanuja, R. , Ghosh, S. , Yan, C. , Li, Q. , Lurie, D. , Vogelstein, J. , Burns, R. (2013) Towards automated analysis of connectomes: The configurable pipeline for the analysis of connectomes (c‐pac). Front. Neuroinform. Conference Abstract: 5th INCF Congress of Neuroinformatics. Stockholm, Sweden.
- Dajani, D. R. , & Uddin, L. Q. (2016). Local brain connectivity across development in autism spectrum disorder: A cross‐sectional investigation. Autism Research, 9, 43–54. [DOI] [PMC free article] [PubMed] [Google Scholar]
- Di Martino, A. , Yan, C.‐G. , Li, Q. , Denio, E. , Castellanos, F. X. , Alaerts, K. , … Dapretto, M. (2014). The autism brain imaging data exchange: Towards a large‐scale evaluation of the intrinsic brain architecture in autism. Molecular Psychiatry, 19, 659–667. [DOI] [PMC free article] [PubMed] [Google Scholar]
- Ecker, C. , Andrews, D. S. , Gudbrandsen, C. M. , Marquand, A. F. , Ginestet, C. E. , Daly, E. M. , … Ruigrok, A. N. (2017). Association between the probability of autism spectrum disorder and normative sex‐related phenotypic diversity in brain structure. JAMA Psychiatry, 74, 329–338. [DOI] [PMC free article] [PubMed] [Google Scholar]
- Ecker, C. , Bookheimer, S. Y. , & Murphy, D. G. (2015). Neuroimaging in autism spectrum disorder: Brain structure and function across the lifespan. The Lancet Neurology, 14, 1121–1134. [DOI] [PubMed] [Google Scholar]
- Fombonne, E. (2003). Epidemiological surveys of autism and other pervasive developmental disorders: An update. Journal of Autism and Developmental Disorders, 33, 365–382. [DOI] [PubMed] [Google Scholar]
- Fombonne, E. (2005). The changing epidemiology of autism. Journal of Applied Research in Intellectual Disabilities, 18, 281–294. [Google Scholar]
- Fombonne, E. (2009). Epidemiology of pervasive developmental disorders. Pediatric Research, 65, 591–598. [DOI] [PubMed] [Google Scholar]
- Friston, K. J. , Williams, S. , Howard, R. , Frackowiak, R. S. , & Turner, R. (1996). Movement‐related effects in fMRI time‐series. Magnetic Resonance in Medicine, 35, 346–355. [DOI] [PubMed] [Google Scholar]
- Geschwind, D. H. , & Levitt, P. (2007). Autism spectrum disorders: Developmental disconnection syndromes. Current Opinion in Neurobiology, 17, 103–111. [DOI] [PubMed] [Google Scholar]
- Giedd, J. N. , Blumenthal, J. , Jeffries, N. O. , Castellanos, F. X. , Liu, H. , Zijdenbos, A. , … Rapoport, J. L. (1999). Brain development during childhood and adolescence: A longitudinal MRI study. Nature Neuroscience, 2, 861–863. [DOI] [PubMed] [Google Scholar]
- Haar, S. , Berman, S. , Behrmann, M. , & Dinstein, I. (2014). Anatomical abnormalities in autism? Cerebral Cortex, 26, 1440–1452. [DOI] [PubMed] [Google Scholar]
- Hahamy, A. , Behrmann, M. , & Malach, R. (2015). The idiosyncratic brain: Distortion of spontaneous connectivity patterns in autism spectrum disorder. Nature Neuroscience, 18, 302–309. [DOI] [PubMed] [Google Scholar]
- Hazlett, H. C. , Gu, H. , Munsell, B. C. , Kim, S. H. , Styner, M. , Wolff, J. J. , … Botteron, K. N. (2017). Early brain development in infants at high risk for autism spectrum disorder. Nature, 542, 348–351. [DOI] [PMC free article] [PubMed] [Google Scholar]
- Hou, Z. , Song, X. , Jiang, W. , Yue, Y. , Yin, Y. , Zhang, Y. , … Yuan, Y. (2016). Prognostic value of imbalanced interhemispheric functional coordination in early therapeutic efficacy in major depressive disorder. Psychiatry Research: Neuroimaging, 255, 1–8. [DOI] [PubMed] [Google Scholar]
- Hull, J. V. , Jacokes, Z. J. , Torgerson, C. M. , Irimia, A. , & Van Horn, J. D. (2017). Resting‐state functional connectivity in autism Spectrum disorders: A review. Frontiers in Psychiatry, 7, 1–17. [DOI] [PMC free article] [PubMed] [Google Scholar]
- Joliot, M. , Jobard, G. , Naveau, M. , Delcroix, N. , Petit, L. , Zago, L. , … Tzourio‐Mazoyer, N. (2015). AICHA: An atlas of intrinsic connectivity of homotopic areas. Journal of Neuroscience Methods, 254, 46–59. [DOI] [PubMed] [Google Scholar]
- Katuwal, G.J. , Cahill, N.D. , Baum, S.A. , Michael, A.M. The predictive power of structural MRI in Autism diagnosis In Conference Proceedings: Annual International Conference of the IEEE Engineering in Medicine and Biology Society. 2015, pp. 4270–4273. [DOI] [PubMed]
- Krishnan, A. , Williams, L. J. , McIntosh, A. R. , & Abdi, H. (2011). Partial least squares (PLS) methods for neuroimaging: A tutorial and review. NeuroImage, 56, 455–475. [DOI] [PubMed] [Google Scholar]
- Lai, M. C. , Lerch, J. P. , Floris, D. L. , Ruigrok, A. N. , Pohl, A. , Lombardo, M. V. , & Baron‐Cohen, S. (2017). Imaging sex/gender and autism in the brain: Etiological implications. Journal of Neuroscience Research, 95, 380–397. [DOI] [PubMed] [Google Scholar]
- Lai, M. C. , Lombardo, M. V. , Pasco, G. , Ruigrok, A. N. , Wheelwright, S. J. , Sadek, S. A. , … Consortium, M. A. (2011). A behavioral comparison of male and female adults with high functioning autism spectrum conditions. PLoS One, 6, e20835. [DOI] [PMC free article] [PubMed] [Google Scholar]
- Lai, M.‐C. , Lombardo, M. V. , Suckling, J. , Ruigrok, A. N. , Chakrabarti, B. , Ecker, C. , … Bullmore, E. T. (2013). Biological sex affects the neurobiology of autism. Brain, 136, 2799–2815. [DOI] [PMC free article] [PubMed] [Google Scholar]
- Lang, X. , Wang, L. , Zhuo, C.‐J. , Jia, F. , Wang, L.‐N. , & Wang, C.‐L. (2016). Reduction of interhemispheric functional connectivity in sensorimotor and visual information processing pathways in schizophrenia. Chinese Medical Journal, 129, 2422. [DOI] [PMC free article] [PubMed] [Google Scholar]
- Lobaugh, N. J. , West, R. , & McIntosh, A. R. (2001). Spatiotemporal analysis of experimental differences in event‐related potential data with partial least squares. Psychophysiology, 38, 517–530. [DOI] [PubMed] [Google Scholar]
- Lord, C. , Risi, S. , Lambrecht, L. , Cook, E. H. , Leventhal, B. L. , DiLavore, P. C. , … Rutter, M. (2000). The autism diagnostic observation schedule‐generic: A standard measure of social and communication deficits associated with the spectrum of autism. Journal of Autism and Developmental Disorders, 30, 205–223. [PubMed] [Google Scholar]
- McIntosh, A. R. , & Lobaugh, N. J. (2004). Partial least squares analysis of neuroimaging data: Applications and advances. NeuroImage, 23, S250–S263. [DOI] [PubMed] [Google Scholar]
- McLennan, J. D. , Lord, C. , & Schopler, E. (1993). Sex differences in higher functioning people with autism. Journal of Autism and Developmental Disorders, 23, 217–227. [DOI] [PubMed] [Google Scholar]
- Monk, C. S. , Peltier, S. J. , Wiggins, J. L. , Weng, S.‐J. , Carrasco, M. , Risi, S. , & Lord, C. (2009). Abnormalities of intrinsic functional connectivity in autism spectrum disorders. NeuroImage, 47, 764–772. [DOI] [PMC free article] [PubMed] [Google Scholar]
- Muhle, R. , Trentacoste, S. V. , & Rapin, I. (2004). The genetics of autism. Pediatrics, 113, e472–e486. [DOI] [PubMed] [Google Scholar]
- Nguyen, T.‐V. , McCracken, J. , Ducharme, S. , Botteron, K. N. , Mahabir, M. , Johnson, W. , … Brain Development Cooperative Group . (2012). Testosterone‐related cortical maturation across childhood and adolescence. Cerebral Cortex, 23, 1424–1432. [DOI] [PMC free article] [PubMed] [Google Scholar]
- Nomi, J. S. , & Uddin, L. Q. (2015). Developmental changes in large‐scale network connectivity in autism. NeuroImage. Clinical, 7, 732–741. [DOI] [PMC free article] [PubMed] [Google Scholar]
- Nunes, A. S. , Peatfield, N. , Vakorin, V. , & Doesburg, S. M. (2018). Idiosyncratic organization of cortical networks in autism spectrum disorder. NeuroImage, 10.1016/j.neuroimage.2018.01.022 [DOI] [PubMed] [Google Scholar]
- O'Reilly, C. , Lewis, J. D. , & Elsabbagh, M. (2017). Is functional brain connectivity atypical in autism? A systematic review of EEG and MEG studies. PLoS One, 12, e0175870. [DOI] [PMC free article] [PubMed] [Google Scholar]
- Picci, G. , Gotts, S. J. , & Scherf, K. S. (2016). A theoretical rut: Revisiting and critically evaluating the generalized under/over‐connectivity hypothesis of autism. Developmental Science, 19, 524–549. [DOI] [PubMed] [Google Scholar]
- Rane, P. , Cochran, D. , Hodge, S. M. , Haselgrove, C. , Kennedy, D. , & Frazier, J. A. (2015). Connectivity in autism: A review of MRI connectivity studies. Harvard Review of Psychiatry, 23, 223–244. [DOI] [PMC free article] [PubMed] [Google Scholar]
- Team C‐PAC. (2016) Voxel‐mirrored homotopic connectivity (VMHC).
- Uddin, L. Q. , Supekar, K. , & Menon, V. (2013). Reconceptualizing functional brain connectivity in autism from a developmental perspective. Frontiers in Human Neuroscience, 7, 1–11. [DOI] [PMC free article] [PubMed] [Google Scholar]
- Vakorin, V. A. , Doesburg, S. M. , Leung, R. C. , Vogan, V. M. , Anagnostou, E. , & Taylor, M. J. (2017). Developmental changes in neuromagnetic rhythms and network synchrony in autism. Annals of Neurology, 81, 199–211. [DOI] [PubMed] [Google Scholar]
- Vakorin, V. A. , McIntosh, A. R. , Mišić, B. , Krakovska, O. , Poulsen, C. , Martinu, K. , & Paus, T. (2013). Exploring age‐related changes in dynamical non‐stationarity in electroencephalographic signals during early adolescence. PLoS One, 8, e57217. [DOI] [PMC free article] [PubMed] [Google Scholar]
- Van Essen, D. C. , Drury, H. A. , Dickson, J. , Harwell, J. , Hanlon, D. , & Anderson, C. H. (2001). An integrated software suite for surface‐based analyses of cerebral cortex. Journal of the American Medical Informatics Association, 8, 443–459. [DOI] [PMC free article] [PubMed] [Google Scholar]
- Vissers, M. E. , Cohen, M. X. , & Geurts, H. M. (2012). Brain connectivity and high functioning autism: A promising path of research that needs refined models, methodological convergence, and stronger behavioral links. Neuroscience & Biobehavioral Reviews, 36, 604–625. [DOI] [PubMed] [Google Scholar]
- Wang, Z. , Wang, J. , Zhang, H. , Mchugh, R. , Sun, X. , Li, K. , & Yang, Q. X. (2015). Interhemispheric functional and structural disconnection in Alzheimer's disease: A combined resting‐state fMRI and DTI study. PLoS One, 10, e0126310. [DOI] [PMC free article] [PubMed] [Google Scholar]
- Werling, D. M. , & Geschwind, D. H. (2013). Sex differences in autism spectrum disorders. Current Opinion in Neurology, 26, 146–153. [DOI] [PMC free article] [PubMed] [Google Scholar]
- Yahata, N. , Morimoto, J. , Hashimoto, R. , Lisi, G. , Shibata, K. , Kawakubo, Y. , … Megumi, F. (2016). A small number of abnormal brain connections predicts adult autism spectrum disorder. Nature Communications, 7, 1–12. [DOI] [PMC free article] [PubMed] [Google Scholar]
- Yang, H. , Bai, L. , Zhou, Y. , Kang, S. , Liang, P. , Wang, L. , & Zhu, Y. (2016). Increased inter‐hemispheric resting‐state functional connectivity in acute lacunar stroke patients with aphasia. Experimental Brain Research, 1–8. 10.1007/s00221-016-4851-x [DOI] [PubMed] [Google Scholar]
- Ypma, R. J. , Moseley, R. L. , Holt, R. J. , Rughooputh, N. , Floris, D. L. , Chura, L. R. , … Bullmore, E. T. (2016). Default mode hypoconnectivity underlies a sex‐related autism spectrum. Biological Psychiatry. Cognitive Neuroscience and Neuroimaging, 1, 364–371. [DOI] [PMC free article] [PubMed] [Google Scholar]
- Zhang, J. , Ji, B. , Hu, J. , Zhou, C. , Li, L. , Li, Z. , … Hu, X. (2016). Aberrant interhemispheric homotopic functional and structural connectivity in amyotrophic lateral sclerosis. Journal of Neurology, Neurosurgery and Psychiatry, 88, 369–370. [DOI] [PubMed] [Google Scholar]
- Zhu, Y. , Song, X. , Xu, M. , Hu, X. , Li, E. , Liu, J. , … Liu, W. (2016). Impaired interhemispheric synchrony in Parkinson's disease with depression. Scientific Reports, 6, 1–9. [DOI] [PMC free article] [PubMed] [Google Scholar]
- Zielinski, B. A. , Prigge, M. B. , Nielsen, J. A. , Froehlich, A. L. , Abildskov, T. J. , Anderson, J. S. , … Lange, N. (2014). Longitudinal changes in cortical thickness in autism and typical development. Brain, 137, 1799–1812. [DOI] [PMC free article] [PubMed] [Google Scholar]
- Zuo, X.‐N. , Kelly, C. , Di Martino, A. , Mennes, M. , Margulies, D. S. , Bangaru, S. , … Castellanos, F. X. (2010). Growing together and growing apart: Regional and sex differences in the lifespan developmental trajectories of functional homotopy. Journal of Neuroscience, 30, 15034–15043. [DOI] [PMC free article] [PubMed] [Google Scholar]
Associated Data
This section collects any data citations, data availability statements, or supplementary materials included in this article.
Supplementary Materials
Table S1 ABIDE I and II acquisition sites and participants IDs