

Abstract
A wealth of neuroscience evidence demonstrates that diet and nutrition play an important role in structural brain plasticity, promoting the development of gray matter volume and maintenance of white matter integrity across the lifespan. However, the role of nutrition in shaping individual differences in the functional brain connectome remains to be well established. We therefore investigated whether nutrient biomarkers known to have beneficial effects on brain structure (i.e., the omega‐3 polyunsaturated fatty acids; ω‐3 PUFAs), explain individual differences in functional brain connectivity within healthy older adults (N = 96). Our findings demonstrate that ω‐3 PUFAs are associated with individual differences in functional connectivity within regions that support executive function (prefrontal cortex), memory (hippocampus), and emotion (amygdala), and provide key evidence that the influence of these regions on global network connectivity reliably predict general, fluid, and crystallized intelligence. The observed findings not only elucidate the role of ω‐3 PUFAs in functional brain plasticity and intelligence, but also motivate future studies to examine their impact on psychological health, aging, and disease.
Keywords: functional brain connectivity, general intelligence, individual differences, omega‐3 polyunsaturated fatty acids
1. INTRODUCTION
Nutritional cognitive neuroscience is an emerging interdisciplinary field of research that seeks to understand nutrition's impact on human cognition and brain health across the life span (Zamroziewicz & Barbey, 2016). Research in this burgeoning field demonstrates that many aspects of nutrition—from entire diets to specific nutrients—affect brain structure and function, and therefore have important implications for understanding the nature of psychological health, aging, and disease. Accumulating evidence indicates that the long‐chain polyunsaturated omega‐3 fatty acids (ω‐3 PUFAs) docosahexaenoic acid (DHA) and eicosapentaenoic acid (EPA) promote healthy brain structure and function. Both DHA and EPA are found in neural tissue and play fundamental roles in supporting brain function by regulating release of neurotransmitters and their binding to postsynaptic receptors (Chalon, 2006; Kidd, 2007), thereby assisting in neurotransmission (Chang, Ke, & Chen, 2009). Furthermore, evidence indicates that ω‐3 PUFAs may promote neurogenesis by facilitating the production of brain‐derived neurotrophic factor (BDNF) (Jiang, Shi, Wang, & Yang, 2009) and the maintenance of healthy cerebral perfusion through vasodilation (Calder, 2006; Sinn & Howe, 2008). The role of these mechanisms in promoting healthy brain aging has been supported by numerous studies investigating the effects of ω‐3 PUFAs on brain and cognition in elderly adults (Bos, van Montfort, Oranje, Durston, & Smeets, 2016; Kobe et al., 2016; McNamara, Asch, Lindquist, & Krikorian, 2018; Zamroziewicz, Paul, Rubin, & Barbey, 2015; Zamroziewicz, Paul, Zwilling, & Barbey, 2017a, 2018; Zwilling et al., in press). This literature provides evidence for structural changes in gray matter volume within brain regions widely implicated in executive functions (frontal and parietal cortex), episodic memory (hippocampus), and emotion (amygdala). Additional findings demonstrate positive associations between ω‐3 PUFA, white matter structural integrity, and cognitive measures of executive function in older adults (Gu et al., 2016; Witte et al., 2014).
Despite recent advances in understanding the impact of ω‐3 PUFAs on brain health, remarkably little is known about their role in shaping individual differences in functional brain connectivity. Indeed, dietary intake of ω‐3 PUFAs represent a primary source of individual differences in nutritional status (Ervin, Wright, Wang, & Kennedy‐Stephenson, 2004). Moreover, individuals exhibit sizeable inter‐individual differences in brain structure and function, which are closely linked to cognitive and behavioral traits (Seghier & Price, 2018). The present study therefore investigated whether plasma biomarkers of ω‐3 PUFAs reliably predict individual differences in the functional brain connectivity as measured by resting state functional magnetic resonance imaging (fMRI).
The emerging field of Network Neuroscience has established a data‐driven technique for connectome‐wide association studies that provides a comprehensive voxel‐wise survey of brain‐nutrition relationships to characterize individual differences in the functional brain connectome, entitled Multivariate Distance‐based Matrix Regression; MDMR; (Shehzad et al., 2014; Talukdar et al., 2017; Talukdar, Roman, Operskalski, Zwilling, & Barbey, 2018). This approach represents a significant methodological advance—breaking away from the standard assumption that brain‐nutrition associations are univariate, whereby nutrition is associated with only one functional connection at a time (i.e., between regions of interest or between voxels in a whole‐brain analysis). In this multivariate framework, the simultaneous contribution of entire sets of functional connections to ω‐3 PUFA status are evaluated, enabling the simultaneous assessment of multiple connections that may characterize the global effects of nutritional status on individual differences in functional connectivity more accurately.
The functional connectivity patterns obtained from MDMR can be further examined for their contributions to general, fluid, and crystallized intelligence. In particular, brain regions representing sources of inter‐individual variability are likely to exhibit differential network connectivity across the connectome—providing an index of global brain network influence that may predict cognitive performance (Barbey, 2018). Indeed, recent studies demonstrate that ω‐3 PUFA's are associated with increased functional brain activity and cognitive performance in healthy adults (Boespflug, McNamara, Eliassen, Schidler, & Krikorian, 2016; Bos et al., 2015), raising the question of whether these findings are also demonstrated in healthy older adults. Specifically, are ω‐3 PUFAs associated with individual differences in the functional brain connectome and do these neurobiological differences predict performance on tests of intelligence?
To investigate this hypothesis, we examined whether the global network influence of regions sensitive to ω‐3 PUFAs reliably predict general, fluid, and crystallized intelligence (as measured by the Wechsler Abbreviated Scale of Intelligence; WASI‐II). The present study therefore examined: (i) whether ω‐3 PUFA status is associated with individual differences in functional brain connectivity—conducting a connectome‐wide association study; and (ii) whether the global network influence of ω‐3 PUFA‐sensitive regions reliably predict performance on tests of intelligence. Thus, by conducting a comprehensive investigation based on a connectome‐wide association study, the present work examined the respects in which the functional brain connectome—spanning all regions and functional connections—is associated with ω‐3 PUFAs, moving beyond standard univariate methods to elucidate the global effects of ω‐3 PUFAs on individual differences in functional brain plasticity.
2. MATERIALS AND METHODS
2.1. Study participants
The present study examined 96 healthy elderly adult patients from the Illinois Elderly Adult Cohort recruited through Carle Foundation Hospital. The research conducted in the present study is unique and complements prior research conducted from this cohort (Zamroziewicz & Barbey, 2016, 2018; Zamroziewicz et al., 2015, 2018; Zamroziewicz, Paul, et al., 2017a, 2016a; Zamroziewicz, Talukdar, Zwilling, & Barbey, 2017b; Zamroziewicz, Zwilling, & Barbey, 2016b). No participants were cognitively impaired, as defined by a score of lower than 26 on the Mini‐Mental State Examination (Folstein, Folstein, & McHugh, 1975). Participants with a diagnosis of mild cognitive impairment, dementia, psychiatric illness within the last 3 years, stroke within the past 12 months, and cancer within the last 3 years were excluded. Participants were also excluded for current chemotherapy or radiation, an inability to complete study activities, prior involvement in cognitive training or dietary intervention studies, and contraindications for magnetic resonance imaging (MRI). All participants were right handed with normal, or corrected to normal vision and no contraindication for MRI.
2.2. Standard protocol approval and participant consent
This study was approved by the University of Illinois Institutional Review Board and the Carle Hospital Institutional Review Board and, in accordance with the stated guidelines, all participants read and signed informed consent documents.
2.3. Biomarker acquisition and analysis
Plasma lipids were extracted by the method of Folch, Lees, and Sloane Stanley (1957). Briefly, the internal standard (25 μg each of PC17:0) was added to 200 μl of serum, followed by 6 ml of choloroform:methanol:BHT (2:1:100 v/v/w). The protein precipitate was removed by centrifugation (2,500g, 5 min, 4 °C). Then 1.5 ml of 0.88% KCl was added to the supernatant, shaken vigorously, and the layers were allowed to settle for 5 min. The upper layer was discarded and 1 ml of distilled water:methanol (1:1 v/v) was added, the tube was shaken again and the layers allowed to settle for 15 min. The lower layer was transferred into a clean tube and evaporated to dryness under nitrogen. The phospholipid subfraction was separated by solid‐phase extraction using aminopropyl columns as described by Agren, Julkunen, and Penttila (1992). Then the phospholipid fraction was methylated by adding 2 ml of 14% BF3‐MeOH and incubating at 95°C for 1 hr (Morrison & Smith, 1964). The supernatant containing the fatty acid methyl esters (FAMEs) was dried down under nitrogen, resuspended in 100 μl of hexane, transferred into amber GC vials and stored at −20 °C until the time of analysis.
The phospholipid FAMEs were analyzed by a CLARUS 650 gas chromatograph (Perkin Elmer, Boston MA) equipped with a 100 m × 0.25 mm i.d (film thickness 0.25 μm) capillary column (SP‐2560, Supelco). Injector and flame ionization detector temperatures were 250 and 260 °C, respectively. Helium was used as the carrier gas (2.5 ml/min) and the split ratio was 14:1. The oven temperature was programmed at 80 °C, held for 16 min and then increased to 180 °C at a rate of 5 °C/min. After 10 min, the temperature was increased to 192 °C at a rate of 0.5 °C/min and held for 4 min. The final temperature was 250 °C reached at a rate of 405 °C/min and held for 15 min. Peaks of interest were identified by comparison with authentic fatty acid standards (Nu‐Chek Prep, Inc. MN). The plasma phospholipid lipids of interest were eicosapentaenoic acid (EPA, 20:5n‐3) and docosahexaenoic acid (DHA, 22:6n‐3). These fatty acids were used to generate an index of ω‐3 PUFA status, defined as the percentage of EPA + DHA of total red blood cell fatty acids (Harris, 2008). This index calculated for each participant was also adjusted for six potential confounding variables, including age (continuous), gender (nominal, man/woman), education (nominal, five fixed levels), income (nominal, six fixed levels), body mass index (continuous, hereafter BMI), and depression status (nominal, yes/no) in accordance with prior studies (Witte et al., 2014; Zamroziewicz, Talukdar, et al., 2017b).
2.4. Neuropsychological tests
General intelligence was measured by the Wechsler Abbreviated Scale of Intelligence—second edition (WASI‐II) (Stano, 1999). The WASI‐II assesses general intelligence by investigating performance on four subtests: block design, matrix reasoning, vocabulary, and similarities. In the block design subtest, participants were asked to reproduce pictured designs using specifically designed blocks as quickly and accurately as possible. In the matrix reasoning subtest, participants were asked to complete a matrix or serial reasoning problem by selecting the missing section from five response items. In the vocabulary subtest, participants were asked to verbally define vocabulary words (i.e., “What does lamp mean?”) that became progressively more challenging. In the similarities subtest, participants were asked to relate pairs of concepts (i.e., “How are a cow and bear alike?”) that became progressively more challenging. Per scoring guidelines, participants' raw scores were converted to standardized scores and combined into an estimated intelligence quotient score, which provided a measure of general intelligence. In addition, participants' fluid intelligence was assessed from the combined block design and matrix reasoning subtests; and their crystallized intelligence was assessed from the combined vocabulary and similarities subtests.
2.5. MRI data acquisition
All data were collected on a Siemens Magnetom 3 T Trio scanner using a 32‐channel head coil in the MRI Laboratory of the Beckman Institute Biomedical Imaging Center at the University of Illinois. A high‐resolution multi‐echo T1‐weighted magnetization prepared gradient‐echo structural image was acquired for each participant (0.9 mm isotropic, TR: 1,900 ms, TI: 900 ms, TE = 2.32 ms, with GRAPPA and an acceleration factor of 2). The functional neuroimaging data were acquired using an accelerated gradient‐echo echoplanar imaging (EPI) sequence (Auerbach, Xu, Yacoub, Moeller, & Ugurbil, 2013) sensitive to blood oxygenation level dependent (BOLD) contrast (2.5 × 2.5 × 3.0 mm voxel size, 38 slices with 10% slice gap, TR = 2,000 ms, TE = 25 ms, FOV = 230 mm, 90° flip angle, 7 min acquisition time). During the resting‐state fMRI scan, participants were shown a white crosshair on a black background viewed on a LCD monitor through a head coil‐mounted mirror. Participants were instructed to lie still, focus on the visually presented crosshair, and to keep their eyes open.
2.6. MRI data preprocessing
All MRI data processing was performed using FSL tools available in FMRIB Software Library version 5.0 (http://fsl.fmrib.ox.ac.uk/fsl/fslwiki/). The high‐resolution T1 Magnetization‐Prepared Rapid Gradient‐Echo (MPRAGE) was brain extracted using the Brain Extraction Tool (BET) (Smith, 2002). FMRIB's Automated Segmentation Tool (FAST) segmentation (Zhang, Brady, & Smith, 2001) was performed to delineate gray matter, white matter, and cerebral spinal fluid (CSF) voxels. The resting‐state fMRI data were pre‐processed using the FSL FMRI Preprocessing and Model‐Based Analysis (FEAT) analysis tool (Jenkinson, Beckmann, Behrens, Woolrich, & Smith, 2012; Satterthwaite et al., 2013). Pre‐processing entailed: slice timing correction, motion correction, spatial smoothing (3 mm full width at half maximum kernel), nuisance signal regression (described below), standard fMRI temporal bandpass filtering (0.009–0.1 Hz; 47,52), linear registration of functional images to structural images, and nonlinear registration of structural images to the MNI152 brain template (2 mm isotropic voxel resolution). Nuisance variables were modeled via General Linear Modeling (GLM) analyses to remove spurious correlations, noise introduced by head motion, and variables of no interest. These included head motion correction parameters (using the extended 12 motion parameters estimated in FEAT preprocessing), as well as modeling of individual volume motion outliers estimated using DVARS (Power, Barnes, Snyder, Schlaggar, & Petersen, 2012). Briefly, DVARS was used to identify shifts in global signal intensities between each successive volume, with outliers flagged using the boxplot cutoff 1.5 times interquartile range. White matter (WM) and cerebrospinal fluid (CSF) signals were also averaged across all voxels identified from the segmentation of the high resolution MPRAGE. The fully preprocessed resting state fMRI data was then residualized by regressing out the effect of both head motion and shifts in global signal intensities identified from DVARS, along with the mean WM and CSF signals through a GLM framework. The residuals were transformed into normalized MNI152 space and re‐sampled to 4 mm isotropic voxels in order to reduce computational complexity in post data processing for MDMR analysis.
2.7. Multivariate distance‐based matrix regression
MDMR was applied to investigate whether individual differences in resting state functional connectivity patterns were related to ω‐3 PUFA status. The MDMR analysis pipeline involves: (1) extracting resting state preprocessed BOLD time series signal from participants' fMRI scans; (2) computing a distance matrix indicating pairwise dissimilarity between participants' functional connectivity profiles for each brain region; (3) performing multivariate regression with ω‐3 PUFA status as input and the distance matrix computed for each brain region as output; and (4) generating a statistical map of brain regions, which have significant associations with individuals' ω‐3 PUFA status. MATLAB R2014a was used to generate code and analysis scripts for performing the MDMR analysis. Craddock's 800 parcellated brain atlas in MNI space (Craddock, James, Holtzheimer, Hu, & Mayberg, 2012) was applied as a mask to extract the mean BOLD time course from gray matter voxels within each parcel. A large parcellation consisting of 800 gray matter units was chosen in order to maintain regional specificity and also because reproducibility analysis by Shehzad et al. (2014) revealed substantial overlap at this resolution with whole‐brain, voxel‐wise MDMR analyses.
The distance matrix used in MDMR was derived from individual differences in functional connectivity profiles between each brain parcel. For each participant, functional connectivity was computed from pairwise correlations between mean BOLD time courses extracted from gray matter parcels that were common to all participants. A total of 665 parcellated regions comprising gray matter voxels across the whole brain were found to be common across all participants. The correlations were Fisher's Z‐transformed to improve normality. Next, dissimilarities between participants' functional connectivity profiles were calculated based on the distance metric , where, r represents the Pearson correlation between the connectivity profiles for a participant pair and brain region. All pairwise dissimilarities were then entered into a distance matrix. MDMR was then applied in the final step to test the degree to which ω‐3 PUFA status explained variability in the distances between participants' functional connectivity profiles at each region separately. MDMR is designed to identify the presence of an association between ω‐3 PUFA status and distances between subjects' functional connectivity patterns and, as a consequence, does not assess the directionality of the observed associations.
A pseudo‐F statistic was computed at each region/parcel representing the proportion of variance explained in ω‐3 PUFA status by the distances between participants' connectivity profiles. A p‐value was then computed for each region by comparing the pseudo‐F statistic from the original data to a simulated null distribution derived from performing 10,000 random permutations of the participant indices and computing the pseudo‐F statistic at each iteration. The p‐values were converted to one‐sided Z‐scores and adjusted for multiple comparisons using Gaussian Random Field (GRF) correction (Li, Guo, Nie, Li, & Liu, 2009). The Z‐scores were then projected back onto the MNI152 brain template. Next, FSL autoaq tool was used to determine center of mass (COM) coordinates of clustered regions by applying a one‐tailed voxel level threshold of Z > 1.6 (p < 0.05) and a minimum cluster size of 10 voxels.
2.8. Support vector regression
Prior research suggests that individual differences in functional brain connectivity predict performance on tests of intelligence (Talukdar et al., 2017, 2018; Barbey, 2018), motivating an investigation of whether the observed individual differences associated with ω‐3 PUFA status predict performance on these measures. To test this relationship, we applied support vector regression (SVR) to assess whether ω‐3 PUFA sensitive regions reliably predict measures of intelligence (general, fluid, and crystallized) based on their whole brain connectivity strength. We chose SVR over a standard multiple linear regression framework as SVR can operate on a high dimensional feature space and provides a sparse solution that is more generalizable and less prone to over‐fitting (Smola & Schölkopf, 2004). A linear SVR kernel was applied so that individual weights computed for each feature (the whole brain connectivity strength of each ω‐3 PUFA sensitive region) could be easily interpreted in terms of their relative contributions toward predicting scores derived for general, fluid, and crystallized intelligence. The analysis framework for SVR was conducted using the Python “scikit‐learn” machine learning modules (http://scikit-learn.org/stable/index.html). The SVR analysis entailed the following steps.
SVR Inputs. Inputs to SVR were comprised of whole brain connectivity strength values derived for each ω‐3 PUFA sensitive region. Graphs were constructed with nodes representing each of the 665 brain parcels and edges representing Fisher's Z‐transformed pairwise correlations between the mean time series extracted from the brain parcels. A Bonferroni‐corrected statistical Z‐threshold was applied to the edges in order to identify significant positive correlations (p < 0.05). The thresholded Z‐scores were next rescaled to represent connection weights ranging from 0 to 1. Subject‐wise whole brain connectivity strength values were then obtained for each ω‐3 PUFA sensitive region from the sum of weights of all edges linked to that region.
SVR Parameter Tuning. Linear kernel SVR requires tuning two meta‐parameters ε and C, which determine model complexity. The parameter ε is used to control the width of the “epsilon‐insensitive tube,” or loss function, such that points that fall inside the tube carry no loss. The parameter C controls the trade‐off between how strongly points beyond the epsilon‐insensitive tube are penalized and the flatness of the regression line (larger values of C allow the regression line to be less flat) (Dosenbach et al., 2010). Optimal combination of the meta‐parameters ε and C were determined separately for each input/output dataset comprising whole brain connectivity strength values and scores on corresponding measures of intelligence (general/fluid/crystallized). A grid search was performed on ε (0.001, 0.01, 0.1, 1, 5) and C (0.1, 1, 5, 10, 15) to select the optimal parameters, which yielded the best R‐squared value in the SVR model fit between each input/output dataset.
SVR Model Weights. Individual weights of the input variables, which are determined from the SVR model fit, indicate their relative contribution to the prediction of the output variables. SVR model weights for the ω‐3 PUFA sensitive regions were assessed separately for each of the three measures of intelligence. To determine the confidence interval for the SVR model weights, participants' input/output dataset were bootstrapped 10,000 times with replacement. SVR was then applied to the bootstrapped samples using the optimal parameters ε and C determined in step (2) with respect to each measure of intelligence. The SVR model fit on each bootstrapped sample was assessed from the standardized beta coefficient of the linear regression line representing the fit between the predicted and observed intelligence scores. The distribution of SVR model weights for each ω‐3 PUFA sensitive region was next determined from the bootstrapped SVR model fits, which produced significant correlations between predicted and observed intelligence scores (p < 0.01). Significance of each ω‐3 PUFA sensitive region in predicting intelligence scores was then determined from the 99% confidence interval of their mean SVR model weight and corrected for multiple comparisons using a false discovery rate q = 0.05.
SVR Weight Map. The ω‐3 PUFA sensitive regions that were found to be significant predictors of general, fluid, and crystallized intelligence scores were displayed on surface brain maps with their mean SVR model weights represented by standardized Z‐scores. Cluster peaks were identified from each of the three surface brain maps using FSL autoaq tool.
3. RESULTS
3.1. Participant characteristics
Our study sample comprised 96 older adults (age range: 65–70; mean age: 69 years; 61% females). Participant demographics are reported in Table 1.
Table 1.
Participant characteristics
| Demographics | N = 96 |
|---|---|
| Age in years (M ± SD) | 69 ± 3 |
| Female (%) | 61 |
| Education (%) | |
| Some high school | 1 |
| High school degree | 11 |
| Some college | 17 |
| College degree | 71 |
| Income (%) | |
| <$15,000 | 1 |
| $15,000–$25,000 | 3 |
| $25,000–$50,000 | 15 |
| $50,000–$75,000 | 23 |
| $75,000–$100,000 | 26 |
| >$100,000 | 32 |
| Body mass index (M ± SD) | 26 ± 4 |
| Depression indicated (%) | 5 |
| Plasma phospholipid nutrients | (M ± SD) |
| Eicosapentaenoic acid (20:5n‐3; μmol/L) | 24.9± 17.3 |
| (20:5n‐3; %FA) | 0.9 ± 0.6 |
| Docosahexaenoic acid (22:6n‐3; μmol/L) | 79.7 ± 32.5 |
| (22:6n‐3; %FA) | 3.0 ± 1.0 |
| ω‐3 PUFA status (%) | 3.9 ± 1.5 |
| Psychometrics | (M ± SD) |
| General intelligence score | 114 ± 13 |
| Fluid intelligence score | 112 ± 14 |
| Crystallized intelligence score | 113 ± 14 |
Abbreviations: M, mean; SD, standard deviation; %FA, percent of total red blood cell fatty acids.
3.2. Multivariate distance‐based matrix regression
We applied multivariate distance‐based matrix regression (MDMR) to investigate whether individual differences in functional brain connectivity were associated with nutrient biomarkers of ω‐3 PUFAs (see Methods section for details on the MDMR framework). Results from the MDMR analysis are presented in Figure 1a, which illustrates brain regions whose patterns of connectivity have significant associations with ω‐3 PUFA status (p < 0.05, cluster corrected using Gaussian random field theory, GRF). Table 2 presents cluster peaks of brain regions identified from the map in Figure 1a. A broadly distributed pattern of cortical regions was observed, including areas within the frontal (frontal pole and anterior cingulate gyrus), temporal (hippocampus and amygdala), parietal (posterior cingulate gyrus and precuneus), and occipital cortex (primary visual cortex and lateral occipital cortex) (see Table 2 and Figure 1a). As Figure 1a illustrates, several brain regions have large spatial extent. Specifically, the cluster peak region identified as the right cingulate gyrus (R. CNG: x = 6.3, y = 38.9, z = 10.2) extends to the anterior division in both the right and left hemispheres. In addition, the right precuneus (R. PCUN: x = 8.02, y = −56.4, z = 21.8) is part of a broadly distributed area that spans the precuneal regions, the posterior cingulate gyrus and also the lingual gyrus.
Figure 1.
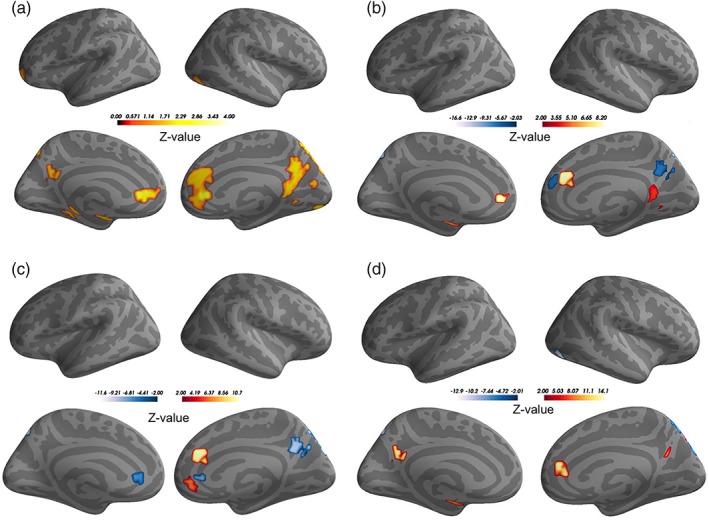
MDMR and SVR results. (a) Panels illustrate the MDMR statistical Z‐score map indicating brain regions whose inter‐individual variation in functional connectivity is significantly associated with ω‐3 PUFA status (p < 0.05, cluster corrected using GRF); (b–d) panels illustrate ω‐3 PUFA‐sensitive regions that reliably predict general intelligence, fluid intelligence and crystallized intelligence based on SVR. Color bar represents statistical Z‐score value [Color figure can be viewed at http://wileyonlinelibrary.com]
Table 2.
MDMR results: Listed are cluster peaks of brain regions having significant association with ω‐3 PUFA status (p < 0.05, cluster corrected using GRF)
| Region | Z stat | Cluster size | X | Y | Z |
|---|---|---|---|---|---|
| R. CNG | 2.75 | 1,176 | 6.3 | 38.9 | 10.2 |
| R. PCUN | 2.69 | 1,096 | 7.08 | −73.6 | 49.8 |
| R. PCUN | 1.99 | 1,088 | 8.02 | −56.4 | 21.8 |
| R. LOC | 2.03 | 496 | 50 | −71.7 | −13.9 |
| R. VC | 2.21 | 312 | 17.8 | −85.3 | −11.1 |
| L. AMG | 1.68 | 248 | −20.7 | −9.19 | −12.5 |
| L. FP | 1.91 | 184 | −31.4 | 54 | −2.04 |
| L. HIPP | 1.65 | 168 | −28.2 | −35.8 | −9.76 |
Each region name is presented in column 1, and the region's significance value, cluster size and the cluster center of mass in MNI coordinates are presented in columns 2–6 respectively. Abbreviations: L, left; R, right; Z stat, test statistic; CNG, cingulate gyrus; PCUN, precuneus; LOC, lateral occipital cortex; VC, primary visual cortex; AMG, amygdala; FP, frontal pole; HIPP, hippocampus.
3.3. Support vector regression
We investigated whether the global network influence of ω‐3 PUFA‐sensitive regions predict general, fluid, and crystallized intelligence (as measured by the WASI‐II battery). We applied linear support vector regression (SVR) with tuned parameters (ε = 1, C = 1, see Methods—SVR Parameter Tuning) to model the relationship between general intelligence scores and whole brain connectivity strength of ω‐3 PUFA‐sensitive regions. Subject‐wise whole brain connectivity strength measure was derived from 655 brain parcels/nodes representative of gray matter voxels, of which 20 brain parcels/nodes overlapped with the ω‐3 PUFA‐sensitive regions (see Methods—SVR Inputs). The connectivity strength of these 20 brain parcels/nodes and general intelligence scores were fit by a SVR model with 10,000 bootstrap samples. This model produced a mean correlation coefficient r = 0.450 between the predicted and observed general intelligence scores. As a further test, 9,820 out of the 10,000 bootstrapped samples also produced significant correlations (p < 0.01) with mean correlation coefficient r = 0.454. Overall, the SVR model revealed that 7 of the 20 ω‐3 PUFA‐sensitive brain parcels/nodes significantly predicted general intelligence scores (FDR, p < 0.05). The relative contribution of these regions in predicting general intelligence scores is shown by the weight map in Figure 1b. These weights standardized to Z‐scores reflect the mean bootstrapped SVR model weights assessed at the 99% confidence interval and corrected for multiple comparisons (see Methods—SVR Model Weights). As Table 3 illustrates, the identified regions include areas within the prefrontal cortex (paracingulate and anterior cingulate gyrus), in addition to temporal and parietal lobe structures (amygdala, posterior cingulate gyrus, and precuneus). Each of these regions contributes differentially to the prediction of general intelligence scores. The left and right anterior cingulate regions, the right posterior cingulate region, and the left amygdala demonstrated positive weights. A positive weight indicates that higher whole brain connectivity strength is associated with greater general intelligence scores. The right paracingulate gyrus and the right precuneus, on the other hand, have negative weights, which indicates that lower whole brain connectivity strength in these regions are associated with higher general intelligence scores.
Table 3.
SVR results: Listed are cluster peaks of ω‐3 PUFA‐sensitive regions predictive of general intelligence scores
| Region | Z stat | Cluster size | X | Y | Z |
|---|---|---|---|---|---|
| R. PCUN | −5.49 | 296 | 11.6 | −56.8 | 32.6 |
| L. PCUN | −16.7 | 264 | −2.21 | −75.6 | 47.2 |
| R. CNG | 5.37 | 256 | 10.7 | −50.9 | 7.38 |
| L. AMG | 5.58 | 248 | −20.7 | −9.19 | −12.5 |
| R. CNG | 11.3 | 240 | 11.3 | 31.9 | 22.5 |
| R. PCNG | −5.36 | 200 | 9.72 | 44.2 | 20.6 |
| L. CNG | 8.2 | 176 | −5.36 | 46.6 | 5.91 |
Peaks were identified from the SVR weight map indicating relative contribution of ω‐3 PUFA‐sensitive regions toward predicting general intelligence.
Each region name is presented in column 1; columns 2–6 represent the SVR weight standardized to Z‐score, cluster size and the cluster center of mass in MNI coordinates, respectively. Abbreviations: L, left; R, right; Z stat, test statistic; CNG, cingulate gyrus; PCNG, paracingulate gyrus; PCUN, precuneus; AMG, amygdala.
The SVR results for the fluid and crystallized intelligence measures are shown in Figure 1c,d. SVR model fitting for both these measures was carried out using tuned parameters ε = 1, C = 0.1 and produced significant correlations between the predicted and observed measures for each type. Specifically, 9,726 out of the 10,000 bootstrapped samples produced significant correlations (p < 0.01) between predicted and observed fluid intelligence measures, having a mean correlation coefficient of r = 0.43. Table 4 indicates cluster peak regions identified from the SVR weight map (see Figure 1c) showing relative contribution of the ω‐3 PUFA‐sensitive brain regions, which significantly predicted fluid intelligence measures (FDR, p < 0.05). The observed regions largely overlap with the SVR weight map obtained for the general intelligence measure (see Figure 1b). However, several distinct regions were also observed, including the right paracingulate gyrus, which demonstrated a positive weight, and the left anterior cingulate gyrus and right lateral occipital cortex, both of which exhibited negative weights.
Table 4.
SVR results: Listed are cluster peaks of ω‐3 PUFA‐sensitive regions predictive of fluid intelligence
| Region | Z stat | Cluster size | X | Y | Z |
|---|---|---|---|---|---|
| R. PCUN | −14.8 | 544 | 3.62 | −77.5 | 45.4 |
| R. PCUN | −8.72 | 296 | 11.6 | −56.8 | 32.6 |
| R. CNG | 10.7 | 240 | 11.3 | 31.9 | 22.5 |
| R. LOCC | 7.67 | 216 | 52 | −64.9 | −17.3 |
| R. PCNG | 6.43 | 192 | 12 | 39 | −2.33 |
| L. CNG | −7.54 | 184 | −0.91 | 37.2 | 3.17 |
Peaks were identified from the SVR weight map indicating relative contribution of ω‐3 PUFA‐sensitive regions toward predicting fluid intelligence test scores assessed from the combined block design and matrix reasoning subtest scores.
Each region name is presented in column 1; columns 2–6 represent the SVR weight standardized to Z‐score, cluster size and the cluster center of mass in MNI coordinates, respectively. Abbreviations: L, left; R, right; Z stat, test statistic; CNG, cingulate gyrus; PCNG, paracingulate gyrus; PCUN, precuneus; LOCC, lateral occipital cortex.
In the case of crystallized intelligence, SVR model fitting resulted in 9,824 out of the 10,000 bootstrapped samples having significant correlations (p < 0.01) between the predicted and observed measurement data, with a mean correlation coefficient of r = 0.44. The SVR weight map is displayed in Figure 1d and the corresponding cluster peak regions identified are listed in Table 5. The observed regions, which have largely positive weights, include the right anterior cingulate gyrus, posterior cingulate gyrus in the left and right hemispheres, as well as the right amygdala. Negatively weighted regions were also identified, including the right precuneus and right lateral occipital cortex.
Table 5.
SVR results: Listed are cluster peaks of ω‐3 PUFA‐sensitive regions predictive of crystallized intelligence
| Region | Z stat | Cluster size | X | Y | Z |
|---|---|---|---|---|---|
| R. PCUN | −8.58 | 824 | 4.34 | −74.6 | 48.7 |
| R. LOCC | −12.9 | 280 | 48.1 | −78.1 | −10.7 |
| R. LOCC | 6.59 | 272 | 19.5 | −72.4 | 51 |
| L. AMG | 7.47 | 248 | −20.7 | −9.19 | −12.5 |
| L. CNG | 13 | 224 | −2.14 | −55.6 | 27 |
| R. CNG | 14.2 | 184 | 11.2 | 37.2 | 10.8 |
Peaks were identified from the SVR weight map indicating relative contribution of ω‐3 PUFA‐sensitive regions toward predicting crystallized intelligence test scores assessed from the combined vocabulary and similarities subtest scores.
Each region name is presented in column 1; columns 2–6 represent the SVR weight standardized to Z‐score, cluster size and the cluster center of mass in MNI coordinates, respectively. Abbreviations: L, left; R, right; Z stat, test statistic; CNG, cingulate gyrus; PCNG, paracingulate gyrus; PCUN, precuneus; AMG, amygdala; LOCC, lateral occipital cortex.
4. DISCUSSION
By conducting a comprehensive investigation based on connectome‐wide association study methods, the present study examined the respects in which the functional brain connectome—spanning all regions and functional connections—is associated with ω‐3 PUFAs. Our findings support the following primary conclusions.
4.1. Brain regions sensitive to ω‐3 PUFA status
The MDMR findings lend support to previous functional neuroimaging studies demonstrating that ω‐3 PUFAs are associated with increased functional connectivity within frontal lobe regions mediating executive functions and temporal lobe structures involved in memory and emotion (Almeida, Jandacek, Weber, & McNamara, 2017; McNamara et al., 2010, 2013). In addition, these findings motivate fundamental questions about the neurobiological pathways that link ω‐3 PUFAs to individual differences in functional brain connectivity. Although direct evidence to address this issue is not currently available, prior research has identified multiple, complementary mechanisms that warrant further investigation. For example, evidence indicates that ω‐3 PUFAs may influence the production of growth factors, such as the Brain Derived Neurotrophic Factor (BDNF), which promote neuronal survival, growth and differentiation (Jiang et al., 2009). By inducing production of BDNF, ω‐3 PUFAs may support neurogenesis and synaptic transmission, thereby affecting functional connectivity between brain regions (Thomason, Yoo, Glover, & Gotlib, 2009). ω‐3 PUFAs are also known to enhance cerebral blood flow through vasodilation (Calder, 2006; Sinn & Howe, 2008). The maintenance of cerebral blood flow is critical for normal brain function as neurons require a constant supply of oxygen and nutrients. ω‐3 PUFAs may therefore impact functional connectivity by enhancing cerebral blood flow through vasodilation (Sinn & Howe, 2008).
4.2. Global network influence and general intelligence
We applied SVR to identify ω‐3 PUFA‐sensitive regions that reliably predict general intelligence. Our SVR findings revealed a core set of regions (see Figure 1b), whose global network influence reliably predicted general intelligence, including the anterior cingulate gyrus, the posterior cingulate gyrus, and the amygdala. The anterior and posterior cingulate, for example, are known to mediate self‐referential judgments, decision making, and attentional modulation (Buckner, Andrews‐Hanna, & Schacter, 2008)—cognitive skills that represent executive control processes. The amygdala, on the other hand, is involved in social and emotional information processing (Cabeza & St Jacques, 2007; Sheline et al., 2009).
In addition, we observed that global network influence of the precuneus and the paracingulate gyrus was negatively associated with general intelligence. The precuneus is known to support memory (e.g., episodic memory retrieval) and attention (e.g., orientation and shifting), in addition to core visual processes (Fletcher et al., 1995; Lundstrom et al., 2003). The paracingulate gyrus is known to support executive functions required for social information processing, such as inferring others' thoughts and beliefs (Amodio & Frith, 2006; Van Overwalle, 2009). Evidence further indicates that these regions are functionally disengaged at rest but become active in cognitively demanding executive and attentional control tasks (Gusnard, Akbudak, Shulman, & Raichle, 2001; Loose, Kaufmann, Auer, & Lange, 2003). Thus, whole brain connectivity within these regions may vary as a function of specific cognitive demands.
4.3. Global network influence and fluid intelligence
The present study investigated whether ω‐3 PUFA‐sensitive regions predict fluid intelligence, a core facet of general intelligence that reflects adaptive reasoning and problem solving skills (Carroll, 1993). The SVR results (Figure 1c) reveal regions within frontal and parietal cortex, which have been widely implicated in general intelligence and executive functions (Barbey, Colom, & Grafman, 2013; Barbey et al., 2012). Specifically, the anterior cingulate gyrus and paracingulate gyrus, which are engaged by tasks that require cognitive control processes (Ramnani & Owen, 2004), show positive associations between their whole brain connectivity strength and fluid intelligence.
In addition, regions whose whole brain connectivity strength was negatively related to fluid intelligence were observed, including the precuneus and lateral occipital cortex. The precuneus is known to play a central role in episodic memory retrieval (Fletcher et al., 1995; Lundstrom et al., 2003) and the lateral occipital cortex mediates visual information processing (Grill‐Spector, Kourtzi, & Kanwisher, 2001). The negative weights within these regions suggest that fluid intelligence relies less on neural mechanisms for episodic memory and visual processing compared with frontal and parietal regions that support executive control and adaptive decision making skills that are central to fluid intelligence (Cole, Yarkoni, Repovs, Anticevic, & Braver, 2012; Gray, Chabris, & Braver, 2003).
4.4. Global network influence and crystallized intelligence
Crystallized intelligence refers to the use of prior knowledge and experience to solve familiar problems (Carroll, 1993). The SVR results revealed several brain regions, including the amygdala and anterior and posterior cingulate gyrus, whose whole brain connectivity strength was positively associated with crystallized intelligence (see Figure 1d). The amygdala together with the anterior cingulate gyrus has been implicated in recognition memory (Canli, Zhao, Desmond, Glover, & Gabrieli, 1999; Kensinger, Addis, & Atapattu, 2011), while the posterior cingulate gyrus is known to support episodic memory retrieval (Nielsen, Balslev, & Hansen, 2005). These memory processes contribute to representations of prior knowledge and experience, and therefore play an important role in crystallized intelligence. In addition, we observed that whole brain connectivity strength within the precuneus and lateral occipital cortex—regions implicated in visual and spatial processing (Cavanna & Trimble, 2006; Grill‐Spector et al., 2001)—exhibited a negative association with crystallized intelligence. This finding suggests that crystallized intelligence is less dependent upon mechanisms for visual and spatial processing as demonstrated by the reduced network influence within the precuneus and lateral occipital cortex.
4.5. Implications of ω‐3 PUFAs on healthy brain aging
Prior research has demonstrated that ω‐3 PUFAs have a host of beneficial effects on brain health and therefore have important implications for cognitive aging (Bos et al., 2016; McNamara et al., 2018). Specifically, aging is linked to decline in cognitive abilities such as adaptive reasoning and problem solving skills (e.g., fluid intelligence) (Johnson et al., 2007) and is known to impact executive function and memory (Buckner, 2004; Schacter, Kaszniak, Kihlstrom, & Valdiserri, 1991). Recent advances in neuroimaging have enabled the study of structural and functional brain changes that are associated with cognitive aging (Buckner, 2004). Evidence from structural MRI demonstrates age‐related changes in gray matter volume and white matter structural integrity. Age‐related atrophy has been observed across the entire cerebral cortex, for example spanning the superior frontal, middle frontal, and superior parietal cortex (Lockhart & DeCarli, 2014). Many subcortical regions are also affected, including the caudate nucleus, cerebellum, and hippocampus (Raz, 2005). Diffusion tensor imaging provides another method for measuring age‐related changes in brain structure by assessing the microstructural integrity of cerebral white matter fiber tracts, which can deteriorate with age and lead to a reduction in structural connectivity between brain regions (Betzel et al., 2014). Several studies have demonstrated reduced microstructural integrity of tracts in the frontal lobe, parietal lobe, and corpus callosum during aging (Nusbaum, Tang, Buchsbaum, Wei, & Atlas, 2001; O'Sullivan et al., 2001).
Age‐related changes in brain function have also been investigated by functional neuroimaging studies (Park & Reuter‐Lorenz, 2009). Evidence demonstrates that aging is associated with greater activity in prefrontal cortical regions and weaker activity in posterior regions (Davis et al., 2008; Stuss & Knight, 2013); reduced asymmetry in activity of the prefrontal cortex (Cabeza, 2002); and changes in functional connectivity between brain regions (Lockhart & DeCarli, 2014). In addition, functional networks that mediate self‐referential processing, cognitive control, and attention, also demonstrated age‐related decline (Betzel et al., 2014; Marstaller, Williams, Rich, Savage, & Burianova, 2015). Aging is associated with a reduction in within network connections (as indexed by modularity), indicating that functional networks become less differentiated with age (Geerlings et al., 2014).
Our MDMR findings indicate that ω‐3 PUFA sensitive regions overlap with many of the brain regions implicated in the cognitive aging literature. Several of the ω‐3 PUFAs sensitive regions, such as the frontal pole, hippocampus, amygdala, precuneus and the posterior cingulate gyrus, have been shown to be vulnerable to aging and exhibit atrophy in older adults (Fjell et al., 2009, 2013; West, 1996). Our MDMR findings provide further evidence that ω‐3 PUFAs are associated with functional connectivity patterns primarily within the frontal and parietal cortex—areas that support cognitive control and attention. Results from the SVR analysis complement the MDMR findings by revealing that the underlying network connectivity within many of the ω‐3 PUFA sensitive regions is predictive of cognitive operations linked to executive functions, attention and memory. These findings motivate further investigation of whether ω‐3 PUFAs confer beneficial effects on functional brain connectivity and serve to promote the health and longevity of brain regions and associated cognitive skills that are highly susceptible to the effects of aging (Betzel et al., 2014; Marstaller et al., 2015).
5. LIMITATIONS
Although the current study represents one of the largest and most comprehensive investigations of the contributions of ω‐3 PUFAs to individual differences in the functional brain connectivity, it is important to present our findings in the light of several limitations. First, the results of the present cross‐sectional study motivate a nutritional intervention study to investigate the effects of ω‐3 PUFAs on functional brain connectivity. A central question is whether the regions discovered in the present study are indeed impacted by nutritional supplementation of ω‐3 PUFAs. Second, future research should investigate whether nutritional supplementation of ω‐3 PUFAs has favorable effects on the brain regions, networks, and cognitive skills observed in the present study. Third, as this study is based on an individual difference framework, our findings are sensitive to the demographic characteristics of the study sample. Thus, to better understand the impact of ω‐3 PUFAs on functional brain connectivity, future research should investigate the extent to which the reported findings replicate in more diverse populations (e.g., with respect to age, cognitive ability and also gender). Fourth, research investigating the mechanisms by which ω‐3 PUFAs influence functional brain connectivity is needed to further elucidate the role of diet and nutrition in healthy brain aging.
6. CONCLUSION
While this study is cross‐sectional in nature, our findings provide the basis for targeting specific brain regions in longitudinal studies investigating the effects of ω‐3 PUFAs on functional brain plasticity. Future longitudinal studies should examine the functional connectivity patterns within these regions and how they change over the course of a nutritional intervention—in an effort to further elucidate how the functional brain connectome is shaped by diet and nutrition to produce beneficial effects on cognition. These discoveries will increase our ability to identify abnormalities in nutrition‐related neural circuits and networks relevant to health, aging, and disease. Future investigations of the neural circuits identified through nutritional intervention studies will enhance our understanding of their functional significance, ultimately improving our ability to diagnose and possibly treat a wide range of health and age‐related neurological disorders.
CONFLICT OF INTERESTS
This work was supported by a grant from Abbott Nutrition through the Center for Nutrition, Learning, and Memory at the University of Illinois (ANGC1205; PI: Barbey). Dr. Barbey is a member of the Center for Nutrition Learning and Memory, and serves on the Scientific Advisory Board for the Institute of Inflammation and Ageing at the University of Birmingham, UK, and at Natrol, a vitamin and supplement producer.
ACKNOWLEDGMENT
We are thankful to Erick J. Paul and Evan Anderson for their help with data processing; Joachim Operskalski and Nikolai Sherepa for their contribution with testing of the participants; and Kyle Liang for his comments on computational methods. We also thank Dr. Gene Bowman for helpful discussions of this work and Dr. Elizabeth Johnson and her colleagues at Tufts University for conducting the biomarker assays presented in this study. Finally, we would like to thank the Illinois Brain Aging study participants for their invaluable contributions.
Talukdar T, Zamroziewicz MK, Zwilling CE, Barbey AK. Nutrient biomarkers shape individual differences in functional brain connectivity: Evidence from omega‐3 PUFAs. Hum Brain Mapp. 2019;40:1887–1897. 10.1002/hbm.24498
Funding information: Abbott Nutrition
Contributor Information
Tanveer Talukdar, Email: ttanveer@illinois.edu.
Aron K. Barbey, Email: barbey@illinois.edu.
REFERENCES
- Agren, J. J. , Julkunen, A. , & Penttila, I. (1992). Rapid separation of serum lipids for fatty acid analysis by a single aminopropyl column. Journal of Lipid Research, 33, 1871–1876. [PubMed] [Google Scholar]
- Almeida, D. M. , Jandacek, R. J. , Weber, W. A. , & McNamara, R. K. (2017). Docosahexaenoic acid biostatus is associated with event‐related functional connectivity in cortical attention networks of typically developing children. Nutritional Neuroscience, 20, 246–254. [DOI] [PubMed] [Google Scholar]
- Amodio, D. M. , & Frith, C. D. (2006). Meeting of minds: The medial frontal cortex and social cognition. Nature Reviews. Neuroscience, 7, 268–277. [DOI] [PubMed] [Google Scholar]
- Auerbach, E. J. , Xu, J. , Yacoub, E. , Moeller, S. , & Ugurbil, K. (2013). Multiband accelerated spin‐echo echo planar imaging with reduced peak RF power using time‐shifted RF pulses. Magnetic Resonance in Medicine, 69, 1261–1267. [DOI] [PMC free article] [PubMed] [Google Scholar]
- Barbey, A. K. (2018). Network neuroscience theory of human intelligence. Trends in Cognitive Sciences, 22, 8–20. [DOI] [PubMed] [Google Scholar]
- Barbey, A. K. , Colom, R. , & Grafman, J. (2013). Architecture of cognitive flexibility revealed by lesion mapping. NeuroImage, 82, 547–554. [DOI] [PMC free article] [PubMed] [Google Scholar]
- Barbey, A. K. , Colom, R. , Solomon, J. , Krueger, F. , Forbes, C. , & Grafman, J. (2012). An integrative architecture for general intelligence and executive function revealed by lesion mapping. Brain, 135, 1154–1164. [DOI] [PMC free article] [PubMed] [Google Scholar]
- Betzel, R. F. , Byrge, L. , He, Y. , Goñi, J. , Zuo, X.‐N. , & Sporns, O. (2014). Changes in structural and functional connectivity among resting‐state networks across the human lifespan. NeuroImage, 102, 345–357. [DOI] [PubMed] [Google Scholar]
- Boespflug, E. L. , McNamara, R. K. , Eliassen, J. C. , Schidler, M. D. , & Krikorian, R. (2016). Fish oil supplementation increases event‐related posterior cingulate activation in older adults with subjective memory impairment. The Journal of Nutrition, Health & Aging, 20, 161–169. [DOI] [PubMed] [Google Scholar]
- Bos, D. J. , Oranje, B. , Veerhoek, E. S. , Van Diepen, R. M. , Weusten, J. M. , Demmelmair, H. , … Durston, S. (2015). Reduced symptoms of inattention after dietary omega‐3 fatty acid supplementation in boys with and without attention deficit/hyperactivity disorder. Neuropsychopharmacology, 40, 2298–2306. [DOI] [PMC free article] [PubMed] [Google Scholar]
- Bos, D. J. , van Montfort, S. J. T. , Oranje, B. , Durston, S. , & Smeets, P. A. M. (2016). Effects of omega‐3 polyunsaturated fatty acids on human brain morphology and function: What is the evidence? European Neuropsychopharmacology, 26, 546–561. [DOI] [PubMed] [Google Scholar]
- Buckner, R. L. (2004). Memory and executive function in aging and AD: Multiple factors that cause decline and reserve factors that compensate. Neuron, 44, 195–208. [DOI] [PubMed] [Google Scholar]
- Buckner, R. L. , Andrews‐Hanna, J. R. , & Schacter, D. L. (2008). The brain's default network: Anatomy, function, and relevance to disease. Annals of the New York Academy of Sciences, 1124, 1–38. [DOI] [PubMed] [Google Scholar]
- Cabeza, R. (2002). Hemispheric asymmetry reduction in older adults: The HAROLD model. Psychol Aging, 17, 85–100. [DOI] [PubMed] [Google Scholar]
- Cabeza, R. , & St Jacques, P. (2007). Functional neuroimaging of autobiographical memory. Trends in Cognitive Sciences, 11, 219–227. [DOI] [PubMed] [Google Scholar]
- Calder, P. C. (2006). N‐3 polyunsaturated fatty acids, inflammation, and inflammatory diseases. The American Journal of Clinical Nutrition, 83, 1505S–1519S. [DOI] [PubMed] [Google Scholar]
- Canli, T. , Zhao, Z. , Desmond, J. E. , Glover, G. , & Gabrieli, J. D. E. (1999). fMRI identifies a network of structures correlated with retention of positive and negative emotional memory. Psychobiology, 27, 441–452. [Google Scholar]
- Carroll, J. B. (1993). Human cognitive abilities: A survey of factor‐analytic studies. New York, NY: Cambridge University Press. [Google Scholar]
- Cavanna, A. E. , & Trimble, M. R. (2006). The precuneus: A review of its functional anatomy and behavioural correlates. Brain, 129, 564–583. [DOI] [PubMed] [Google Scholar]
- Chalon, S. (2006). Omega‐3 fatty acids and monoamine neurotransmission. Prostaglandins, Leukotrienes, and Essential Fatty Acids, 75, 259–269. [DOI] [PubMed] [Google Scholar]
- Chang, C. Y. , Ke, D. S. , & Chen, J. Y. (2009). Essential fatty acids and human brain. Acta Neurologica Taiwanica, 18, 231–241. [PubMed] [Google Scholar]
- Cole, M. W. , Yarkoni, T. , Repovs, G. , Anticevic, A. , & Braver, T. S. (2012). Global connectivity of prefrontal cortex predicts cognitive control and intelligence. The Journal of Neuroscience, 32, 8988–8999. [DOI] [PMC free article] [PubMed] [Google Scholar]
- Craddock, R. C. , James, G. A. , Holtzheimer, P. E., 3rd , Hu, X. P. , & Mayberg, H. S. (2012). A whole brain fMRI atlas generated via spatially constrained spectral clustering. Human Brain Mapping, 33, 1914–1928. [DOI] [PMC free article] [PubMed] [Google Scholar]
- Davis, S. W. , Dennis, N. A. , Daselaar, S. M. , Fleck, M. S. , & Cabeza, R. (2008). Que PASA? The posterior‐anterior shift in aging. Cerebral Cortex (New York, N Y : 1991), 18, 1201–1209. [DOI] [PMC free article] [PubMed] [Google Scholar]
- Dosenbach, N. U. , Nardos, B. , Cohen, A. L. , Fair, D. A. , Power, J. D. , Church, J. A. , … Lessov‐Schlaggar, C. N. (2010). Prediction of individual brain maturity using fMRI. Science, 329, 1358–1361. [DOI] [PMC free article] [PubMed] [Google Scholar]
- Ervin, R. B. , Wright, J. D. , Wang, C. Y. , & Kennedy‐Stephenson, J. (2004). Dietary intake of fats and fatty acids for the United States population: 1999‐2000. Advance Data, 8, 1–6. [PubMed] [Google Scholar]
- Fjell, A. M. , McEvoy, L. , Holland, D. , Dale, A. M. , Walhovd, K. B. , & Initiat, A. D. N. (2013). Brain changes in older adults at very low risk for Alzheimer's disease. Journal of Neuroscience, 33, 8237. [DOI] [PMC free article] [PubMed] [Google Scholar]
- Fjell, A. M. , Walhovd, K. B. , Fennema‐Notestine, C. , McEvoy, L. K. , Hagler, D. J. , Holland, D. , … Dale, A. M. (2009). One‐year brain atrophy evident in healthy aging. The Journal of Neuroscience, 29, 15223–15231. [DOI] [PMC free article] [PubMed] [Google Scholar]
- Fletcher, P. C. , Frith, C. D. , Baker, S. C. , Shallice, T. , Frackowiak, R. S. , & Dolan, R. J. (1995). The mind's eye‐‐precuneus activation in memory‐related imagery. NeuroImage, 2, 195–200. [DOI] [PubMed] [Google Scholar]
- Folch, J. , Lees, M. , & Sloane Stanley, G. H. (1957). A simple method for the isolation and purification of total lipides from animal tissues. The Journal of Biological Chemistry, 226, 497–509. [PubMed] [Google Scholar]
- Folstein, M. F. , Folstein, S. E. , & McHugh, P. R. (1975). "mini‐mental state". A practical method for grading the cognitive state of patients for the clinician. Journal of Psychiatric Research, 12, 189–198. [DOI] [PubMed] [Google Scholar]
- Geerligs, L. , Renken, R. J. , Saliasi, E. , Maurits, N. M. , & Lorist, M. M. (2014). A brain‐wide study of age‐related changes in functional connectivity. Cerebral Cortex, 25, 1987–1999. [DOI] [PubMed] [Google Scholar]
- Gray, J. R. , Chabris, C. F. , & Braver, T. S. (2003). Neural mechanisms of general fluid intelligence. Nature Neuroscience, 6, 316–322. [DOI] [PubMed] [Google Scholar]
- Grill‐Spector, K. , Kourtzi, Z. , & Kanwisher, N. (2001). The lateral occipital complex and its role in object recognition. Vision Research, 41, 1409–1422. [DOI] [PubMed] [Google Scholar]
- Gu, Y. , Vorburger, R. S. , Gazes, Y. , Habeck, C. G. , Stern, Y. , Luchsinger, J. A. , … Brickman, A. M. (2016). White matter integrity as a mediator in the relationship between dietary nutrients and cognition in the elderly. Annals of Neurology, 79, 1014–1025. [DOI] [PMC free article] [PubMed] [Google Scholar]
- Gusnard, D. A. , Akbudak, E. , Shulman, G. L. , & Raichle, M. E. (2001). Medial prefrontal cortex and self‐referential mental activity: Relation to a default mode of brain function. Proceedings of the National Academy of Sciences of the United States of America, 98, 4259–4242. [DOI] [PMC free article] [PubMed] [Google Scholar]
- Harris, W. S. (2008). The omega‐3 index as a risk factor for coronary heart disease. The American Journal of Clinical Nutrition, 87, 1997S–2002S. [DOI] [PubMed] [Google Scholar]
- Jenkinson, M. , Beckmann, C. F. , Behrens, T. E. J. , Woolrich, M. W. , & Smith, S. M. (2012). Fsl. NeuroImage, 62, 782–790. [DOI] [PubMed] [Google Scholar]
- Jiang, L.‐h. , Shi, Y. , Wang, L.‐s. , & Yang, Z.‐r. (2009). The influence of orally administered docosahexaenoic acid on cognitive ability in aged mice. The Journal of Nutritional Biochemistry, 20, 735–741. [DOI] [PubMed] [Google Scholar]
- Johnson, J. K. , Lui, L.‐Y. , & Yaffe, K. (2007). Executive function, more than global cognition, predicts functional decline and mortality in elderly women. Journal of Gerontology. Series A, Biological Sciences and Medical Sciences, 62, 1134–1141. [DOI] [PMC free article] [PubMed] [Google Scholar]
- Kensinger, E. A. , Addis, D. R. , & Atapattu, R. K. (2011). Amygdala activity at encoding corresponds with memory vividness and with memory for select episodic details. Neuropsychologia, 49, 663–673. [DOI] [PMC free article] [PubMed] [Google Scholar]
- Kidd, P. M. (2007). Omega‐3 DHA and EPA for cognition, behavior, and mood: Clinical findings and structural‐functional synergies with cell membrane phospholipids. Alternative Medicine Review, 12, 207–227. [PubMed] [Google Scholar]
- Kobe, T. , Witte, A. V. , Schnelle, A. , Lesemann, A. , Fabian, S. , Tesky, V. A. , … Floel, A. (2016). Combined omega‐3 fatty acids, aerobic exercise and cognitive stimulation prevents decline in gray matter volume of the frontal, parietal and cingulate cortex in patients with mild cognitive impairment. NeuroImage, 131, 226–238. [DOI] [PubMed] [Google Scholar]
- Li, K. , Guo, L. , Nie, J. , Li, G. , & Liu, T. (2009). Review of methods for functional brain connectivity detection using fMRI. Computerized Medical Imaging and Graphics, 33, 131–139. [DOI] [PMC free article] [PubMed] [Google Scholar]
- Lockhart, S. N. , & DeCarli, C. (2014). Structural imaging measures of brain aging. Neuropsychology Review, 24, 271–289. [DOI] [PMC free article] [PubMed] [Google Scholar]
- Loose, R. , Kaufmann, C. , Auer, D. P. , & Lange, K. W. (2003). Human prefrontal and sensory cortical activity during divided attention tasks. Human Brain Mapping, 18, 249–259. [DOI] [PMC free article] [PubMed] [Google Scholar]
- Lundstrom, B. N. , Petersson, K. M. , Andersson, J. , Johansson, M. , Fransson, P. , & Ingvar, M. (2003). Isolating the retrieval of imagined pictures during episodic memory: Activation of the left precuneus and left prefrontal cortex. NeuroImage, 20, 1934–1943. [DOI] [PubMed] [Google Scholar]
- Marstaller, L. , Williams, M. , Rich, A. , Savage, G. , & Burianova, H. (2015). Aging and large‐scale functional networks: White matter integrity, gray matter volume, and functional connectivity in the resting state. Neuroscience, 290, 369–378. [DOI] [PubMed] [Google Scholar]
- McNamara, R. K. , Able, J. , Jandacek, R. , Rider, T. , Tso, P. , Eliassen, J. C. , … Adler, C. M. (2010). Docosahexaenoic acid supplementation increases prefrontal cortex activation during sustained attention in healthy boys: A placebo‐controlled, dose‐ranging, functional magnetic resonance imaging study. The American Journal of Clinical Nutrition, 91, 1060–1067. [DOI] [PMC free article] [PubMed] [Google Scholar]
- McNamara, R. K. , Asch, R. H. , Lindquist, D. M. , & Krikorian, R. (2018). Role of polyunsaturated fatty acids in human brain structure and function across the lifespan: An update on neuroimaging findings. Prostaglandins, Leukotrienes, and Essential Fatty Acids, 136, 23–34. [DOI] [PMC free article] [PubMed] [Google Scholar]
- McNamara, R. K. , Jandacek, R. , Tso, P. , Weber, W. , Chu, W.‐J. , Strakowski, S. M. , … Delbello, M. P. (2013). Low docosahexaenoic acid status is associated with reduced indices in cortical integrity in the anterior cingulate of healthy male children: A 1H MRS study. Nutritional Neuroscience, 16, 183–190. [DOI] [PMC free article] [PubMed] [Google Scholar]
- Morrison, W. R. , & Smith, L. M. (1964). Preparation of fatty acid methyl esters and dimethylacetals from lipids with boron fluoride–methanol. Journal of Lipid Research, 5, 600–608. [PubMed] [Google Scholar]
- Nielsen, F. A. , Balslev, D. , & Hansen, L. K. (2005). Mining the posterior cingulate: Segregation between memory and pain components. NeuroImage, 27, 520–532. [DOI] [PubMed] [Google Scholar]
- Nusbaum, A. O. , Tang, C. Y. , Buchsbaum, M. S. , Wei, T. C. , & Atlas, S. W. (2001). Regional and global changes in cerebral diffusion with normal aging. American Journal of Neuroradiology, 22, 136–142. [PMC free article] [PubMed] [Google Scholar]
- O'Sullivan, M. , Jones, D. K. , Summers, P. E. , Morris, R. G. , Williams, S. C. R. , & Markus, H. S. (2001). Evidence for cortical "disconnection" as a mechanism of age‐related cognitive decline. Neurology, 57, 632–638. [DOI] [PubMed] [Google Scholar]
- Park, D. C. , & Reuter‐Lorenz, P. (2009). The adaptive brain: Aging and neurocognitive scaffolding. Annual Review of Psychology, 60, 173–196. [DOI] [PMC free article] [PubMed] [Google Scholar]
- Power, J. D. , Barnes, K. A. , Snyder, A. Z. , Schlaggar, B. L. , & Petersen, S. E. (2012). Spurious but systematic correlations in functional connectivity MRI networks arise from subject motion. NeuroImage, 59, 2142–2154. [DOI] [PMC free article] [PubMed] [Google Scholar]
- Ramnani, N. , & Owen, A. M. (2004). Anterior prefrontal cortex: Insights into function from anatomy and neuroimaging. Nature Reviews. Neuroscience, 5, 184–194. [DOI] [PubMed] [Google Scholar]
- Raz, N. , Lindenberger, U. , Rodrigue, K. M. , Kennedy, K. M. , Head, D. , Williamson, A. , … Acker, J. D. (2005). Regional brain changes in aging healthy adults: general trends, individual differences and modifiers. Cerebral cortex (New York, N Y: 1991), 15, 1676–1689. [DOI] [PubMed] [Google Scholar]
- Satterthwaite, T. D. , Elliott, M. A. , Gerraty, R. T. , Ruparel, K. , Loughead, J. , Calkins, M. E. , … Wolf, D. H. (2013). An improved framework for confound regression and filtering for control of motion artifact in the preprocessing of resting‐state functional connectivity data. NeuroImage, 64, 240–256. [DOI] [PMC free article] [PubMed] [Google Scholar]
- Schacter, D. L. , Kaszniak, A. W. , Kihlstrom, J. F. , & Valdiserri, M. (1991). The relation between source memory and aging. Psychology and Aging, 6, 559–568. [DOI] [PubMed] [Google Scholar]
- Seghier, M. L. , & Price, C. J. (2018). Interpreting and Utilising Intersubject variability in brain function. Trends in Cognitive Sciences, 22, 517–530. [DOI] [PMC free article] [PubMed] [Google Scholar]
- Shehzad, Z. , Kelly, C. , Reiss, P. T. , Cameron Craddock, R. , Emerson, J. W. , McMahon, K. , … Milham, M. P. (2014). A multivariate distance‐based analytic framework for connectome‐wide association studies. NeuroImage, 93(Pt 1), 74–94. [DOI] [PMC free article] [PubMed] [Google Scholar]
- Sheline, Y. I. , Barch, D. M. , Price, J. L. , Rundle, M. M. , Vaishnavi, S. N. , Snyder, A. Z. , … Raichle, M. E. (2009). The default mode network and self‐referential processes in depression. Proceedings of the National Academy of Sciences of the United States of America, 106, 1942–1947. [DOI] [PMC free article] [PubMed] [Google Scholar]
- Sinn, N. , & Howe, P. (2008). Mental health benefits of omega‐3 fatty acids may be mediated by improvements in cerebral vascular function. Bioscience Hypotheses, 1, 103–108. [Google Scholar]
- Smith, S. M. (2002). Fast robust automated brain extraction. Human Brain Mapping, 17, 143–155. [DOI] [PMC free article] [PubMed] [Google Scholar]
- Smola, A. J. , & Schölkopf, B. (2004). A tutorial on support vector regression. Statistics and Computing, 14, 199–222. [Google Scholar]
- Stano, J. (1999). Wechsler abbreviated scale of intelligence. San Antonio, TX: Psychological Corporation. [Google Scholar]
- Stuss, D. T. , & Knight, R. T. (2013). Principles of frontal lobe function. Oxford, UK: Oxford University Press. [Google Scholar]
- Talukdar, T. , Nikolaidis, A. , Zwilling, C. E. , Paul, E. J. , Hillman, C. H. , Cohen, N. J. , … Barbey, A. K. (2017). Aerobic fitness explains individual differences in the functional brain connectome of healthy young adults. Cerebral Cortex, 28, 3600–3609. [DOI] [PubMed] [Google Scholar]
- Talukdar, T. , Roman, F. J. , Operskalski, J. T. , Zwilling, C. E. , & Barbey, A. K. (2018). Individual differences in decision making competence revealed by multivariate fMRI. Human Brain Mapping, 39, 2664–2672. [DOI] [PMC free article] [PubMed] [Google Scholar]
- Thomason, M. E. , Yoo, D. J. , Glover, G. H. , & Gotlib, I. H. (2009). BDNF genotype modulates resting functional connectivity in children. Frontiers in Human Neuroscience, 3, 55. [DOI] [PMC free article] [PubMed] [Google Scholar]
- Van Overwalle, F. (2009). Social cognition and the brain: A meta‐analysis. Human Brain Mapping, 30, 829–858. [DOI] [PMC free article] [PubMed] [Google Scholar]
- West, R. L. (1996). An application of prefrontal cortex function theory to cognitive aging. Psychological Bulletin, 120, 272–292. [DOI] [PubMed] [Google Scholar]
- Witte, A. V. , Kerti, L. , Hermannstadter, H. M. , Fiebach, J. B. , Schreiber, S. J. , Schuchardt, J. P. , … Floel, A. (2014). Long‐chain omega‐3 fatty acids improve brain function and structure in older adults. Cerebral Cortex, 24, 3059–3068. [DOI] [PubMed] [Google Scholar]
- Zamroziewicz, M. K. , & Barbey, A. K. (2016). Nutritional cognitive neuroscience: Innovations for healthy brain aging. Frontiers in Neuroscience, 10, 240. [DOI] [PMC free article] [PubMed] [Google Scholar]
- Zamroziewicz, M. K. , & Barbey, A. K. (2018). The Mediterranean diet and healthy brain aging In Farooqui T. & Farooqui A. (Eds.), Role of the Mediterranean diet in the brain and neurodegenerative diseases (pp. 17–33). New York, NY: Elsevier. [Google Scholar]
- Zamroziewicz, M. K. , Paul, E. J. , Rubin, R. D. , & Barbey, A. K. (2015). Anterior cingulate cortex mediates the relationship between O3PUFAs and executive functions in APOE e4 carriers. Frontiers in Aging Neuroscience, 7, 87. [DOI] [PMC free article] [PubMed] [Google Scholar]
- Zamroziewicz, M. K. , Paul, E. J. , Zwilling, C. E. , & Barbey, A. K. (2017a). Predictors of memory in healthy aging: Polyunsaturated fatty acid balance and fornix white matter integrity. Aging Disease, 8, 372–383. [DOI] [PMC free article] [PubMed] [Google Scholar]
- Zamroziewicz, M. K. , Paul, E. J. , Zwilling, C. E. , & Barbey, A. K. (2018). Determinants of fluid intelligence in healthy aging: Omega‐3 polyunsaturated fatty acid status and frontoparietal cortex structure. Nutritional Neuroscience, 21, 570–579. [DOI] [PubMed] [Google Scholar]
- Zamroziewicz, M. K. , Paul, E. J. , Zwilling, C. E. , Johnson, E. J. , Kuchan, M. J. , Cohen, N. J. , & Barbey, A. K. (2016a). Parahippocampal cortex mediates the relationship between lutein and crystallized intelligence in healthy, older adults. Frontiers in Aging Neuroscience, 8, 297. [DOI] [PMC free article] [PubMed] [Google Scholar]
- Zamroziewicz, M. K. , Talukdar, M. T. , Zwilling, C. E. , & Barbey, A. K. (2017b). Nutritional status, brain network organization, and general intelligence. NeuroImage, 161, 241–250. [DOI] [PubMed] [Google Scholar]
- Zamroziewicz, M. K. , Zwilling, C. E. , & Barbey, A. K. (2016b). Inferior prefrontal cortex mediates the relationship between phosphatidylcholine and executive functions in healthy, older adults. Frontiers in Aging Neuroscience, 8, 226. [DOI] [PMC free article] [PubMed] [Google Scholar]
- Zhang, Y. , Brady, M. , & Smith, S. (2001). Segmentation of brain MR images through a hidden Markov random field model and the expectation‐maximization algorithm. IEEE Transactions on Medical Imaging, 20, 45–57. [DOI] [PubMed] [Google Scholar]
- Zwilling, C. , Talukdar, T. , Zamroziewicz, M. , & Barbey, A. K. (In press). Nutrient biomarker patterns, cognitive function, and fMRI measures of network efficiency in the aging brain. NeuroImage. 10.1016/j.neuroimage.2018.12.007 [DOI] [PubMed] [Google Scholar]