

Abstract
The self is the core of our mental life. Previous investigations have demonstrated a strong neural overlap between self‐related activity and resting state activity. This suggests that information about self‐relatedness is encoded in our brain's spontaneous activity. The exact neuronal mechanisms of such “rest‐self containment,” however, remain unclear. The present EEG study investigated temporal measures of resting state EEG to relate them to self‐consciousness. This was obtained with the self‐consciousness scale (SCS) which measures Private, Public, and Social dimensions of self. We demonstrate positive correlations between Private self‐consciousness and three temporal measures of resting state activity: scale‐free activity as indexed by the power‐law exponent (PLE), the auto‐correlation window (ACW), and modulation index (MI). Specifically, higher PLE, longer ACW, and stronger MI were related to higher degrees of Private self‐consciousness. Finally, conducting eLORETA for spatial tomography, we found significant correlation of Private self‐consciousness with activity in cortical midline structures such as the perigenual anterior cingulate cortex and posterior cingulate cortex. These results were reinforced with a data‐driven analysis; a machine learning algorithm accurately predicted an individual as having a “high” or “low” Private self‐consciousness score based on these measures of the brain's spatiotemporal structure. In conclusion, our results demonstrate that Private self‐consciousness is related to the temporal structure of resting state activity as featured by temporal nestedness (PLE), temporal continuity (ACW), and temporal integration (MI). Our results support the hypothesis that self‐related information is temporally contained in the brain's resting state. “Rest‐self containment” can thus be featured by a temporal signature.
Keywords: EEG, resting‐state, scale‐free, self, self‐consciousness, temporal structure
1. INTRODUCTION
1.1. From the resting state's temporal signature to the self
The self and its neural correlates have been extensively investigated in neuroscience. Several lines of research show that the self is associated strongly—although not exclusively—with neural activity, especially in the cortical midline structures (CMS) (Hu et al., 2016; Murray, Debbané, Fox, Bzdok, & Eickhoff, 2015; Murray, Schaer, & Debbané, 2012; Northoff & Heinzel, 2006; Sui & Humphreys, 2016). Most interestingly, various studies observed neural overlap between self‐related activity and spontaneous activity in CMS (Bai, Liang, Li, Voss, & Sleigh, 2015; D'Argembeau et al., 2005; Davey, Pujol, & Harrison, 2016; Huang, Obara, Davis, Pokorny, & Northoff, 2016; Qin et al., 2016; Qin & Northoff, 2011; Schneider et al., 2008; Whitfield‐Gabrieli & Ford, 2012). Such “rest‐self overlap” suggests that information about the self can be represented (Sui & Humphreys, 2016) in the resting state activity, which is known as “rest‐self containment” (Northoff, 2016). The exact neuronal mechanisms of such “rest‐self containment,” however, remain unclear.
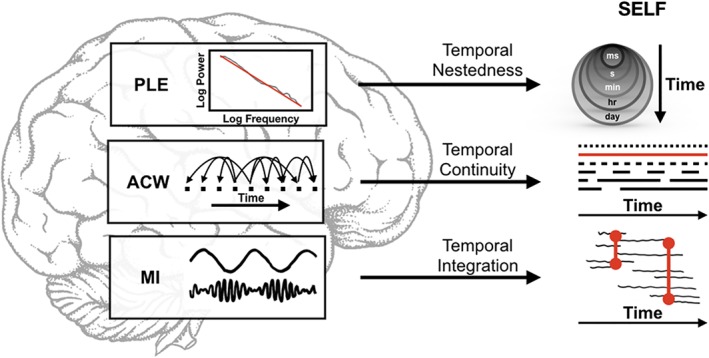
There is evidence that the brain's spontaneous activity shows an elaborate spatiotemporal structure. Various neural networks, including the default‐mode network (DMN), have been described on the spatial side (Power, Schlaggar, Lessov‐Schlaggar, & Petersen, 2013; Yeo et al., 2011). On the temporal side, spontaneous activity shows fluctuations and oscillations in different frequencies, ranging from infraslow (0.01–0.1 Hz), over slow (0.1–1 Hz), to faster (1–240 Hz) frequencies (Buzsáki, 2007; Buzsáki & Draguhn, 2004). Moreover, slower frequencies show much stronger power than faster ones. Together, these two characteristics—fluctuations in spontaneous activity at different frequencies and slower frequencies having more power than faster ones—obey what is described as scale‐free properties (He, 2011; He, 2013; He, 2014; Huang et al., 2016; Huang et al., 2017; Linkenkaer‐Hansen, Nikouline, Palva, & Ilmoniemi, 2001). This can be measured using the power law exponent (PLE) in the frequency domain.
Scale‐free properties indicate fractal organization where the faster frequencies are nested within the more powerful slower ones—this amounts to “temporal nestedness.” Such temporal nestedness on the neuronal level may also be relevant on the psychological level of the self. As the self is preserved and manifested in both shorter and longer time scales, ranging from milliseconds over hours and weeks to years and decades, one would suspect “temporal nestedness” to hold on the psychological level. This has been supported by a recent study of ours which demonstrated a relation between scale‐free properties and private self‐consciousness in the infraslow frequency range, as obtained with fMRI (Huang et al., 2016). In contrast, the relation of the EEG‐based faster frequencies’ temporal nestedness, their scale‐free properties (1–40 Hz), with the self remains unclear.
Yet another measure of the temporal structure of spontaneous activity is the autocorrelation window (ACW) (Honey et al., 2012; Murray et al., 2014). Simply put, the ACW measures the correlation in neural activity patterns across different points in a time series; the stronger the correlation between distant points in time, the longer the ACW. It thus indexes sameness or “temporal continuity” of neural activity. It is still unclear how such “temporal continuity” on the neuronal level is related to the self on the psychological level. This is of high interest given that, on a psychological level, our self can be characterized by temporal continuity as we perceive ourselves in an extended way (Ersner‐Hershfield, Tess Garton, Ballard, Samanez‐Larkin, & Knutson, 2009; Ersner‐Hershfield, Wimmer, & Knutson, 2009; Northoff, 2017). The relationship between temporal continuity on the neuronal level and the psychological level of self‐consciousness remains unclear though.
In addition to the temporal nestedness of scale‐free properties and the temporal continuity of the ACW, spontaneous activity also shows coupling between different frequencies. This amounts to cross‐frequency coupling (CFC) (Aru et al., 2015; Bonnefond, Kastner, & Jensen, 2017; Canolty et al., 2009; He, Zempel, Snyder, & Raichle, 2010; Hyafil, Giraud, Fontolan, & Gutkin, 2015; Lakatos, Karmos, Mehta, Ulbert, & Schroeder, 2008; Tort et al., 2008). CFC can be quantified by measuring the modulation index (MI) of the signal (Canolty & Knight, 2010; He et al., 2010). The CFC refers to dynamic interactions between oscillations in the brain that operate at different frequency bands (Hyafil et al., 2015). This has been shown in both slow and fast frequencies (Aru et al., 2015; Buzsáki, Logothetis, & Singer, 2013; Hyafil et al., 2015), and in the infraslow ranges (Huang et al., 2017). CFC demonstrates the relationship between varying neural oscillations, thus allowing for what is described as “temporal integration.” It is still unclear, however, how such temporal integration of different frequencies is related to the self.
The question of temporal integration becomes even more powerful given that, on a psychological level, the self has been associated with the integration of different functions: sensory (Sui, He, & Humphreys, 2012; Sui, Rotshtein, & Humphreys, 2013), motor (Frings & Wentura, 2014), affective (Northoff et al., 2009), cognitive (Nakao et al., 2016; Nakao, Bai, Nashiwa, & Northoff, 2013; Nakao, Ohira, & Northoff, 2012), and social (Schilbach et al., 2013). Strikingly, these functions operate in different frequency ranges (Buzsáki, 2007) and their integration on the psychological level may ultimately be traced to temporal integration on the neuronal level. Therefore, what on the psychological level is described as the integrative function of the self may, on the neuronal level, be realized by temporal integration of different frequencies as mediated by CFC. One would consequently expect resting state CFC (as measured by MI) to predict the degree of self‐consciousness. That is yet to be investigated.
Taken together, there is strong empirical evidence that (i) the brain's resting state activity—its spontaneous activity—is closely related to our sense of self, or self‐consciousness (Davey et al., 2016; Northoff, 2016; Qin & Northoff, 2011); and that (ii) on a purely psychological level, the self can be characterized by strong temporal integration which includes temporal nestedness (manifest over different time scales or frequency ranges), temporal continuity (as in self‐continuity), and temporal integration (as in the integrative function of self). Aiming to bridge the gap between psychological and neuronal levels, we therefore applied measures to the brain's spontaneous activity, specifically the PLE, ACW, and CFC, which index those psychological temporal features—temporal nestedness, continuity, and integration—on the neuronal level and we correlated them with self‐consciousness.
1.2. Aims and hypotheses
The main and overarching aim of our study was to investigate how the various measures of the resting state's temporal signatures are related to self‐consciousness. For that purpose, we conducted resting state EEG with eyes closed (EC). The resting state's temporal signature was analyzed in a whole‐brain manner with measures for temporal nestedness (scale‐free activity as with PLE), temporal continuity (the ACW), and temporal integration (CFC as measured with MI). The same participants also underwent psychological assessment of their self with the self‐consciousness scale (SCS) which includes Private, Public, and Social subscales (Abe & Bagozzi, 1996; Fenigstein, Scheier, & Buss, 1975; Scheier & Carver, 1985). Generally, we hypothesized a direct relationship between the various measures of the resting state's temporal signature and private self‐consciousness. This was further tested by applying machine learning as a data‐driven method of validation.
The first specific aim was to measure the resting state's temporal nestedness through its scale‐free properties and relate them to self‐consciousness. In one of our previous fMRI studies (Huang et al., 2016), it was found that the PLE in the infraslow frequency range (0.01–0.1 Hz) in the medial prefrontal cortex correlated significantly with the Private self‐consciousness scale subscore, while the Public and Social subscores did not. Based on these previous fMRI results, we hypothesized that higher degrees of scale‐free properties in the resting state as measured by the power law exponent are related to higher degrees of Private self‐consciousness (as distinguished from Public and Social self‐consciousness).
The second specific aim was to measure the resting state's temporal continuity through the ACW and relate it to self‐consciousness. Based on the strong determination of ACW by slower frequencies specifically (Honey et al., 2012), and the finding that the infraslow frequencies (in fMRI) correlated with private self‐consciousness (Huang et al., 2016), we hypothesized that a longer ACW was related to both higher degrees of scale‐free activity and Private self‐consciousness.
The third specific aim was to associate the resting state's temporal integration with self‐consciousness. This was done by examining CFC as measured by MI. Based on the close link between scale‐free properties and cross‐frequency coupling (He, 2014; He et al., 2010) with strong impact of the slow frequencies on both CFC (He et al., 2010) and private self‐consciousness (Huang et al., 2016), we hypothesized that higher degrees of MI are related neuronally to higher degrees of PLE and ACW, and psychologically to stronger Private self‐consciousness.
Using eLORETA for topographical analyses, our fourth specific aim was to test for the relevance of EEG‐based resting state activity in cortical midline structures such as the perigenual anterior cingulate cortex (pACC) and posterior cingulate cortex (PCC) for self‐consciousness. Based on previous results (Davey et al., 2016; Huang et al., 2016; Northoff et al., 2006), we hypothesized that the degree of EEG‐based resting state activity in pACC/PCC (as measured by eLORETA values) is related to the degree of Private self‐consciousness.
Finally, we wanted to evaluate the relationship between PLE, ACW, MI, and eLORETA values for determining the SCS scores using a data‐driven approach. For this, we employed a supervised classifier. A classifier is a system that divides data into different classes, by learning the relationship between the selected features and the selected classes. Specifically, we used a Support Vector Machine (SVM), which is a popular and useful classifier algorithm, to do this. As this was a data‐driven analysis we did not have an a priori hypothesis, but rather we used it to supplement our other findings.
2. MATERIALS AND METHODS
2.1. Subjects
Fifty (25 female) healthy subjects were included in the subsequent analysis. Sixty participants completed the resting state session. Of these, four were excluded due to technical issues related to EEG recording and three were excluded due to excessive movements during the resting state session. A further three participants tested positive for marijuana through the E‐Z Split Key cup 5 (testing for marijuana, opiates, cocaine, methamphetamine, and phencyclidine). This urine drug test was performed the day of the EEG session as part of an adjacent study. Due to the possibility that the drug would affect the EEG data (Banoczi, 2005), their data was excluded from all analyses.
All participants were between the ages of 18 and 55 and were right‐handed as per the Edinburgh Handedness Tool (Oldfield, 1971). The Handedness Tool subscores were the following: Writing had a mean of 100, and standard deviation (SD) of 0; Throwing had a mean of 90.24 and SD of 20.06; Toothbrush had a mean of 87.80 and a SD of 26.88; Spoon had a mean of 91.46 and SD of 19.05; Laterality Quotient had a mean of 92.38 and SD of 11.48. Participants completed a self‐report health questionnaire in which all reported no history of neurological or psychiatric diagnosis, no history of concussion or other head injury, and no history or current use of substances of abuse. The experimental protocol was approved by the research ethics committee of the University of Ottawa Institute of Mental Health Research, and the study was carried out with their permission. Written informed consent was obtained from each participant prior to study participation.
2.2. Self‐consciousness scale
The Self‐Consciousness Scale (SCS) (Abe & Bagozzi, 1996; Fenigstein et al., 1975; Scheier & Carver, 1985), a 20‐item self‐report questionnaire, investigates the concept of the self. It breaks this ambiguous concept down into three concrete dimensions: Private, Public, and Social self‐consciousness. Each of these dimensions is a subscale which is comprised of responses from six questions.
The Private subscale is concerned with thoughts and reflections about oneself, while the Public subscale concerns oneself in interactions with others in the Public arena (Fenigstein et al., 1975). The Social subscale, on the other hand, relates to Social anxiety; its questions concern feelings of discomfort while in the presence of others (Abe & Bagozzi, 1996).
All participants completed the SCS prior to the EEG resting state session, and the subscale scores were calculated after the session according to the scoring key. All remaining correlations between resting state measures were one‐tailed bootstrapped correlations based on 1,000 samples.
2.3. Electrophysiological recording
EEG data was recorded using a Neuroscan amplifier (Compumedics Neuroscan, Charlotte, NC, USA) and Ag/AgCl electrodes through a 64‐channel cap (according to the International Ten‐Twenty System) referenced to the right mastoid. The data was sampled at 1,000 Hz with DC recording. The impedance of each electrode was kept under 5 kΩ. An electrooculogram was recorded for each participant with a pair of electrodes above and below the right eye, and another pair on the outer canthi of each eye. The EEG data pre‐processing was performed using the EEGLAB toolbox for MATLAB. The CB1 and CB2 channels were deleted from the data because of irrelevance, and the data was referenced to two mastoid channels (M1 and M2). The data was filtered with a low‐pass filter at 40 Hz and a high‐pass filter at 1 Hz.
Five minutes of eyes closed resting‐state data was recorded, with the participant sitting down. From this 5 min, four uninterrupted minutes in which no data had been cut out (due to artifacts) was extracted. All subsequent analyses were done on this four uninterrupted minutes.
2.4. Artifact rejection
Artifacts such as eye blinks and muscle related potentials were left in the data for the independent component analysis (ICA). The ICA was performed via EEGLAB software on the data to create 62 ICs. A visual inspection of the ICs determined which components were the result of electrode and physiological noise. Rejection was based on time course data. As stated above, from the 5 min of eyes closed resting‐state data recorded, four uninterrupted minutes was extracted and used in all subsequent analyses.
2.5. Power and power law exponent (PLE) analysis
The power law exponent was calculated using an in‐house MATLAB script according to the methods of previous articles (He, 2011; He, 2014; Huang et al., 2016). First, uninterrupted data files of 4 min underwent a windowed Fast Fourier Transform (FFT). The window length was 2,000 ms, the window overlap was 50%, and the number of points used in the FFT was 120,000. One FFT was extracted per window before averaging them. This averaged FFT was log–log transformed in both the frequency range (1–40 Hz) and power spectrum according to previous studies (Bullmore & Sporns, 2009; He et al., 2010; Huang et al., 2016). MATLAB's polyfit function was then used to do a linear fit between the log–log transform, and the slope of this line was extracted as the PLE value. One PLE value was extracted per channel, and the mean of all channels was used in all subsequent analyses.
Absolute power was extracted for each of the bands (delta 1–4 Hz, theta 4–8 Hz, alpha 8–12 Hz, and beta 13–30 Hz) separately, also using a custom MATLAB script. They were then partially correlated with all three self‐consciousness subscores. This was done to determine if the power of any one band correlated significantly with the subscores, and it was this power that was responsible for the significant correlations with the PLE.
2.6. Autocorrelation window
The ACW was calculated in MATLAB (v2016a) using custom scripts according to Honey et al. (2012). The ACW is defined as the full‐width‐at‐half‐maximum of the autocorrelation function (Figure 3a) for the EEG time course. It estimates the width of the mean lobe of the autocorrelation.
Figure 3.

ACW distribution and correlation with SCS subscales. (a) Autocorrelation function of all participants for 4 min of eyes closed resting state, from which the ACW (arrow) was calculated. The ACW was calculated by a 20 s window with 50% overlap and at lag of 0.5 s. (b) Distribution of ACW's for all participants from autocorrelation function seen in a. The width of the plots denotes the number of observations, with wider areas having more observations. The horizontal line in the boxplots signifies the mean of the distributions, with crosses signifying outliers. (c) One‐tailed, bootstrapped correlation between ACW and PLE, which is significant (p‐value stated). (d) One‐tailed, bootstrapped partial correlations between ACW's and SCS subscale scores. The other two subscores were included as covariates in the partial correlations. Of the three subscales, only Private had a significant correlation with ACW's. Circle = Private, Cross = Public, Triangle = Social. The p‐values are FDR corrected [Color figure can be viewed at https://wileyonlinelibrary.com]
To calculate the ACW, we examined the autocorrelation function at the following lag‐times: 0.1, 0.5, and 1.0 s. The number of steps for all three lag‐times was 23, though the 0.1 s lag computed 101 coefficients, 0.5 s lag computed 501 coefficients, and 1.0 s lag computed 1,001 coefficients. The ACW values (Figure 3b) computed for all three lag‐times agreed.
All data was sampled at 500 Hz, the size of the window was 20 s, and the overlap of the window was 50%.
2.7. Modulation index
The MI was calculated in MATLAB (v2016a) using custom scripts according to Canolty et al. (2009), Tort, Komorowski, Eichenbaum, and Kopell (2010), and Richter, Babo‐Rebelo, Schwartz, and Tallon‐Baudry (2017). The MI measures the intensity of phase amplitude coupling between the nested and nesting frequencies during the time interval being examined (Tort et al., 2010). In this study, the MI was calculated for the full 4‐min Eyes Closed resting state for each participant, with delta (1–4 Hz) as the “phase‐modulating” band, and all other frequencies (4–40 Hz) as the “amplitude‐modulated” band. Specifically, as done in previous articles (Richter et al., 2017; Tort et al., 2010), the signal—each EEG channel here—was first filtered at the phase (1–4 Hz) and the amplitude (4–40 Hz) frequencies to extract filtered signals. The Hilbert transform was then applied to both the phase and amplitude filtered signals to obtain timeseries of the phases and amplitude envelope, respectively. The composite timeseries of both filtered signals was constructed and the phases of this composite were binned. The mean of the filtered amplitude signal in each phase bin was calculated. Finally, this mean amplitude was normalized by dividing it by the sum over all the bins.
2.8. Exact low‐resolution brain electromagnetic tomography analysis
Low‐resolution brain electromagnetic tomography (LORETA) is a source analysis technique which aims to estimate the location and activity of the neural generators which give rise of EEG activity recorded at the scalp. Known as the inverse problem, the goal is to determine the most probable source of the EEG activity. There are several methods to resolve this problem; however, LORETA is one approach which provides a linear solution to the question of where in the cortex is the source of the EEG activity recorded at the scalp.
It was developed at the KEY Institute for Brain‐Mind Research at the University of Zurich (Pascual‐Marqui, Michel, & Lehmann, 1994) to compute the three‐dimensional intracerebral distribution of neural current density sources. Exact Low‐Resolution Brain Electromagnetic Tomography (eLORETA) is a refinement of the original sLORETA method. It does not require standardization for correct localization (Pascual‐Marqui, 2007) and is more precise in the location of the probable current density sources. When eLORETA is measured in specific brain regions as done here, the current density, based on the configuration of the EEG electrodes and the activity recorded at each of these electrodes, is computed. Since it is a current, the calculated values can be positive or negative.
The current implementation of eLORETA uses a realistic head model (Fuchs, 2002) and electrode coordinates (Jurcak, Tsuzuki, & Dan, 2007). The 4‐min artifact‐free blocks were exported into text files from the EEGLAB software for eLORETA analysis. The steps to calculate eLORETA values were as follows: (1) computing EEG cross‐spectra from the raw 64‐channel EEG recordings; (2) computing cortical generators of surface oscillatory activity using the cross‐spectra; and (3) computing these values for the region of interest (ROI) voxels, according to Huang et al. (2016). Here the ROI was defined as PCC and pACC using all voxels within 12 cm of the following seeds (MNI coordinates):
| X | Y | Z | |
|---|---|---|---|
| PCC | −5/5 | −54 | 22 |
| PACC | −5/5 | 47 | 11 |
2.9. Statistical correlations
For each resting‐state measure (PLE, ACW, MI, eLORETA), three partial correlations were performed, with Private, Public, and Social subscores. The other two subscores were controlled for in the partial correlations. In addition, to examine the relationship between resting state measures, and for the control correlations with the power of each frequency band, one‐tailed bootstrapped correlations (1,000 samples) were carried out.
For all correlations, partial or bivariate, the Pearson correlation coefficient was measured since the relationship between the resting‐state measure and the SCS subscores was expected to be linear. Though PLE is a nonlinear measure, the relationship between the PLE and SCS scores, which the correlations measure, is linear (Huang et al., 2016) in that they are related by the equation y = mx + b, with m being the slope of the line. The significance level for each of the correlations is .05.
To account for the multiple correlations performed in this study, the Benjamini–Hochberg False Discovery Rate (FDR) (Benjamini & Hochberg, 1995) was applied to all p‐values, as was done in recent articles (Arazi et al., 2017; Cruzat et al., 2018; Huang et al., 2018). All statistical tests from the study were listed together and the FDR was applied to all p‐values at once. Therefore, the p‐values in the results and figures are FDR corrected for multiple comparisons.
2.10. Support vector machine (SVM)
The LibSVM MATLAB toolbox (Version 3.22) was used as an implementation of the SVM algorithms (Chang & Lin, 2011). This method was employed to test our findings mentioned above of strong significant correlations between our measures and Private subscores. Due to our small number of observations (50) for this method, only the Private subscore was tested.
A linear SVM constructs an optimal linear hyperplane in the feature space, which classifies the data into two classes. We divided our participants into two classes: a “high Private self‐consciousness” class, and “low Private self‐consciousness” class. We determined that the mean Private SCS score among participants was 15.1, so each participant below the mean was labeled as “low Private self‐consciousness,” and each above the mean was labeled as “high Private self‐consciousness.” We used the results of the PLE, ACW, MI, and eLORETA (both PCC and pACC) analyses as features, which resulted in five‐dimensional data points. The SVM was trained on 30 random participants and then tested on the remaining 20 participants. It was trained to find the optimal model parameters in three successive search spaces, each with a three‐fold cross validation. First, we searched for the optimal model parameters (c and gamma) in a large search space, then the searching space was narrowed two more times into smaller and smaller spaces. When the optimal parameters are determined, the model is applied to the test set for classification. After classification, we extracted the feature weights to evaluate the importance of each feature for classification.
3. RESULTS
3.1. Behavioral data
The Self‐Consciousness Scale (SCS) yielded three subscores, one for Private, Public, and Social (Figure 1). The distribution of the subscores were as follows: the mean of the Private subscore was 15.10, with the standard deviation 3.78 and the range from 7 to 25; the Public subscore had a mean of 10.52, standard deviation of 4.51 and range from 0 to 21; in the Social subscore, the mean was 7.60, the standard deviation of 3.56, and a range from 2 to 16.
Figure 1.

Self‐consciousness subscale score distributions. Private (left), Public (center), and Social (right) are illustrated. The width of the plots denotes the number of observations, with wider areas having more observations. The horizontal line in the boxplots signifies the mean of the distributions, with crosses signifying outliers [Color figure can be viewed at https://wileyonlinelibrary.com]
3.2. Power law exponent (PLE) and self‐consciousness
The PLE was calculated based on the methods of He et al. (2010), and Huang et al. (2016) from the power spectrums of all 50 participants (Figure 2a). The distribution of the PLE values included a mean of 0.851, a SD of 0.099, and a range of 0.665–1.076 (Figure 2b).
Figure 2.

Power law exponent (PLE) distribution and correlation with SCS subscales. (a) Log–log power spectrum of all participants for 4 min of eyes closed resting state, from which the PLE was calculated. Power spectrums are the mean of all channels. Alpha peak at roughly 10 Hz is prominent since the resting state is eyes closed. Data was bandpass filtered from 1 to 40 Hz. (b) Distribution of PLE's for all participants from power spectrums seen in a. the width of the plots denotes the number of observations, with wider areas having more observations. The horizontal line in the boxplots signifies the mean of the distributions. (c) One‐tailed, bootstrapped partial correlations between PLE's and SCS subscale scores. The other two subscores were included as covariates in the partial correlations. Of the three subscales, only private had a significant correlation with PLE's. Circle = private, Cross = public, Triangle = social. The p‐values are FDR corrected [Color figure can be viewed at https://wileyonlinelibrary.com]
In one‐tailed partial correlations with the SCS subscores (Figure 1), the Pearson correlation values for the PLE were the following: for the Private subscore, r = .329, p = .047; for the Public subscore, r = .100, p = .377; for the Social subscore, r = −.058, p = .411 (Figure 2c).
To determine if the significant correlation between PLE and Private SCS was due to the power of any individual frequency band, we partially correlated the power—while controlling for the other two subscores—in delta (1–4 Hz), theta (4–8 Hz), alpha (8–13 Hz), and beta (13–30 Hz) with all three subscores.
The partial correlation results for the Private subscore were the following: in the delta band, r = .198, p = .204; in the theta band, r = .072, p = .386; in the alpha band, r = .107, p = .377; in the beta band, r = .124, p = .477. None of these partial correlations were found to be significant.
For the partial correlations with the Public subscore, the results were the following: in the delta band, r = .100, p = .459; in the theta band, r = −.092, p = .474; in the alpha band, r = .098, p = .491; in the beta band, r = −.013, p = .420.
Finally, with the Social subscore, the results were the following: in the delta band, r = −.035, p = .386; in the theta band, r = −.028, p = .386; in the alpha band, r = −.137, p = .151; in the beta band, r = −.146, p = .332.
3.3. Auto‐correlation window and self‐consciousness
The ACW was calculated based on the methods of Honey et al. (2012) from all EEG channels for the 50 participants. The ACW was determined from the autocorrelation function of each participant (Figure 3a). The distribution of the ACW values included a mean of 0.051, a SD of 0.018, and a range of 0.026–0.103 (Figure 3b).
To determine the relationship of the ACW to the PLE, a one‐tailed bootstrapped correlation was done which found a Pearson coefficient of r = .394, p = .023, 95% CI (.077–.622) (Figure 3c).
In one‐tailed partial correlations with the SCS subscores (Figure 1), the correlation values for the ACW were the following: for the Private subscore, r = .367, p = .045; for the Public subscore, r = −.048, p = .420; for the Social subscore, r = −.214, p = .181 (Figure 3d).
3.4. Modulation index and self‐consciousness
The MI was calculated based on the methods of Canolty et al. (2009), Tort et al. (2010), and Richter et al. (2017) from all EEG channels for the 50 participants. It was also calculated in He et al., 2010 which examined scale‐free brain activity and temporal structure, therefore this measure was calculated in addition to the PLE and ACW. The distribution of the MI values included a mean of 7.272, a SD of 4.135, and a range from 1.151 to 18.963 (Figure 4a).
Figure 4.

MI distribution and correlation with SCS subscales. (a) Distribution of MI's for all participants calculated from 4 min of eyes closed resting state. The width of the plots denotes the number of observations, with wider areas having more observations. The horizontal line in the boxplots signifies the mean of the distributions, with cross signifying outlier. (b) One‐tailed, bootstrapped correlations between MI and PLE and ACW, both of which were significant (p‐values stated). (c) One‐tailed, bootstrapped partial correlations between MI's and SCS subscale scores. The other two subscores were included as covariates in the partial correlations. Of the three subscales, only Private had a significant correlation with MI's. Circle = Private, Cross = Public, Triangle = Social. The p‐values are FDR corrected [Color figure can be viewed at https://wileyonlinelibrary.com]
To determine the relationship of the MI to the PLE and ACW, two one‐tailed correlations were done. The correlation between the MI and the PLE was found to be significant, with a Pearson correlation value of r = .493, p = .000, 95% CI (.292–.668) (Figure 4b). The correlation between the MI and the ACW was also found to be significant, with a Pearson correlation value of r = .474, p = .020, 95% CI (.124–.717).
In one‐tailed partial correlations with the SCS subscores (Figure 1), the correlation values for the MI were the following: for the Private subscore, r = .312, p = .047; for the Public subscore, r = .192, p = .205; for the Social subscore, r = −.147, p = .293 (Figure 4c).
3.5. Private self‐consciousness partial correlations controlling for other measures
From the results stated above, one further correlation was carried out. In this instance, however, the remaining two measures were also added as covariates. This would determine if the relationship between the Private subscore and the measure remained significant if the partial correlation included the other two measures as covariates, in addition to the public and social subscores.
Therefore, three one‐tailed bootstrapped correlations were done. The first measured the partial correlation between the Private subscore and the ACW, while controlling for the public and social subscores, and the PLE and MI. The Pearson correlation value was r = .376, p = .045.
When the same correlations were performed with the PLE and MI—controlling for the MI and ACW, and the PLE and ACW, respectively—the correlations were no longer significant. The respective Pearson correlation values were r = −.166, p = .279, and r = .191, p = .226.
This indicates that only the ACW and Private subscore relationship was significant when the public and social subscores and the PLE and MI were controlled for.
3.6. Tomography and self‐consciousness
From the regions of interest for the Default Mode Network (DMN) in Huang 2016, we chose two regions to examine eLORETA activity in our data. These two regions were the pACC (Figure 5a) and the PCC (Figure 6a). With this activity, we did partial correlations with the SCS subscores (controlling for the other two subscores) to determine the relationship between self‐consciousness and the activity in these two DMN areas. These regions were contrasted with two controls areas, not a part of the DMN, the cortex of the Dorsal Attention Network (DAN) and the cortex of the Motor Network (M1), and the whole cortex with no ROIs. In addition, these values of eLORETA activity were one‐tail correlated with the other resting‐state measures (PLE, ACW, MI) (Table 1). Significant p‐values were found in correlations with all measures for both the pACC and PCC, but not in control regions.
Figure 5.

Perigenual anterior cingulate cortex (pACC) eLORETA correlation with SCS subscales. (a) eLORETA localization of pACC (a cortical midline structure) based on MNI coordinates from a previous article. (b) One‐tailed, bootstrapped partial correlations between pACC eLORETA values and SCS subscale scores. The other two subscores were included as covariates in the partial correlations. Of the three subscales, Private was just below the level of significance with the FDR correction applied. Circle = Private, Cross = Public, Triangle = Social. The p‐values are FDR corrected [Color figure can be viewed at https://wileyonlinelibrary.com]
Figure 6.

Posterior cingulate cortex (PCC) eLORETA correlation with SCS subscales. (a) eLORETA localization of PCC (a cortical midline structure) based on MNI coordinates from a previous article. (b) One‐tailed, bootstrapped partial correlations between PCC eLORETA values and SCS subscale scores. The other two subscores were included as covariates in the partial correlations. Of the three subscales, only Private had a significant correlation with PCC activity. Circle = Private, Cross = Public, Triangle = Social. The p‐values are FDR corrected [Color figure can be viewed at https://wileyonlinelibrary.com]
Table 1.
Correlation between pACC and PCC eLORETA source current density and PLE, ACW, and MI
| Correlation between eLORETA and: | pACC r b value | pACC p a value | PCC r b value | PCC p b value |
|---|---|---|---|---|
| PLE | .339 | .023 | .332 | .023 |
| ACW | .331 | .047 | .322 | .047 |
| MI | .402 | .047 | .402 | .052 |
FDR corrected for multiple comparisons.
Pearson r value for one‐tailed bootstrapped (1,000 samples) correlation.
In one‐tailed partial correlations with the SCS subscores (Figure 1), the correlation values for the pACC eLORETA data were the following: for the Private subscore, r = .315, p = .047; for the Public subscore, r = .082, p = .386; for the Social subscore, r = −.103, p = .377 (Figure 5b).
The Pearson correlation values for the PCC eLORETA data with the SCS subscores were the following: for the Private subscore, r = .327, p = .047; for the Public subscore, r = .076, p = .386; for the Social subscore, r = −.083, p = .386 (Figure 6b).
Finally, the Pearson correlation values for the DAN eLORETA data with the SCS subscores were the following: for the Private subscore, r = .303, p = .234; for the Public subscore, r = .047, p = .969; for the Social subscore, r = −.099, p = .969. The values for M1 eLORETA data with the SCS subscores were the following: for the Private subscore, r = .293, p = .234; for the Public subscore, r = .07, p = .969; for the Social subscore, r = −.098, p = .969 (Figure 6b). As a last control measure, none of the correlations between the eLORETA activity in the whole cortex, with no ROI, and the SCS subscores were significant (p = .466, p = .302, p = .327, respectively).
3.7. Support vector machine
The trained SVM could accurately distinguish “low Private self‐consciousness” and “high Private self‐consciousness” individuals from the test group (Figure 7). The trained SVM was tested using an independent testing set. It was 95% accurate, correctly labeling 19 of the 20 individuals in the test set. For this study, we were interested in the relative importance of each feature for classification, so we extracted the weights of each feature used to construct the separating hyperplane. The weight coefficient for the PLE was 0.37, for the ACW was 0.72, for the MI was 0.20, and for the eLORETA was 0.55 for the pACC and 0.56 for the PCC.
Figure 7.
Schema of role and interaction of all three measures. PLE measures the temporal nestedness of frequencies, ACW measures the temporal continuity of frequencies, and MI measures the temporal integration of frequencies during the resting state [Color figure can be viewed at https://wileyonlinelibrary.com]
4. DISCUSSION
We here investigated how the EEG‐based temporal signature of the brain's spontaneous activity is related to self‐consciousness. First, we demonstrated the positive relationship of temporal nestedness, as indexed by PLE, with Private self‐consciousness. Second, the degree of the resting state's temporal continuity, as measured by ACW, correlated positively with both PLE and Private self‐consciousness. Third, the temporal integration of the spontaneous activity, as measured by MI, was related to PLE and ACW as well as to Private self‐consciousness. Finally, Private self‐consciousness correlated positively with the EEG‐source current density estimation from cortical midline structures, the pACC and PCC specifically. In both DMN regions, as the eLORETA current source density increased in participants, so did the Private subscore. This contrasts with the non‐DMN control regions, which did not show a significant relationship with Private self‐consciousness.
Our results strongly support our hypotheses. All measures of the resting state's temporal signature—PLE, ACW, and MI—correlated positively with the degree of Private self‐consciousness. In contrast, no such relationship was found for Public and Social self‐consciousness. Moreover, our data show a significant relationship between two of the core cortical midline regions, pACC and PCC, and Private self‐consciousness, but not the control regions. Together with our results on machine learning, our data strongly support the hypothesis that information about our self or self‐representation is encoded and contained in the brain's resting state. This is known as rest‐self containment. Most importantly, we find that such rest‐self containment occurs on a temporal basis, specifically by the resting state's degree of temporal nestedness, temporal continuity, and temporal integration. As these three neuronal features find their direct analogues on the psychological level of the self, our results support a temporal basis of self as featured by the temporal signature of the brain's spontaneous activity (see also Northoff, 2017).
Taken together, our data shows that the temporal structure of the spontaneous activity encodes and contains information specifically about Private self‐consciousness. This is further reinforced by our machine learning results, which shows that features extracted from the brain's spontaneous activity can be used to classify high versus low Private self‐consciousness. Thus, the temporal signature of the brain's spontaneous activity can characterize our self and its self‐consciousness. This suggests that temporal nestedness, continuity, and integration also hold on the psychological level of self, which therefore may be characterized in a temporal way (see Northoff, 2016, 2017).
4.1. “Temporal nestedness” of spontaneous activity and self‐consciousness
Our first main finding shows a positive relationship between the resting state's scale‐free properties and Private self‐consciousness. Higher values of the PLE were related to higher degrees of Private self‐consciousness. Previous findings show a relation of scale‐free properties with personality traits (Hahn et al., 2012; Lei, Zhao, & Chen, 2013) and self‐consciousness (Huang et al., 2016) in the infraslow frequency domain (0.01–0.1 Hz) as measured with fMRI. Our data shows an analogous relationship in the faster frequency domain (1–40 Hz) of EEG. The higher the degree of the resting state's scale‐free properties in these frequencies, the higher the degree of Private self‐consciousness. Most interestingly, as in our previous fMRI study (Huang et al., 2016), this relationship only holds for Private, but not Public and Social dimensions of self‐consciousness.
Scale‐free properties describe the power relationship between slower and faster frequencies. As slower frequencies show stronger power than faster ones, the latter are temporally nested within the former—there is thus “temporal nestedness” that indexes a fractal organization between the different frequencies in the brain's spontaneous activity (He, 2011; He, 2014; Linkenkaer‐Hansen et al., 2001; Palva et al., 2013). Both our past (Huang et al., 2016) and present results suggests that such temporal nestedness on the neuronal level is closely related to our self through Private self‐consciousness. This is further supported by the fact that the power of the single frequency ranges themselves did not predict Private self‐consciousness. Hence, it is really the fractal organization, and thus temporal nestedness, that encodes Private self‐consciousness.
Psychologically, our self‐spans across different time ranges. Our self may exert impact on the level of seconds as, for instance, when impacting and modulating stimuli in terms of different degrees of self‐relatedness (Northoff et al., 2006; Sui et al., 2012; Sui et al., 2013; Sui & Humphreys, 2015). This amounts to what has been described as “synchronic self” (Northoff, 2016). At the same time, our self is also manifest in extremely long timescales and thus slower frequency ranges, as over days, weeks, and even years and decades. This thus reflects a “self‐continuity” as “diachronic self” (Ersner‐Hershfield, Tess Garton, et al., 2009; Ersner‐Hershfield, Wimmer, & Knutson, 2009; Northoff, 2017) which, following our data, may be traced to the temporal nestedness between the different frequencies in the brain's spontaneous activity.
4.2. “Temporal continuity” of spontaneous activity and self‐consciousness
Our second main finding concerns the relationship of the ACW of our data to Private self‐consciousness. What do these results mean? For that, we must go back to the neuronal level and consider what exactly the ACW measures. The ACW measures the degree of sameness of neural activity patterns across time when correlating the different time points with each other. As the slower frequencies, due to their long cycle duration and strong power, shape the ACW more strongly that shorter and less powered faster frequencies (Honey et al., 2012), one would expect positive correlation between scale‐free properties such as the PLE, and the ACW. This is exactly what our results revealed.
Longer ACW indicates that neuronal activity remains the same over time. Hence, ACW can be said to measure the degree of “temporal continuity” of the brain's spontaneous activity. Most importantly, our results show that such temporal continuity on the neuronal level is related to our self, specifically Private self‐consciousness; the higher the degree of temporal continuity on the neuronal level, the higher the degree of Private self‐consciousness. In contrast, no such correlation was observed for Public and Social self‐consciousness. Hence, temporal continuity on the neuronal level may be directly related to self on the psychological level. This relationship is embodied by our machine learning model, in which the ACW was the most heavily weighted feature for classification. This reinforces the special relationship of the brain's temporal continuity to self‐consciousness.
The relationship between temporal continuity on the neuronal level and self‐consciousness on the psychological level is of interest given that psychologically the self can indeed be characterized by its continuous nature, specifically self‐continuity resulting in personal identity (Northoff, 2017). The self has been demonstrated to delay reward choice more strongly than nonself (Ersner‐Hershfield, Wimmer, & Knutson, 2009)—the self thus appears to infuse temporal delay with temporal continuity into psychological functions such as reward. This is even more interesting given that the ACW on the cellular level has been related to the degree to which monkeys can delay reward delivery (Murray et al., 2014). Temporal continuity, on both the neuronal and psychological levels, thus seem to provide the “glue,” or “common currency,” between the brain and the self.
4.3. “Temporal integration” of spontaneous activity and self‐consciousness
Our third main finding consists in the relationship between cross‐frequency coupling (as indexed by MI) and Private self‐consciousness. As in the other measures, we observed a positive correlation between MI and Private self‐consciousness. No such relation was observed for Public and Social dimensions of self.
Cross‐frequency coupling describes the relation between slower and faster frequencies; the slower frequency couples to the faster frequency (Aru et al., 2015; Hyafil et al., 2015). Interestingly, we observed the degree of CFC to be related to both PLE and ACW. Higher degrees of CFC were directly related to stronger PLE and longer ACW. Given that all three measures are strongly driven by the slower frequencies as featured by long cycle duration, one would have expected their correlation. This is also in line with the findings by He et al. (2010) who observed a close relation between scale‐free properties and CFC (as measured with MI) in ECoG. Our results replicate and extend these findings by showing that CFC correlates not only with PLE, but also with ACW.
Psychologically, the self has been associated with integration in various functions. The self promotes integration of sensory (Sui et al., 2012; Sui et al., 2013), motor (Frings & Wentura, 2014), reward (Sui, 2016; Sui et al., 2013), cognitive, specifically attention (Sui et al., 2013) and decision making (Nakao et al., 2012; Nakao et al., 2013), and emotional (Northoff et al., 2009) functions. Therefore, Sui and Humphreys (2015) characterized the self by integration, therefore self‐integration, where the self provides some sort of “glue” on the psychological level.
How does the integrative function of self on the psychological level stand in relation to temporal integration on the neuronal level as in CFC? Integration on the psychological level is possible only by integrating the different time scales of the various functions and their respective contents. Hence, integration on the psychological level is possible only if integrating different time scales and their respective frequencies. We now assume that such temporal integration on the psychological level is mediated by temporal integration on the neuronal level, which in turn is mediated by CFC.
Based on the MI, which measures CFC, we assume that the integrative function of self allows one to relate short, fast frequency stimuli (as in the beta and gamma frequency range) to the brain's ongoing spontaneous activity, with its stronger power in the slower frequency ranges of delta, theta, and possibly even the infraslow ranges (0.01–0.1 Hz). Specifically, one would hypothesize that the fast frequency stimuli are processed by equally fast frequencies whose amplitude, as evoked during task‐evoked activity, may then be coupled to, and thus integrated with, the spontaneous activity's long phase durations of the slower frequencies. This would produce slow‐fast phase‐amplitude coupling. We consecutively hypothesize that such coupling from the slower frequencies’ phase to the faster frequencies’ amplitude—crossing between spontaneous and task‐evoked activity—may signify the integrative function of self as described by Sui and Humphreys (2015). However, to demonstrate that, future studies are needed which link self‐integration on the psychological level to phase‐amplitude coupling on the neuronal level.
4.4. Limitations
We here tested only for resting state; we did not include an explicit self‐related task in our study. Future studies may therefore want to test how the applied measures of PLE, ACW, and MI are modulated during task‐evoked activity and how that is related to Private self‐consciousness.
Next, we are not able to disentangle self and consciousness. Previous investigations suggest that the self may already be processed unconsciously, for example during the absence of consciousness (Huang et al., 2014; Qin & Northoff, 2011). Future studies may therefore dissociate self and consciousness and investigate which is related to the various measures of the temporo‐spatial signature.
Thirdly, we were unable to locate exactly the temporal measures in specific regions of the brain due to the spatial limitations of EEG. Our data does however support the involvement of cortical midline structures, such as the pACC and PCC, as their eLORETA‐based activity correlated only with Private self‐consciousness.
Finally, our support vector machine analysis employed a rather small amount of training data. As this analysis was merely to supplement our main findings, we did not view this as a major issue.
5. CONCLUSION
We investigated the temporal signature of the brain's spontaneous activity with EEG and linked that to self‐consciousness. Our findings show that specifically Private self‐consciousness is positively related to neuronal measures of temporal nestedness through PLE, temporal continuity through ACW, and temporal integration through CFC/MI. Together with our results from machine learning, these findings suggest that the self is encoded (or represented) in the brain's spontaneous activity in a temporal way. The temporal signature of the brain's spontaneous activity may thus encode or represent self‐related information in a temporal way. Although not demonstrated here explicitly, our data suggest that the temporal features of the brain's spontaneous activity—temporal nestedness, continuity, and integration—translate into corresponding temporal features on the psychological level. Temporal features may thus provide the “common currency” between brain and self such that the latter can then be characterized primarily in a temporal way.
CONFLICT OF INTEREST
The authors declare that they have no conflicts of interest.
ACKNOWLEDGMENTS
This work was supported by the grants from the EJLB‐Michael Smith Foundation, the Canadian Institutes of Health Research (CIHR), the Ministry of Science and Technology of China, the National Key R&D Program of China (2016YFC1306700), the Hope of Depression Foundation (HDRF), and the Start‐up Research Grant in Hangzhou Normal University (to Georg Northoff).
Wolff A, Di Giovanni DA, Gómez‐Pilar J, et al. The temporal signature of self: Temporal measures of resting‐state EEG predict self‐consciousness. Hum Brain Mapp. 2019;40:789–803. 10.1002/hbm.24412
Funding information: Hangzhou Normal University; Hope of Depression Foundation (HDRF); National Key R&D Program of China, Grant/Award Number: 2016YFC1306700; Ministry of Science and Technology of China; Canadian Institutes of Health Research
REFERENCES
- Abe, S. , & Bagozzi, R. (1996). An investigation of construct validity and generalizability of the self‐concept: Self‐consciousness in Japan and the United States. Journal of International Consumer Marketing, 8, 97–123. [Google Scholar]
- Arazi, A. , Gonen‐Yaacovi, G. , & Dinstein, I. (2017). The magnitude of trial‐by‐trial neural variability is reproducible over time and across tasks in humans. eNeuro, 4, 0292–17. 2017. [DOI] [PMC free article] [PubMed] [Google Scholar]
- Aru, J. , Aru, J. , Priesemann, V. , Wibral, M. , Lana, L. , Pipa, G. , … Vicente, R. (2015). Untangling cross‐frequency coupling in neuroscience. Current Opinion in Neurobiology, 31, 51–61. [DOI] [PubMed] [Google Scholar]
- Bai, Y. , Liang, Z. , Li, X. , Voss, L. J. , & Sleigh, J. W. (2015). Permutation Lempel‐Ziv complexity measure of electroencephalogram in GABAergic anaesthetics. Physiological Measurement, 36, 2483–2501. [DOI] [PubMed] [Google Scholar]
- Banoczi, W. (2005). How some drugs affect the electroencephalogram (EEG). American Journal of Electroneurodiagnostic Technology, 45, 118–129. [PubMed] [Google Scholar]
- Benjamini, Y. , & Hochberg, Y. (1995). Controlling the false discovery rate : A practical and powerful approach to multiple testing. Journal of the Royal Statistical Society, 57, 289–300. [Google Scholar]
- Bonnefond, M. , Kastner, S. , & Jensen, O. (2017). Communication between brain areas based on nested oscillations. eNeuro, 4, ENEURO.0153. [DOI] [PMC free article] [PubMed] [Google Scholar]
- Bullmore, E. , & Sporns, O. (2009). Complex brain networks: Graph theoretical analysis of structural and functional systems. Nature Reviews. Neuroscience, 10, 186–198. [DOI] [PubMed] [Google Scholar]
- Buzsáki, G. (2007). The structure of consciousness. Nature, 446, 267. [DOI] [PubMed] [Google Scholar]
- Buzsáki, G. , & Draguhn, A. (2004). Neuronal oscillations in cortical networks. Science (80), 304, 1926–1929. [DOI] [PubMed] [Google Scholar]
- Buzsáki, G. , Logothetis, N. , & Singer, W. (2013). Scaling brain size, keeping timing: Evolutionary preservation of brain rhythms. Neuron, 80, 751–764. [DOI] [PMC free article] [PubMed] [Google Scholar]
- Canolty, R. T. , Edwards, E. , Dalal, S. S. , Soltani, M. , Nagarajan, S. S. , Kirsch, H. E. , … Knight, R. T. (2009). High gamma power is phase‐locked to theta oscillations in human neocortex. Science, 313, 1626–1628. [DOI] [PMC free article] [PubMed] [Google Scholar]
- Canolty, R. T. , & Knight, R. T. (2010). The functional role of cross‐frequency coupling. Trends in Cognitive Sciences, 14, 506–515. [DOI] [PMC free article] [PubMed] [Google Scholar]
- Chang, C.‐C. , & Lin, C.‐J. (2011). LIBSVM: A library for support vector machines. ACM Transactions on Intelligent Systems and Technology, 2, 1–27. [Google Scholar]
- Cruzat, J. , Deco, G. , Tauste‐Campo, A. , Principe, A. , Costa, A. , Kringelbach, M. L. , & Rocamora, R. (2018). The dynamics of human cognition: Increasing global integration coupled with decreasing segregation found using iEEG. Neuroimage, 172, 492–505. [DOI] [PubMed] [Google Scholar]
- D'Argembeau, A. , Collette, F. , Van Der Linden, M. , Laureys, S. , Del Fiore, G. , Degueldre, C. , … Salmon, E. (2005). Self‐referential reflective activity and its relationship with rest: A PET study. NeuroImage, 25, 616–624. [DOI] [PubMed] [Google Scholar]
- Davey, C. G. , Pujol, J. , & Harrison, B. J. (2016). Mapping the self in the brain's default mode network. NeuroImage, 132, 390–397. [DOI] [PubMed] [Google Scholar]
- Ersner‐Hershfield, H. , Tess Garton, M. , Ballard, K. , Samanez‐Larkin, G. R. , & Knutson, B. (2009). Don't stop thinking about tomorrow: Individual differences in future self‐continuity account for saving. Judgment and Decision Making, 4, 280–286. [PMC free article] [PubMed] [Google Scholar]
- Ersner‐Hershfield, H. , Wimmer, G. E. , & Knutson, B. (2009). Saving for the future self: Neural measures of future self‐continuity predict temporal discounting. Social Cognitive and Affective Neuroscience, 4, 85–92. [DOI] [PMC free article] [PubMed] [Google Scholar]
- Fenigstein, A. , Scheier, M. F. , & Buss, A. H. (1975). Public and private self‐consciousness: Assessment and theory. Journal of Consulting and Clinical Psychology, 43, 522–527. [Google Scholar]
- Frings, C. , & Wentura, D. (2014). Self‐priorization processes in action and perception. Journal of Experimental Psychology. Human Perception and Performance, 40, 1737–1740. [DOI] [PubMed] [Google Scholar]
- Fuchs, M. (2002). A standardize boundary element method volume conductor model. Clinical Neurophysiology, 113, 702–712. [DOI] [PubMed] [Google Scholar]
- Hahn, T. , Dresler, T. , Ehlis, A. C. , Pyka, M. , Dieler, A. C. , Saathoff, C. , … Fallgatter, A. J. (2012). Randomness of resting‐state brain oscillations encodes Gray's personality trait. NeuroImage, 59, 1842–1845. [DOI] [PubMed] [Google Scholar]
- He, B. J. (2011). Scale‐free properties of the functional magnetic resonance imaging signal during rest and task. The Journal of Neuroscience, 31, 13786–13795. [DOI] [PMC free article] [PubMed] [Google Scholar]
- He, B. J. (2013). Spontaneous and task‐evoked brain activity negatively interact. The Journal of Neuroscience, 33, 4672–4682. [DOI] [PMC free article] [PubMed] [Google Scholar]
- He, B. J. (2014). Scale‐free brain activity: Past, present, and future. Trends in Cognitive Sciences, 18, 480–487. [DOI] [PMC free article] [PubMed] [Google Scholar]
- He, B. J. , Zempel, J. M. , Snyder, A. Z. , & Raichle, M. E. (2010). The temporal structures and functional significance of scale‐free brain activity. Neuron, 66, 353–369. [DOI] [PMC free article] [PubMed] [Google Scholar]
- Honey, C. J. , Thesen, T. , Donner, T. H. , Silbert, L. J. , Carlson, C. E. , Devinsky, O. , … Hasson, U. (2012). Slow cortical dynamics and the accumulation of information over long timescales. Neuron, 76, 423–434. [DOI] [PMC free article] [PubMed] [Google Scholar]
- Hu, C. , Di, X. , Eickhoff, S. B. , Zhang, M. , Peng, K. , Guo, H. , & Sui, J. (2016). Distinct and common aspects of physical and psychological self‐representation in the brain: A meta‐analysis of self‐bias in facial and self‐referential judgements. Neuroscience and Biobehavioral Reviews, 61, 197–207. [DOI] [PubMed] [Google Scholar]
- Huang, Z. , Obara, N. , Davis, H. , Pokorny, J. , & Northoff, G. (2016). The temporal structure of resting‐state brain activity in the medial prefrontal cortex predicts self‐consciousness. Neuropsychologia, 82, 161–170. [DOI] [PubMed] [Google Scholar]
- Huang, Z. , Wang, Z. , Zhang, J. , Dai, R. , Wu, J. , Li, Y. , … Northoff, G. (2014). Altered temporal variance and neural synchronization of spontaneous brain activity in anesthesia. Human Brain Mapping, 35, 5368–5378. [DOI] [PMC free article] [PubMed] [Google Scholar]
- Huang, Z. , Zhang, J. , Longtin, A. , Dumont, G. , Duncan, N. W. , Pokorny, J. , … Northoff, G. (2017). Is there a nonadditive interaction between spontaneous and evoked activity? Phase‐dependence and its relation to the temporal structure of scale‐free brain activity. Cerebral Cortex, 27, 1–23. [DOI] [PubMed] [Google Scholar]
- Huang, Z. , Zhang, J. , Wu, J. , Liu, X. , Xu, J. , Zhang, J. , … Northoff, G. (2018). Disrupted neural variability during propofol‐induced sedation and unconsciousness. Human Brain Mapping, 4, 1–12. [DOI] [PMC free article] [PubMed] [Google Scholar]
- Hyafil, A. , Giraud, A. A. L. , Fontolan, L. , & Gutkin, B. (2015). Neural cross‐frequency coupling: Connecting architectures, mechanisms, and functions. Trends in Neurosciences, 38, 725–740. [DOI] [PubMed] [Google Scholar]
- Jurcak, V. , Tsuzuki, D. , & Dan, I. (2007). 10/20, 10/10, and 10/5 systems revisited: Their validity as relative head‐surface‐based positioning systems. NeuroImage, 34, 1600–1611. [DOI] [PubMed] [Google Scholar]
- Lakatos, P. , Karmos, G. , Mehta, A. D. , Ulbert, I. , & Schroeder, C. E. (2008). Entrainment of neuronal oscillations as a mechanism of Attentional selection. Science (80), 320, 110–113. [DOI] [PubMed] [Google Scholar]
- Lei, X. , Zhao, Z. , & Chen, H. (2013). Extraversion is encoded by scale‐free dynamics of default mode network. NeuroImage, 74, 52–57. [DOI] [PubMed] [Google Scholar]
- Linkenkaer‐Hansen, K. , Nikouline, V. V. , Palva, J. M. , & Ilmoniemi, R. J. (2001). Long‐range temporal correlations and scaling behavior in human brain oscillations. The Journal of Neuroscience, 21, 1370–1377. [DOI] [PMC free article] [PubMed] [Google Scholar]
- Murray, J. D. , Bernacchia, A. , Freedman, D. J. , Romo, R. , Wallis, J. D. , Cai, X. , … Wang, X.‐J. J. (2014). A hierarchy of intrinsic timescales across primate cortex. Nature Neuroscience, 17, 1661–1663. [DOI] [PMC free article] [PubMed] [Google Scholar]
- Murray, R. J. , Debbané, M. , Fox, P. T. , Bzdok, D. , & Eickhoff, S. B. (2015). Functional connectivity mapping of regions associated with self‐ and other‐processing. Human Brain Mapping, 36, 1304–1324. [DOI] [PMC free article] [PubMed] [Google Scholar]
- Murray, R. J. , Schaer, M. , & Debbané, M. (2012). Degrees of separation: A quantitative neuroimaging meta‐analysis investigating self‐specificity and shared neural activation between self‐ and other‐reflection. Neuroscience and Biobehavioral Reviews, 36, 1043–1059. [DOI] [PubMed] [Google Scholar]
- Nakao, T. , Bai, Y. , Nashiwa, H. , & Northoff, G. (2013). Resting‐state EEG power predicts conflict‐related brain activity in internally guided but not in externally guided decision‐making. NeuroImage, 66, 9–21. [DOI] [PubMed] [Google Scholar]
- Nakao, T. , Kanayama, N. , Katahira, K. , Odani, M. , Ito, Y. , Hirata, Y. , … Northoff, G. (2016). Post‐response βγ power predicts the degree of choice‐based learning in internally guided decision‐making. Scientific Reports, 6, 1–9. [DOI] [PMC free article] [PubMed] [Google Scholar]
- Nakao, T. , Ohira, H. , & Northoff, G. (2012). Distinction between externally vs. internally guided decision‐making: Operational differences, meta‐analytical comparisons and their theoretical implications. Frontiers in Neuroscience, 6, 1–26. [DOI] [PMC free article] [PubMed] [Google Scholar]
- Northoff, G. (2016). Is the self a higher‐order or fundamental function of the brain? The “basis model of self‐specificity” and its encoding by the brain's spontaneous activity. Cognitive Neuroscience, 7, 203–222. [DOI] [PubMed] [Google Scholar]
- Northoff, G. (2017). Personal identity and cortical midline structure (CMS): Do temporal features of CMS neural activity transform into “self‐continuity”? Psychological Inquiry, 28, 122–131. [Google Scholar]
- Northoff, G. , & Heinzel, A. (2006). First‐person neuroscience: A new methodological approach for linking mental and neuronal states. Philosophy, Ethics, and Humanities in Medicine, 1, E3. [DOI] [PMC free article] [PubMed] [Google Scholar]
- Northoff, G. , Heinzel, A. , de Greck, M. , Bermpohl, F. , Dobrowolny, H. , & Panksepp, J. (2006). Self‐referential processing in our brain‐a meta‐analysis of imaging studies on the self. NeuroImage, 31, 440–457. [DOI] [PubMed] [Google Scholar]
- Northoff, G. , Schneider, F. , Rotte, M. , Matthiae, C. , Tempelmann, C. , Wiebking, C. , … Panksepp, J. (2009). Differential parametric modulation of self‐relatedness and emotions in different brain regions. Human Brain Mapping, 30, 369–382. [DOI] [PMC free article] [PubMed] [Google Scholar]
- Oldfield, R. (1971). The assessment and analysis of handedness: The Edinburgh inventory. Neuropsychologia, 9, 97–113. [DOI] [PubMed] [Google Scholar]
- Palva, J. M. , Zhigalov, A. , Hirvonen, J. , Korhonen, O. , Linkenkaer‐Hansen, K. , & Palva, S. (2013). Neuronal long‐range temporal correlations and avalanche dynamics are correlated with behavioral scaling laws. Proceedings of the National Academy of Sciences, 110, 3585–3590. [DOI] [PMC free article] [PubMed] [Google Scholar]
- Pascual‐Marqui RD (2007): Discrete, 3D distributed linear imaging methods of electric neuronal activity. Part 1: Exact, zero error localization. arXiv: 0710.3341.
- Pascual‐Marqui, R. D. , Michel, C. M. , & Lehmann, D. (1994). Low resolution electromagnetic tomography: A new method for localizing electrical activity in the brain. International Journal of Psychophysiology, 18, 49–65. [DOI] [PubMed] [Google Scholar]
- Power, J. D. , Schlaggar, B. L. , Lessov‐Schlaggar, C. N. , & Petersen, S. E. (2013). Evidence for hubs in human functional brain networks. Neuron, 79, 798–813. [DOI] [PMC free article] [PubMed] [Google Scholar]
- Qin, P. , Grimm, S. , Duncan, N. W. , Fan, Y. , Huang, Z. , Lane, T. , … Northoff, G. (2016). Spontaneous activity in default‐mode network predicts ascription of self‐relatedness to stimuli. Social Cognitive and Affective Neuroscience, 11, 693–702. [DOI] [PMC free article] [PubMed] [Google Scholar]
- Qin, P. , & Northoff, G. (2011). How is our self related to midline regions and the default‐mode network? NeuroImage, 57, 1221–1233. [DOI] [PubMed] [Google Scholar]
- Richter, C. , Babo‐Rebelo, M. , Schwartz, D. , & Tallon‐Baudry, C. (2017). Phase‐amplitude coupling at the organism level: The amplitude of spontaneous alpha rhythm fluctuations varies with the phase of the infra‐slow gastric basal rhythm. NeuroImage, 146, 951–958. [DOI] [PMC free article] [PubMed] [Google Scholar]
- Scheier, M. F. , & Carver, C. S. (1985). The self‐consciousness scale: A revised version for use with general populations. Journal of Applied Social Psychology, 15, 687–699. [Google Scholar]
- Schilbach, L. , Timmermans, B. , Reddy, V. , Costall, A. , Bente, G. , Schlicht, T. , & Vogeley, K. (2013). A second‐person neuroscience in interaction. The Behavioral and Brain Sciences, 36, 441–462. [DOI] [PubMed] [Google Scholar]
- Schneider, F. , Bermpohl, F. , Heinzel, A. , Rotte, M. , Walter, M. , Tempelmann, C. , … Northoff, G. (2008). The resting brain and our self: Self‐relatedness modulates resting state neural activity in cortical midline structures. Neuroscience, 157, 120–131. [DOI] [PubMed] [Google Scholar]
- Sui, J. (2016). Self‐reference acts as a Golden thread in binding. Trends in Cognitive Sciences, 20, 482–483. [DOI] [PMC free article] [PubMed] [Google Scholar]
- Sui, J. , He, X. , & Humphreys, G. W. (2012). Perceptual effects of social salience: Evidence from self‐prioritization effects on perceptual matching. Journal of Experimental Psychology. Human Perception and Performance, 38, 1105–1117. [DOI] [PubMed] [Google Scholar]
- Sui, J. , & Humphreys, G. W. (2015). The integrative self: How self‐reference integrates perception and memory. Trends in Cognitive Sciences, 19, 719–728. [DOI] [PubMed] [Google Scholar]
- Sui, J. , & Humphreys, G. W. (2016). The ubiquitous self: What the properties of self‐bias tell us about the self. Annals of the New York Academy of Sciences, 1396, 222–235. [DOI] [PMC free article] [PubMed] [Google Scholar]
- Sui, J. , Rotshtein, P. , & Humphreys, G. W. (2013). Coupling social attention to the self forms a network for personal significance. Proceedings of the National Academy of Sciences, 110, 7607–7612. [DOI] [PMC free article] [PubMed] [Google Scholar]
- Tort, A. B. L. , Komorowski, R. , Eichenbaum, H. , & Kopell, N. (2010). Measuring phase‐amplitude coupling between neuronal oscillations of different frequencies. Journal of Neurophysiology, 104, 1195–1210. [DOI] [PMC free article] [PubMed] [Google Scholar]
- Tort, A. B. L. , Kramer, M. A. , Thorn, C. , Gibson, D. J. , Kubota, Y. , Graybiel, A. M. , & Kopell, N. J. (2008). Dynamic cross‐frequency couplings of local field potential oscillations in rat striatum and hippocampus during performance of a T‐maze task. Proceedings of the National Academy of Sciences, 105, 20517–20522. [DOI] [PMC free article] [PubMed] [Google Scholar]
- Whitfield‐Gabrieli, S. , & Ford, J. M. (2012). Default mode network activity and connectivity in psychopathology. Annual Review of Clinical Psychology, 8(8), 49–75. [DOI] [PubMed] [Google Scholar]
- Yeo, B. T. T. , Krienen, F. M. , Sepulcre, J. , Sabuncu, M. R. , Lashkari, D. , Hollinshead, M. , … Buckner, R. L. (2011). The organization of the human cerebral cortex estimated by intrinsic functional connectivity. Journal of Neurophysiology, 106, 1125–1165. [DOI] [PMC free article] [PubMed] [Google Scholar]