

Abstract
Over the past decades, neuroimaging has become widely used to investigate structural and functional brain abnormality in neuropsychiatric disorders. The results of individual neuroimaging studies, however, are frequently inconsistent due to small and heterogeneous samples, analytical flexibility, and publication bias toward positive findings. To consolidate the emergent findings toward clinically useful insight, meta‐analyses have been developed to integrate the results of studies and identify areas that are consistently involved in pathophysiology of particular neuropsychiatric disorders. However, it should be considered that the results of meta‐analyses could also be divergent due to heterogeneity in search strategy, selection criteria, imaging modalities, behavioral tasks, number of experiments, data organization methods, and statistical analysis with different multiple comparison thresholds. Following an introduction to the problem and the concepts of quantitative summaries of neuroimaging findings, we propose practical recommendations for clinicians and researchers for conducting transparent and methodologically sound neuroimaging meta‐analyses. This should help to consolidate the search for convergent regional brain abnormality in neuropsychiatric disorders.
Keywords: guideline, meta‐analysis, neuroimaging, neuropsychiatric disorders, systematic review
1. INTRODUCTION
For many years, quantitative assessment of pathological changes in psychiatric or neurological patients' living brains was hardly possible. During the last decades, however, neuroimaging technology has become a promising tool to quantify cerebral anatomy and indirectly, neuronal activity (Phillips, 2012). Nowadays, neuroimaging methods including task‐based or resting‐state functional magnetic resonance imaging (rs‐fMRI), positron emission tomography (PET), and voxel‐based morphometry (VBM) are widely applied to explore structural and functional brain alterations in various mental illnesses. The capabilities of these modalities provide valuable insight into their pathophysiology (Eickhoff & Etkin, 2016; Linden, 2012). In spite of the substantial advances, results of the individual neuroimaging studies are largely inconsistent and often conflicting. These inconsistencies could be attributed to small number of subjects that cannot easily be increased (due to constraints on available patient pool, expenses, and technical barriers), various structural or functional modalities, flexible experimental designs, and different preprocessing and statistical approaches (Button et al., 2013; Kharabian Masouleh, et al., 2019; Müller et al., 2018). The other inconsistency in neuroimaging studies pertains to heterogeneous clinical populations, which originates from the diagnostic criteria for specific neuropsychiatric disorders, the healthcare system, and cultural diversities. Furthermore, there seems to be a substantial bias toward publishing positive results, which might technically inflate false positives rates (Eklund, Nichols, & Knutsson, 2016) and may contribute to the possibility of a large amount of spurious findings. In addition, it has been argued that the appeal for publishing new positive findings frequently obscures the truth about underlying mechanisms behind such disorders, even with limited replication studies (Fletcher & Grafton, 2013; Tahmasian et al., 2018a, 2018b; Yeung, 2017).
The main goal of clinical neuroimaging studies is to identify brain region(s) associated with cognitive, affective, or behavioral dysfunctions. However, this quests for publishing novel findings, as the ultimate aim, should translate the insights from structural and functional imaging experiments into the valid and practically relevant clinical applications. This requires the consolidation of a heterogeneous literature to distil robust findings and common patterns. Thus, the clinical implications of data integration provide clinicians with a better understanding of the complex pathophysiology of brain disorders. Hence, there is a clear need to identify the consistent functional and anatomical patterns across prior findings, differentiate spurious from replicable results, and quantitatively consolidate effects in a particular neurological or psychiatric disorder.
There is a plethora of methods available for summarizing previous findings (Borenstein, Hedges, Higgins, & Rothstein, 2009), such as qualitative systematic, narrative, or strategic reviews, as well as quantitative or qualitative meta‐analyses. Systematic reviews usually collect weight and qualitatively summarize the available evidence on a condition based on the predefined eligibility criteria and a comprehensive search strategy. Meta‐analyses, in turn, are a heterogeneous set of statistical approaches that start from the same premise, but have the goal of quantitative integration of the results of previous studies. Both of them are profound tools to provide summary of the existing, presumably noisy literature. The clinical utility of systematic reviews and meta‐analyses are manifold (Moher, et al., 2009; Uman, 2011). They can be used as: (a) educational tools providing a starting point for students, researchers and clinicians striving to become familiar with a new topic, (b) consensus‐building methods to arrive at consolidated knowledge with a new clinical challenge, (c) ways to shed light on a gap in the literature, (d) a reference point for comparing future individual studies, and (e) priors for future more targeted analyses, alleviating the curse of dimensionality that is ever‐so‐prevalent in neuroimaging (Fiest, Pringsheim, Patten, Svenson, & Jette, 2014; Foroutan, Guyatt, Alba, & Ross, 2018; Gopalakrishnan & Ganeshkumar, 2013; Sheehan & Lam, 2015).
Reviews and meta‐analyses can thus both by themselves and in combination provide critical advances in the field by consolidating the evidence and suggesting new hypotheses (Sepehry, Lang, Hsiung, & Rauscher, 2016). That being said, the value of either methods critically depends on their search strategy, approach for compiling and filtering data, statistical and interlectual rigidity for the synthesis, and the clarity of reporting. For example, to ensure the quality of the reviews, the “Enhancing the Quality and Transparency Of health Research” network (EQUATOR) (http://www.equator-network.org) reporting guideline suggests to use a set of Preferred Reporting Items for Systematic Reviews and Meta‐Analyses “PRISMA,” when reporting search strategy and filtering based on in‐/exclusion criteria (Moher, et al., 2009).
Despite the undisputed importance of meta‐analyses in neuroimaging and the large number of such studies on virtually all neurological and psychiatric disorders, there are limited resources for standards and practical guidelines for neuroimaging meta‐analyses. In particular, while technical aspects of performing neuroimaging meta‐analyses were recently discussed (Müller et al., 2018), a similar standardization of clinical meta‐analyses, arguably a key area of future applications, is critically lagging. This shortcoming is reflected in the large heterogeneity of neuroimaging meta‐analyses aiming to consolidate the literature on neurobiological underpinnings of neuropsychiatric disorders, which shows little consistency. Hence, we provide a glance on the qualitative and quantitative methods to integrate the divergent results and suggest best‐practice recommendations for clinical neuroimaging meta‐analyses. Importantly, we focus on the conceptual and practical implications/considerations, particularly for researchers entering the field, while referring the readers to previous overviews for more technical details (Müller et al., 2018).
In line with this educational focus, we set the stage by outlining and discussing the differences between reviews and meta‐analyses, as well as between classical approaches to behavioral meta‐analyses on the one hand, and neuroimaging meta‐analyses on the other hand. Subsequently, we provide an overview and practical recommendations for search strategies, data collection, and dealing with multiple experiments on the same cohorts (a common phenomenon in the clinical neuroimaging literature) before briefly commenting on data analysis methods. Overall, this work complements more statistically oriented overviews with practical guideline for clinicians and researchers to improve transparency in search strategy, data organization, validity of analysis, and quality of reports in neuroimaging meta‐analysis.
2. REVIEWS VERSUS META‐ANALYSES
The various methodologies for integrating previous research studies may be aligned on a continuum, based on the trade‐off between flexibility (and often inclusivity) on one hand and the statistical rigor and objective inference on the other (Figure 1).
Figure 1.
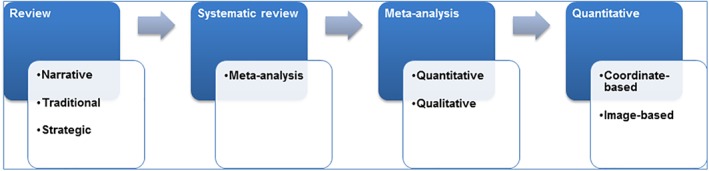
This shows evidence synthesis on a continuum based on the extent of statistical data analysis and applications [Color figure can be viewed at http://wileyonlinelibrary.com]
Narrative reviews represent one end of this continuum, in which, the author(s), usually experts in the respective field summarize and comment on the relevant literature, often against the backdrop of their own expertise. These reports tend to summarize a limited number of previous findings that are commonly selected to support a particular argument, develop new hypotheses, and initiate an overview, for example, as a part of a book chapter. A major strength of this format is the fact that it can identify emerging trends or find discrepancies that would get lost in a broader systematic integration of the entire literature. Likewise, narrative reviews could provide a high‐level overview (eagle eye) on large or complex fields, or can be imperious when only few studies are available on a given neuropsychiatric condition that limits the production of a full‐scale neuroimaging meta‐analysis. These advantages, however, come with the downside of a rather subjective weighting and limited considerations on the actual (numerical) evidence supported by individual reports (Hammersley, 2004).
Systematic reviews, while representing an umbrella term, could be considered the next step in the aforementioned continuum, and are frequently used as the basis for evidence‐based policy‐making and clinical practice (Cooper, 1998; Light & Pillemer, 1984; Slavin, 1986). These types of reviews use explicit procedures and a priori specified methods to identify, appraise, and synthesize the entire available evidence, including the assessment of the file‐drawer effect (systematic bias in the published vs. unpublished literature). Systematic reviews are seen as the canons of quantitative methodology, which can be implemented without any statistical analysis (Hammersley, 2001). Put differently, the advantage of systematic reviews is that the evidence is appraised without missing content since it is systematically examined. However, there is no quantitative approach to evaluate strength or limitation of the cumulative evidence. Thus, quantitative meta‐analyses may be considered as a subtype of systematic reviews where the reported effects can be and hence are statistically integrated (Haidich, 2010). Currently, two distinct research collaborations are examining and overviewing systematic reviews and meta‐analyses (Sepehry, 2006) including the Cochrane collaboration, which was established in 1992 for health care system (Egger & Smith, 1997; Geddes, Freemantle, Streiner, & Reynolds, 1998), and the International Campbell Collaboration (https://www.campbellcollaboration.org), which was established in 2000 for social, behavioral, and educational arena. Additionally, in order to record and maintain information permanently, and allow data sharing and open science, an international Prospective Register of Systematic Reviews PROSPERO (https://www.crd.york.ac.uk/prospero/) was developed by the National Institute for Health Research for reviewing protocols in health‐related outcomes, social care, welfare, education, or international development.
Meta‐analysis, known as a summarizing enterprise (Rosenthal, 1984), first was defined within the social science literature by Gene V. Glass as “The statistical analysis of a large collection of analysis results from individual studies for the purpose of integrating the findings” (Glass, 1976). It has several subtypes, including the most widely known quantitative type, but also several semiquantitative or even qualitative versions (also referred to as qualitative meta‐synthesis, meta‐review, qualitative meta‐data‐analysis, or meta‐ethnography) (Sandelowski, 2004; Timulak, 2009; Zimmer, 2006). Like quantitative meta‐analyses, the qualitative meta‐analyses aggregate available findings to provide a comprehensive description of a phenomenon across studies, but their aims and methodological considerations are different, for example, they do not always calculate an effect size (measure of the magnitude of a phenomenon) (Levitt, 2018).
One commonality between the systematic review and meta‐analysis methods is to systematically assess and summarize the results of previously published research, collected via search of the literature, verifying for file‐drawer's data, or using of computerized search engines and retrieving data to derive conclusions about that body of research. There is the individual patient data meta‐analysis (alias, data pooling, or mega‐analysis), that according to the Cochrane, “rather than extracting summary (aggregate) data from published studies or within consortia, the original research data at the individual case level are sought directly from the researchers responsible for each study. These data are pooled then reanalyzed centrally and combined, if appropriate, in meta‐analyses” (Higgins, Green, Cochrane, Wiley‐Blackwell Online, & Wiley Online, 2008), that is not without experimenter's bias since experimenters can select whom to collect data from and that there is no guideline or controlling bodies for studies to submit protocol a priori. Thus, for a standard meta‐analysis, several standard statistical metrics (effect sizes) were developed to quantify the strength of a phenomenon, such as the Cohens's d, Glass's δ, Hedges's g, Hunter–Schmidt's approach, and many more depending on the type of data (dichotomized, rank‐ordered, ratio, or continuous type data) (Kelley & Preacher, 2012). For example, Cohens's d, Glass's δ, and Hedges's g can be used with descriptive data such as mean and SD along sample size (continuous data type) in each group/or arm of study/clinical trial, whereas odd ratio, hazard ratio, or relative risk ratio can be used on dichotomized data type (presence/absence of an event in a Sample A vs. Sample B). However, given that meta‐analyses and systematic reviews could mix “oranges and apples” due to the heterogeneity of the included studies and their publication biases, quality control is an important step to perform methodologically sound meta‐analyses (Esteves, Majzoub, & Agarwal, 2017; Ioannidis, 2016). To address some conceptual and practical advances in the systematic reviews field, several diagnostic/quality assessment tools are developed, for example, Newcastle‐Ottawa Scale, Jadad scale, and PRISMA (http://www.prisma-statement.org) guideline (Moher, et al., 2009), Committee on Best Practices in Data Analysis and Sharing (Nichols et al., 2017) and Quality of Reporting of Meta‐analyses (QUOROM) (Moher et al., 1999). Such guidelines are set to allow transparency, consistency in methodology, and to obtain high quality data.
Noteworthy that the quantitative meta‐analyses, when correctly performed, provide the most robust outcome, since they provide statistically testable evidence for convergence of the current literature. Yet, given that it is limited to those primary studies that convey all information in the format necessary for statistical aggregation, there is a danger of losing out relevant but less conventional aspects of the literature. Consequently, systematic or even narrative reviews may represent important complements as long as the respective strengths and limitations are clearly communicated. As a more comprehensive description of the advantages, limitations, and potential of different approaches in the general field of clinical research is beyond the scope of this work, we would like to refer the reader to more specialized literature (Sepehry et al., 2016) and focus next on neuroimaging meta‐analyses. Since, the fundamentally qualitative nature of the underlying signals, to date, has focused on localization of effects rather than the quantification of their strengths; we start by noting that this is an evolving field, as standard concepts used in quantitative meta‐analyses are emergent of various fields, are not readily applicable to the high‐dimensional mass‐univariate regime of neuroimaging.
3. VARIOUS APPROACHES FOR NEUROIMAGING META‐ANALYSES
To identify regional brain abnormality in neuropsychiatric disorders, structural and functional neuroimaging studies use local changes in cerebral blood flow, glucose, or oxygen metabolism during neuropsychological task performance or through a task‐free “resting‐state” condition. In clinical neuroimaging studies, statistical analysis is usually performed between patients and healthy individuals, patients across two conditions (e.g., before and after a clinical trial/intervention), or patients with various subtypes. Unlike classical effect‐size meta‐analyses of behavioral and clinical sciences, neuroimaging meta‐analysis does not focus on the presence/absence or strength of an effect at any given location. Rather, identifies the spatial convergence across available data.
Nowadays, the quantitative pooled analysis across individual publications (i.e., meta‐analysis) or the pooled analysis of raw data from individual subjects (i.e., mega‐analysis) is available to increase power and reliability of previous findings (Costafreda, 2009). In order to reach this aim, collaborative scientists are sharing the raw data from different research groups to participate and jointly analyze the pooled individual‐level data in mega‐analysis. Although mega‐analysis might be more powerful than meta‐analysis, it has been demonstrated that meta‐analyses also provide highly comparable results (Sung et al., 2014). In particular, some centers share their raw images to perform mega‐analysis, for example, via PsyMRI, which is a multicenter rs‐fMRI data focusing on major depressive disorder and neurodegenerative diseases (http://www.psymri.org/) (Major Depressive Disorder Working Group of the Psychiatric Genomics Consortium, et al., 2013).
Various types of neuroimaging meta‐analyses are available including the region of interest (ROI)‐based meta‐analysis, image‐based meta‐analysis (IBMA), and coordinate‐based meta‐analysis (CBMA). In the ROI‐based meta‐analysis, each study provides the effect size for the same ROI and then one can perform a third level analysis on ROI‐averaged group results as pioneered by Enhancing Neuroimaging Genetics Through Meta‐Analysis consortium approach (Thompson et al., 2017; Thompson et al., 2019). Sharing full statistical brain maps or voxel‐wise group results (i.e., IBMA) is another approach to conduct meta‐analysis, which combines whole‐brain statistic volumes of results by applying different statistical procedures including fixed and mixed activation maps (Salimi‐Khorshidi, Smith, Keltner, Wager, & Nichols, 2009). The other approach for neuroimaging meta‐analysis is using peak/local maxima coordinates of the observed difference between groups (Eickhoff et al., 2009; Turkeltaub, Eden, Jones, & Zeffiro, 2002). Of note, individual neuroimaging studies report the location of peak coordinates, reflecting identified significant regions (e.g., gray matter volume or functional differences between two groups) in three‐dimensional (3D) anatomical spaces (x, y, z). In CMBA, coordinates of group comparisons from each experiment are extracted from publications and then analyzed. It has been argued that IBMA is superior than CBMA method, as the latter uses less spatial information from each study (Salimi‐Khorshidi et al., 2009). Although the IBMA is a powerful technique to integrate neuroimaging studies, obtaining the original images of publications' results is difficult. In contrast, coordinates are reported almost universally and can be extracted from published papers. Put differently, getting raw images requires that it has been deposited online or the authors share it privately, meaning that active participation/collaboration of the authors is required. Conversely, CBMA works “passively” and investigators could extract data through the entire literature and perform meta‐analysis to identify the potential spatial convergence in a research question (Eickhoff, Bzdok, Laird, Kurth, & Fox, 2012; Tahmasian et al., 2018a, 2018b).
In CBMA, all the included neuroimaging studies report their results in a standard anatomical space to assess the convergent regional abnormality across all subjects that have different brain sizes and shapes. The two commonly used anatomical spaces for spatial normalization and reporting of coordinates of group comparisons include Talairach space (Talairach & Tournoux, 1988) and Montreal Neurological Institute (MNI) space (Evans et al., 1993). Of note, the brain size in MNI space is larger than Talairach space (Lancaster et al., 2007). Hence, all results from various experiments should be converted into the same space before conducting a neuroimaging meta‐analysis (Brett, Christoff, Cusack, & Lancaster, 2001). In most cases, in order to reduce MNI/Talairach coordinate disparity, the reported Talairach coordinates will be transformed into MNI coordinates for analysis (Lancaster et al., 2007). Accordingly, standard anatomical space that was used for normalization of each included study should be carefully identified. Such information is often found in the method or results sections, or in the legends of figures/tables of original publications. Usually, Statistical Parametric Mapping, fMRI of the brain software library, and FreeSurfer software report their results in the MNI space, while analysis of functional neuroimaging and BrainVoyager use Talairach space. Thus, to retrieve the applied space in each study, meta‐analytic investigators should refer to the original publications or contact the authors for clarification.
Noteworthy that in neuroimaging meta‐analysis terminology, “study” refers to an individual scientific publication and “experiment” reflects a single analysis or contrast of interest in a given study yielding localization information (i.e., patients > controls; patients < controls). CBMA is currently a widely employed approach to find consistent brain abnormalities in neurological diseases and psychiatric disorders (Figure 2), which underlines the recent noticeable attention to this method by the researchers.
Figure 2.
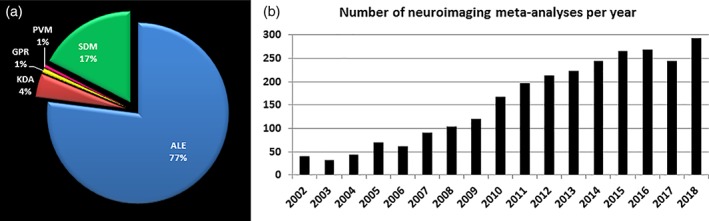
(a) Number of published neuroimaging meta‐analysis based on all applied methods in PubMed. (b) Number of published neuroimaging meta‐analysis per year in PubMed. ALE, activation likelihood estimation; GPR, Gaussian‐process regression; KDR, Kernel density analysis; PVM, parametric voxel‐based meta‐analysis; SDM, signed differential mapping [Color figure can be viewed at http://wileyonlinelibrary.com]
There are various algorithms for conducting CBMA including: (a) activation likelihood estimation (ALE), which assesses the convergence of foci reported from available experiments by modeling the (unknown) true location with Gaussian probability distributions to account for spatial uncertainty associated with the coordinates (Eickhoff et al., 2009; Eickhoff et al., 2012; Turkeltaub et al., 2002), computes the union thereof across experiments and performs statistical testing against a null‐distribution reflecting a random spatial association; (b) kernel density analysis, in which the smoothing kernel is a spherical indicator with a particular radius around the peak coordinate, reflecting the number of peaks within that radius (Wager, Lindquist, & Kaplan, 2007); (c) Gaussian‐process regression (GPR) approach that assesses the unobserved statistic image given that the sparse peak activation allows estimation of effect size at each voxel (Salimi‐Khorshidi, Nichols, Smith, & Woolrich, 2011); (d) parametric voxel‐based meta‐analysis, in which the value of an individual voxel in the summary map represents the proportion of studies reporting an activation within a specified local neighborhood (Costafreda, David, & Brammer, 2009); (e) signed differential mapping (SDM) that reconstructs positive and negative maps in the same image and focuses on between‐study heterogeneity (Radua & Mataix‐Cols, 2012); and (f) Bayesian log‐Gaussian Cox that processes regression and uses fully Bayesian random‐effects meta‐regression model based on log‐Gaussian Cox processes (Samartsidis et al., 2018). Comparing advantages and limitations of the mentioned CBMA approaches is beyond the scope of this article.
To secure the validity of CBMA results, we suggest several practical recommendations for defining research question(s), in‐/exclusion criteria, extracting information from literature, data organization, statistical analysis, and reporting the results. Moreover, we provided a flow diagram to conduct a methodologically sound CBMA by visualizing it's basic steps (Figure 3). In addition, we underscore some important conceptual aspects for clinicians and researchers in the field of neuroimaging meta‐analysis.
Figure 3.
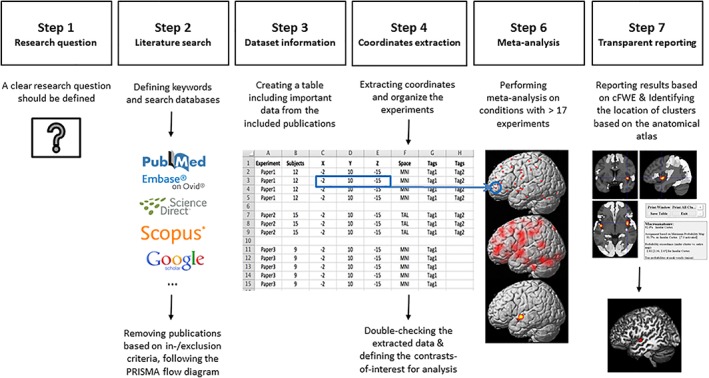
Flowchart illustrating the main steps of performing a neuroimaging meta‐analysis [Color figure can be viewed at http://wileyonlinelibrary.com]
Neuroimaging meta‐analysis including CBMA has been widely used in various neuropsychiatric disorders such as depression (Kaiser, Andrews‐Hanna, Wager, & Pizzagalli, 2015; Lai, 2013; Muller et al., 2017; Sacher et al., 2012), bipolar disorder (Wang et al., 2019; Wegbreit et al., 2014), schizophrenia (Brandl et al., 2019; Jardri, Pouchet, Pins, & Thomas, 2011; Xiao, Zhang, Lui, Yao, & Gong, 2013), Alzheimer's disease (Ferreira, Diniz, Forlenza, Busatto, & Zanetti, 2011; Schroeter, Stein, Maslowski, & Neumann, 2009; Wang et al., 2015), Parkinson's disease (Herz, Eickhoff, Lokkegaard, & Siebner, 2014; Tahmasian et al., 2017; Wang, Zhang, Zang, & Wu, 2018), post‐traumatic stress disorder(Kuhn & Gallinat, 2013; Ramage et al., 2013; Wang et al., 2016), sleep disorders (Javaheipour et al., 2019; Shi et al., 2017; Tahmasian et al., 2016; Tahmasian et al., 2018b), as well as neurodevelopmental disorders such as autism (Dickstein et al., 2013; Nickl‐Jockschat et al., 2012) and attention‐deficit/hyperactivity disorder (ADHD) (Cortese et al., 2012; Cortese et al., 2016; Hart, Radua, Mataix‐Cols, & Rubia, 2012; Hart, Radua, Nakao, Mataix‐Cols, & Rubia, 2013; Samea et al., 2019).
4. HOW TO TRANSLATE AND DEVELOP AN IDEA TO CONDUCT THE META‐ANALYSIS?
Through aforementioned reasons, identifying the convergent regional abnormality in neuropsychiatric disorders via neuroimaging meta‐analysis is a worthwhile tactic to shed light on pathophysiology of disorders. This aim could be achieved in different ways, leading potentially divergent results among CBMA studies. Hence, it is logical to operationalize a research question before starting a CBMA. Following that, one should consider clarifying particular in‐/exclusion criteria, method of data collection, and analysis (see Section 5).
4.1. How to define a novel question?
Sometimes, clinicians or researchers want to find convergent brain abnormality to understand neural correlates of a particular disorder, but the available neuroimaging studies point to divergent findings. Here, there is a clear need to identify a consistent pattern across previous studies using neuroimaging meta‐analysis. However, novelty of the research question should be carefully checked and preregistered (e.g., in PROSPERO), as several neuroimaging meta‐analyses already exist in many fields. For instance, if there is a previous meta‐analysis focusing on the VBM studies, there is a need to find regions with functional disturbances.
A meta‐analysis on task‐based functional studies could theoretically pool over different tasks or focus on a particular one. For example, if one aims to unravel the neural correlates of “cognitive action control,” researchers could include all studies that applied various tasks (e.g., Stop‐signal, Go/No‐Go, Stroop, Flanker, antisaccade, or stimulus–response incongruent tasks). In turn, if specifically reorienting is of interest, only the latter tasks would be appropriate. That is, the broader the construct of interest, the more appropriate and even necessary the pooling across different tasks becomes. Evidently, the other end of the spectrum would be a specific interest in one, well‐defined task such as the n‐back, pooling, for example, across different stimuli. Although researchers are interested to identify consistent regional differences between patients and healthy individuals, in the presence of sufficient number of studies, focusing on comparing subtypes of particular disorder or the effects of specific intervention is also possible. For example, it can be possible to include all behavioral tasks in depression to focus on the various cognitive and emotional processes necessary in all paradigm types. Moreover, performing subanalyses gives the opportunity to focus on more detailed processes of different cognitive or emotional tasks (e.g., positive or negative emotional processing). Accordingly, defining a general question representative of the entire neuroimaging literature, or a specific question reflecting a particular imaging modality or cognitive domain, is a critical step in CBMA. However, further interpretation of the results is highly dependent on the selection criteria and the included experiments. Taken together, we suggest a priori specifying the research question/design of meta‐analysis as precisely as possible.
4.2. Which type of imaging modalities could be included?
Theoretically, any study that has applied whole brain voxel‐wise analysis could be included in CBMA. However, this depends on the research question (i.e., structural or functional alterations or both) pertaining to the neuropsychiatric disorder. For example, including studies using VBM method, which investigates volume differences in cortical or subcortical brain structures, might be a good choice to assess the structural abnormality across the entire brain. Thus, conducting a meta‐analysis on VBM studies allows assessment of the consistent brain atrophy in a specific neuropsychiatric disorder or across various mental disorders (Goodkind et al., 2015). Task‐based functional studies (i.e., fMRI or PET) measure the changes in blood‐oxygen‐level dependent or glucose metabolism in PET imaging through cognitive or emotional tasks. Hence, performing a meta‐analysis on such studies warrants identification of convergent brain regions associated with a particular cognitive/behavioral domain. Conceptually, both fMRI and PET studies can be equally included. That being said, if the number of relevant PET studies is very small, it is usually cleaner to restrict CBMA to fMRI. This increases homogeneity without really compromising power. However, the case is different, if the literature contains a lot of PET findings (e.g., see Zu Eulenburg, Caspers, Roski, & Eickhoff, 2012), in which summarizing across both modalities is pertinent. On the other hand, rs‐fMRI method is associated with the intrinsic neuronal activity of the brain, while research participants are not performing any external cognitive/emotional task. Meta‐analysis on rs‐fMRI studies can be used to detect the consistent brain regions related to intrinsic functional disturbances across published rs‐fMRI studies. Combination of structural and functional studies elucidates converging findings and facilitates finding of important regional abnormalities as highlighted via different neuroimaging modalities. In general, CBMA provides insight to identify the consistent brain regions in neuropsychiatric disorders by assessing spatial convergence of reported peaks across various imaging modalities or focusing on a specific modality based on the research question. Of note, for particular neuropsychiatric cases, data might be unavailable for all imaging modalities (e.g., PET in children or during pregnancy).
4.3. Power of meta‐analysis
Meta‐analyses usually face a trade‐off between the number of included experiments and their heterogeneity. It is recommended that the included studies for analysis should be homogeneous. However, including a larger number of studies increases the power to detect smaller effects and increases robustness for generalization across experimental and analytical procedures (Tahmasian et al., 2018a, 2018b). It has been demonstrated that including at least 17–20 experiments in ALE meta‐analyses is necessary to have sufficient power (80%) to gauge the valid results and to avoid spurious effects driven by a single study (Eickhoff et al., 2016). However, this may not always be possible due to scarcity of evidence, and one need to note that this is an important criterion when planning and performing a replicable CBMA. As mentioned earlier, based on the research question, one might include different tasks, various rs‐fMRI methods, or combination of structural and functional studies. In some cases, conducting analysis on different modalities might be reasonable, but not for each of them separately, due to the low number of experiments on that specific condition. Beside the power issue, as the aim of CBMA is to find convergent points across the entire literature, performing meta‐analysis on very few studies might be counter intuitive.
4.4. Preregistration
In order to avoid duplication, increasing transparency and quality, and to reduce reporting bias, pre‐registration of the meta‐analysis protocol has been suggested. For projects with a health‐related outcome, key information about the design of systematic reviews or meta‐analyses should be registered in PROSPERO (https://www.crd.york.ac.uk/prospero/).
5. METHOD OF PERFORMING CBMA
Hitherto, we described the concepts and differences between meta‐analysis and reviews, presented the available approaches to conduct a neuroimaging meta‐analysis, and discussed how one could develop an idea for a meta‐analysis. Herein, we suggest several practical recommendations to perform CBMA, as the prevailing approach of neuroimaging meta‐analyses, although many of these recommendations are relevant for IBMA too. The following sections provide detailed information of the CBMA workflow steps (Figure 3).
5.1. Search strategy and screening the abstracts
Validity of the meta‐analytic results primarily depends on accuracy of the included data. Thus, using a standard strategy for literature search and data extraction is an important initial step in CBMA. The following recommendations help to extract and organize the required data correctly.
First, the search strategy has to be clearly reported in any CBMA that is, searched databases, date of search, applied keywords, number of studies emerged through each database searching or other sources (e.g., mentioned in available reviews), the number of in‐/excluded abstracts and full‐texts, and the reasons for excluding the papers should be mentioned in the PRISMA flow diagram. For more information, read Moher, et al. (2009). Following the standard strategy to determine a suitable literature, the first important practical point is to identify the appropriate keywords, which are representing the main aim, and ensuring that the search will be highly sensitive without compromising accuracy. Furthermore, in order to have a more comprehensive result for entering synonyms, one could use Medical Subject Headings (MeSH) in PubMed or subject headings (Emtree) for EMBASE. For example, if the main question is to find the convergent functional brain abnormality in a neuropsychiatric disorder, the potential studies for CBMA can be identified through combining different keywords (e.g., ADHD), imaging modality (e.g., “fMRI” or “PET”), and populations (e.g., “human”). Peculiar cognitive/emotion domain (e.g., “emotion regulation”) can be added to the keywords, based on the research question.
The second point is to perform the systematic search via multiple search engines supporting different databases, for example, PubMed/Medline, Scopus, Web of Science, NeuroSynth, BrainMap, and EMBASE, and complement with Google Scholar search to identify all available literature. Furthermore, reference tracking of the identified publications or relevant published review/meta‐analysis could be very useful to locate publications that were missed from the original search. Consequently, after removing duplicated items emerging from multiple database searching and reference tracking, theoretically one should have all the relevant publications. Searching in various databases is fairly sensitive and could cover all the relevant literature. However, due to the low specificity of searches using particular keywords, researchers have to manually assess whether the identified publications are matched (i.e., in terms of concept and methodology) based on the research question. The eligibility assessment of the identified literature starts first by screening the abstracts for in‐/exclusion criteria. For instance, case reports, letter to editors, meta‐analyses, reviews, animal studies, and original studies dealing with irrelevant topics to the research question, or using different clinical population/study design, which are not matched with the main question, should be excluded. Many researchers prefer to exclude non‐English language studies as well.
If at least two appraisers evaluate the abstracts and full texts, the chance of potential mistakes will be minimized. Here, we suggest that the appraisers independently code the abstracts for selection (i.e., “exclude” or “keep” the abstract). It means that if the abstract meets at least one of the exclusion criteria, it should be coded as “exclude”; otherwise, it should be coded as “keep.” If the attributed code for a particular abstract is “keep,” it's full text must be evaluated for eligibility later. We recommend recording the numbers of “excluded” abstracts and the reasons for exclusion, which are needed for filling out the PRISMA flow diagram. In case the two appraisers rate a specific study differently, a third rater should decide for in‐/exclusion of that study and the reason of exclusion, and concordance rate among raters could be reported. To avoid potential mistakes in data collection, particularly the manual data extraction, all details should be double‐checked by all raters.
5.2. Eligibility of the identified publications at full‐text reviews
The eligibility of each study to be included, which has been coded as “keep” in the previous step, must be checked. Thus, researchers have to screen/read the full text of all those abstracts, and decide whether they could be finally included based on the research question. The following recommendations are useful to identify suitable publications.
Studies without reporting the standard anatomical space coordinates (Talairach or MNI) should be excluded, as the coordinates are the input of meta‐analysis and we should compare the findings based on the standard space (e.g., MNI). If the coordinates on the contrast of interest are not reported in the main text or supplementary material, one should contact the authors to obtain such data.
If the aim is to identify the structural/functional difference between patients and healthy subjects, longitudinal and interventional studies (before and after comparisons) could be included only if they report a significant between‐groups results at baseline. In this case, researchers can only include the coordinates of the baseline experiment. Similarly, in the test–retest validation studies, including the coordinates of the baseline experiment from between‐groups difference is a viable strategy.
In the studies performing more than one scan on the same subjects in different conditions (e.g., on‐medication/off‐medication) or patients with different medication status (e.g., drug‐naïve/medicated/remitted), we recommend to only include the condition as homogenous as possible across studies, according to the research question because it has been shown that a particular condition such as medication status can influence the CBMA results (Herz et al., 2014; Tahmasian et al., 2017).
According to the research question, one should decide which particular subjects (e.g., children or adults) or specific subtype of disorder (e.g., melancholic or atypical depression) or stage of patients' condition (e.g., acute or chronic) to be included.
Studies with small sample size (i.e., less than seven individuals in the smaller group) should be excluded, because the results might be spurious and rarely replicable.
A null hypothesis in CBMA is defined as a random spatial association across the whole brain with the assumption that each voxel has the same chance of being activated (Eickhoff et al., 2009; Turkeltaub et al., 2002). Thus, studies that did not perform whole brain analysis cannot be included in order to avoid regional selection bias and inflating the results regarding the particular brain regions. In particular, studies that applied ROI‐based analysis or small‐volume correction (SVC) have to be excluded. It is an important criterion, as the null distribution in CBMA reflects a random spatial association between findings across the whole brain. The assumption that each voxel has a priori the same chance for being reported will be violated by ROI or SVC analyses.
Based on the above‐mentioned reason, seed‐based functional connectivity analysis in rs‐fMRI, diffusion‐tensor imaging and spectroscopy studies should be excluded from CBMA, as they usually focus on particular areas in the brain.
Studies with “hidden ROI analyses” should be excluded. This refers to the studies that do not cover the whole brain during scanning. This factor can be checked in the methods, as the total brain space size is about 14 × 17 × 10 cm3 without the cerebellum (Carter, 2014). Of note, masking analysis to a particular area or conjunction has been applied in some studies to report the results.
In case the included studies have used patients with other neuropsychiatric or medical comorbidities, this should be reported to deliver a clear message about the included data.
One should be cautious to choose and extract the coordinates based on the main aim. For example, in task‐based studies, there is a variety of experiments, for example, Go < No‐Go, Go > No‐Go, Go < baseline, Go > baseline, No‐Go < baseline, No‐Go > baseline in healthy subjects, in patients, and comparisons between controls and patients. In case two groups of patients are compared to the same control group, one should include the specific experiments following their research question. Hence, careful including of the experiments‐of‐interest is necessary in any CBMA.
5.3. Data extracting and organization
After selecting the included publications, the necessary data have to be extracted and organized. As previously mentioned, “experiment” reflects on a single analysis or contrast of interest in a given paper comparing the structural or functional measurements between patients and healthy controls. Each single experiment provides at least one or a set of 3D stereotactic coordinates (x, y, z), reflecting group comparison in a certain condition. To extract and organize the data from the included experiments and other meta‐data from all eligible studies, researchers should extract mandatory required data (i.e., x, y, z coordinates) and meta‐data (i.e., sample size of each group, which is necessary for ALE analysis and the MNI or Talairach space for conversion). Also, Z‐statistics, t‐statistics, or uncorrected p‐values from the eligible experiments are needed for GPR and effect size‐SDM methods, but other meta‐analysis methods treat all foci equally (Radua et al., 2012; Salimi‐Khorshidi et al., 2011). The mandatory information (i.e., coordinates and meta‐data) is necessary for performing meta‐analysis. Other optional data could be extracted from each included study, that is, bibliography, type of imaging modality, diagnostic criteria of patients, neuropsychological assessments, and applied behavioral task or rs‐fMRI methods. This might be helpful to perform separate subanalyses on a particular imaging modality or a specific task, if number of experiments in each condition is at least 17 experiments. For more information, see Section 4.3. This method would be helpful to show an overview table of included studies presenting important information for readers, for example, bibliography, sample size, participants' characteristics, imaging modality, behavioral tasks, applied stimuli in task studies, original analyzing method and used preprocessing/analysis software, and anatomical space.
In any CBMA, collection and organization of the dataset should be precisely defined and transparent. One of the important issues in data organization is handling multiple experiments from the same sample of subjects that could be published in one or several papers. The reason is that the same groups of individuals with multiple experiments do not represent independent observations in the dataset and therefore has a considerable impact on the results compared to groups with only one experiment (Turkeltaub et al., 2012), as it oversample a particular cohort (i.e., include a same sample more than once), and gives it additional (undue) influence on the overall result. Thus, researchers need to report how they organize and analyze the multiple experiments from the same sample. Ideally, for each sample, it would be recommended to include only one experiment to prevent such influence. However, in the literature, there are publications with several reported experiments using multiple modalities or tasks. For instance, both increased (patients > controls) and decreased contrasts (patients < controls) in gray matter volume or activation/deactivation due to a particular task were reported in one or few publications. In contrast, some meta‐analyses include only one experiment from the same sample of subjects, which reflects the best process of CBMA, based on the research question (Cieslik, Mueller, Eickhoff, Langner, & Eickhoff, 2015; Tahmasian et al., 2016; Tahmasian et al., 2017). Hence, there is no standard approach to deal with such experiments. Turkeltaub et al. recently suggested a pooling approach, meaning that if several papers were published based on the same group of subjects and reported several experiments, one should combine them to minimize the within group effects (Turkeltaub et al., 2012). Therefore, in case, there are two or more studies which are performed on the same patient sample and multiple experiments are reported based on the different modalities (e.g., VBM and a task‐fMRI), different tasks, or different analysis methods (e.g., regional homogeneity and amplitude of low frequency fluctuations methods in rs‐fMRI), it has been suggested to only include one of those experiments or merge all experiments together. Usually, one can identify the same sample by looking at the method section (e.g., demographic table of subjects) and list of authors/institutions of the original publications. In case of uncertainty, the authors of original studies can be contacted to ascertain uniqueness of the sample.
5.4. Performing analysis, reporting, and interpretation of the results
There are various methods to conduct CBMA by applying different algorithms by in‐house scripts or via various available software (e.g., GingerALE http://brainmap.org/ale/). In any case, the inputted data are x, y, and z coordinates of the included experiments and the results of CBMA will be cluster(s) showing the significant convergent regional abnormality in a particular neuropsychiatric disorder. Differences between the methods mainly pertain to the actual model used for assessing convergence. As mentioned in Section 3, the technical details of each algorithm are beyond the scope of this guideline.
Like individual neuroimaging studies, in CBMA, there is a clear need to correct for multiple comparisons, as uncorrected thresholding can yield a higher sensitivity, but obviously provides more false positives. Various multiple comparison correction methods are available in neuroimaging meta‐analysis, but one should consider a balance between sensitivity and susceptibility to false positives (Müller et al., 2018). There are two main options for multiple comparisons in neuroimaging meta‐analyses, that is, the familywise error (FWE) or the false discovery rate (FDR), on the voxel or cluster level. It has been shown that voxel‐wise FDR correction is not an optimal method and increases the chance of reporting the spurious clusters (Chumbley & Friston, 2009; Eickhoff et al., 2016). In CBMA, cluster‐level FWE correction has been recommended as the standard and most stringent approach to avoid false positive results. Importantly, on the voxel level, a cluster forming threshold of p < .001 and a cluster‐level threshold of p < 0.05 is suggested (Eickhoff et al., 2016). In general, correction for multiple comparisons is essential for reporting reliable meta‐analysis results.
Of note, CBMA demonstrates “spatial convergence” of structural and functional brain findings across experiments in a particular condition, but does not deliver any information regarding strength of decrease/increase of activation or gray matter alterations (Eickhoff et al., 2012). For example, if researchers found consistent functional abnormality in the amygdala in depression using emotional tasks (e.g., including patients < controls experiments), they should not interpret this finding as “robust decrease in activity” of amygdala in depression, rather lower activation for emotional tasks is consistently reported in the amygdala, rather than the other brain regions across the included experiments. Put differently, CBMA uses the reported peak coordinates to identify “where” the spatial convergence is higher than expected by chance. Of note, results of IBMA and effect size‐SDM still discourse about activation/deactivation of particular brain areas.
Importantly, the contribution of the individual studies to the observed significant convergent cluster and the clear anatomical properties of the identified cluster (x, y, and z location in MNI/Talairach), number of voxels, p‐value, name of the region based on the canonical atlases, for example, Harvard‐Oxford atlas (http://neuro.imm.dtu.dk/wiki/Harvard-Oxford_Atlas), Anatomy toolbox (http://www.fz-juelich.de/inm/inm1/EN/Forschung/_docs/SPMAnatomyToolbox/SPMAnatomyToolbox_node.html), and JuBrain (https://jubrain.fz-juelich.de) should be clearly reported. It is also important to discuss the role of the identified cluster (e.g., when the consistent cluster in the particular part of amygdala) explicitly in pathophysiology of neuropsychiatric disorder, rather than discussing the whole region and overinterpreting the results.
It is worthy to mention that neuroimaging meta‐analyses often yield nonsignificant convergent findings, as reported in imaging‐genetic studies, as well as depression, insomnia disorder, and ADHD (Muller et al., 2017; Nickl‐Jockschat, Janouschek, Eickhoff, & Eickhoff, 2015; Samea et al., 2019; Tahmasian et al., 2018b). The reasons of such negative findings include heterogeneity in the recruited clinical populations, experimental designs, and statistical inference procedures. Recently, reproducibility in neuroimaging studies has been considered as a high priority to deliver valid findings (Button et al., 2013; Kharabian Masouleh, et al., 2019). Hence, we suggest that individual neuroimaging studies on neuropsychiatric disorders use well‐characterized homogeneous clinical samples in terms of selection criteria, comorbidities, gender, age, and medication status. Last but not least, standard preprocessing and statistical neuroimaging analysis should be strictly followed in such studies. Most importantly, however, seeing CBMA as statistical approaches to consolidate and summarize the current state of the literature, we would like to highlight the importance of negative results in meta‐analyses. If sufficiently powered, such null results indicate a clear dissonance among previous findings and hence question whether there is a localizable neurobiological substrate of the underlying construct or disorder.
6. CONCLUSION
Meta‐analysis, unlike qualitative and scoping reviews, uses a statistical approach to combine the results from multiple studies to gain a consistent effect of interest. The results of individual neuroimaging studies are in particular quite heterogeneous due to clinical variability of patients, various experimental designs and statistical inference procedures. CBMA and IBMA are powerful tools to achieve a synoptic view across various neuroimaging findings in a quantitative fashion. CBMA is the most widely used meta‐analysis method to identify consistent structural and/or functional brain abnormality between patients with particular neuropsychiatric disorder and healthy individuals.
The present practical recommendations highlight the important steps in conducting a valid neuroimaging meta‐analysis in neurological and psychiatric disorders. In order to translate a clear message regarding the convergent neuroimaging findings in a particular disorder, we suggest that the research question and analyses' method should be planned in advance, preregistered, and not modified later to find significant findings, in order to minimize experimenter's bias. Also search strategy, selection criteria, number of included experiments, data extraction and organization approach, applied statistical methods, and multiple comparison thresholds, should be transparently reported for readers throughout the main text, supplementary materials and a table of included studies/experiments. Many researchers extract data manually, which leads to flexibility in search strategy and errors in extraction of coordinate, anatomical space, or type of imaging modality/task extraction. To avoid potential mistakes in data collection, we recommend that details should be double checked by independent raters. These suggestions could be considered when publishing both CBMA and IBMA to provide a clear message regarding the convergent brain abnormalities in particular neuropsychiatric disorders. We hope that the present guideline help to remedy the heterogeneity across individual neuroimaging studies in a sound approach. These recommendations allow replication of meta‐analysis results by independent researchers, which has become very important in neuroimaging recently.
CONFLICT OF INTEREST
The authors declare that the research was conducted in the absence of any commercial or financial relationships that could be construed as a potential conflict of interest.
ACKNOWLEDGMENTS
AAS was not financially founded for this project. S.B.E. is supported by the Deutsche Forschungsgemeinschaft (EI 816/11‐1), the National Institute of Mental Health (R01‐MH074457), the Helmholtz Portfolio Theme “Supercomputing and Modeling for the Human Brain” and the European Union's Horizon 2020 Research and Innovation Programme under grant agreement no. 7202070 (HBP SGA1) and under grant agreement no. 785907 (HBP SGA2).
Tahmasian M, Sepehry AA, Samea F, et al. Practical recommendations to conduct a neuroimaging meta‐analysis for neuropsychiatric disorders. Hum Brain Mapp. 2019;40:5142–5154. 10.1002/hbm.24746
Masoud Tahmasian and Amir A. Sepehry contributed equally to this study.
Funding information European Union's Horizon 2020 Research and Innovation Programme, Grant/Award Numbers: 785907, 7202070; Helmholtz Portfolio Theme “Supercomputing and Modeling for the Human Brain”; National Institute of Mental Health, Grant/Award Number: R01‐MH074457; Deutsche Forschungsgemeinschaft, Grant/Award Number: EI 816/11‐1
DATA AVAILABILITY STATEMENT
Data sharing is not applicable to this article as no new data were created or analyzed in this study.
REFERENCES
- Borenstein, M. , Hedges, L. V. , Higgins, J. P. T. , & Rothstein, H. R. (2009). Introduction to meta‐analysis. Chichester, England: John Wiley & Sons. [Google Scholar]
- Brandl, F. , Avram, M. , Weise, B. , Shang, J. , Simoes, B. , Bertram, T. , … Sorg, C. (2019). Specific substantial dysconnectivity in schizophrenia: A transdiagnostic multimodal meta‐analysis of resting‐state functional and structural magnetic resonance imaging studies. Biological Psychiatry, 85, 573–583. [DOI] [PubMed] [Google Scholar]
- Brett, M. , Christoff, K. , Cusack, R. , & Lancaster, J. (2001). Using the Talairach atlas with the MNI template. NeuroImage, 13, 85. [Google Scholar]
- Button, K. S. , Ioannidis, J. P. , Mokrysz, C. , Nosek, B. A. , Flint, J. , Robinson, E. S. , & Munafo, M. R. (2013). Power failure: Why small sample size undermines the reliability of neuroscience. Nature Reviews. Neuroscience, 14, 365–376. [DOI] [PubMed] [Google Scholar]
- Carter, R. (2014). The brain book. London, England: Dorling Kindersley. [Google Scholar]
- Chumbley, J. R. , & Friston, K. J. (2009). False discovery rate revisited: FDR and topological inference using Gaussian random fields. NeuroImage, 44, 62–70. [DOI] [PubMed] [Google Scholar]
- Cieslik, E. C. , Mueller, V. I. , Eickhoff, C. R. , Langner, R. , & Eickhoff, S. B. (2015). Three key regions for supervisory attentional control: Evidence from neuroimaging meta‐analyses. Neuroscience and Biobehavioral Reviews, 48, 22–34. [DOI] [PMC free article] [PubMed] [Google Scholar]
- Cooper, H. M. (1998). Synthesizing research: A guide for literature reviews. Thousand Oaks, CA: SAGE Publications. [Google Scholar]
- Cortese, S. , Castellanos, F. X. , Eickhoff, C. R. , D'Acunto, G. , Masi, G. , Fox, P. T. , … Eickhoff, S. B. (2016). Functional decoding and meta‐analytic connectivity modeling in adult attention‐deficit/hyperactivity disorder. Biological Psychiatry, 80, 896–904. [DOI] [PMC free article] [PubMed] [Google Scholar]
- Cortese, S. , Kelly, C. , Chabernaud, C. , Proal, E. , Di Martino, A. , Milham, M. P. , & Castellanos, F. X. (2012). Toward systems neuroscience of ADHD: A meta‐analysis of 55 fMRI studies. The American Journal of Psychiatry, 169, 1038–1055. [DOI] [PMC free article] [PubMed] [Google Scholar]
- Costafreda, S. G. (2009). Pooling FMRI data: Meta‐analysis, mega‐analysis and multi‐center studies. Frontiers in Neuroinformatics, 3, 33. [DOI] [PMC free article] [PubMed] [Google Scholar]
- Costafreda, S. G. , David, A. S. , & Brammer, M. J. (2009). A parametric approach to voxel‐based meta‐analysis. NeuroImage, 46, 115–122. [DOI] [PubMed] [Google Scholar]
- Dickstein, D. P. , Pescosolido, M. F. , Reidy, B. L. , Galvan, T. , Kim, K. L. , Seymour, K. E. , … Barrett, R. P. (2013). Developmental meta‐analysis of the functional neural correlates of autism spectrum disorders. Journal of the American Academy of Child and Adolescent Psychiatry, 52, 279–289 e16. [DOI] [PMC free article] [PubMed] [Google Scholar]
- Egger, M. , & Smith, G. D. (1997). Meta‐analysis. Potentials and promise. BMJ, 315, 1371–1374. [DOI] [PMC free article] [PubMed] [Google Scholar]
- Eickhoff, S. B. , Bzdok, D. , Laird, A. R. , Kurth, F. , & Fox, P. T. (2012). Activation likelihood estimation meta‐analysis revisited. NeuroImage, 59, 2349–2361. [DOI] [PMC free article] [PubMed] [Google Scholar]
- Eickhoff, S. B. , & Etkin, A. (2016). Going beyond finding the "lesion": A path for maturation of neuroimaging. The American Journal of Psychiatry, 173, 302–303. [DOI] [PubMed] [Google Scholar]
- Eickhoff, S. B. , Laird, A. R. , Grefkes, C. , Wang, L. E. , Zilles, K. , & Fox, P. T. (2009). Coordinate‐based activation likelihood estimation meta‐analysis of neuroimaging data: A random‐effects approach based on empirical estimates of spatial uncertainty. Human Brain Mapping, 30, 2907–2926. [DOI] [PMC free article] [PubMed] [Google Scholar]
- Eickhoff, S. B. , Nichols, T. E. , Laird, A. R. , Hoffstaedter, F. , Amunts, K. , Fox, P. T. , … Eickhoff, C. R. (2016). Behavior, sensitivity, and power of activation likelihood estimation characterized by massive empirical simulation. NeuroImage, 137, 70–85. [DOI] [PMC free article] [PubMed] [Google Scholar]
- Eklund, A. , Nichols, T. E. , & Knutsson, H. (2016). Cluster failure: Why fMRI inferences for spatial extent have inflated false‐positive rates. Proceedings of the National Academy of Sciences of the United States of America, 113, 7900–7905. [DOI] [PMC free article] [PubMed] [Google Scholar]
- Esteves, S. C. , Majzoub, A. , & Agarwal, A. (2017). The problem of mixing 'apples and oranges' in meta‐analytic studies. Translational Andrology and Urology, 6, S412–S413. [DOI] [PMC free article] [PubMed] [Google Scholar]
- Evans, A. C. , Collins, D. L. , Mills, S. R. , Brown, E. D. , Kelly, R. L. , Peters, T. M. (1993). 3D statistical neuroanatomical models from 305 MRI volumes. Nuclear Science Symposium and Medical Imaging Conference, IEEE Conference Record:1813–1817.
- Ferreira, L. K. , Diniz, B. S. , Forlenza, O. V. , Busatto, G. F. , & Zanetti, M. V. (2011). Neurostructural predictors of Alzheimer's disease: A meta‐analysis of VBM studies. Neurobiology of Aging, 32, 1733–1741. [DOI] [PubMed] [Google Scholar]
- Fiest, K. M. , Pringsheim, T. , Patten, S. B. , Svenson, L. W. , & Jette, N. (2014). The role of systematic reviews and meta‐analyses of incidence and prevalence studies in neuroepidemiology. Neuroepidemiology, 42, 16–24. [DOI] [PubMed] [Google Scholar]
- Fletcher, P. C. , & Grafton, S. T. (2013). Repeat after me: Replication in clinical neuroimaging is critical. NeuroImage: Clinical, 2, 247–248. [DOI] [PMC free article] [PubMed] [Google Scholar]
- Foroutan, F. , Guyatt, G. , Alba, A. C. , & Ross, H. (2018). Meta‐analysis: Mistake or milestone in medicine? Heart, 104, 1559–1561. [DOI] [PubMed] [Google Scholar]
- Geddes, J. , Freemantle, N. , Streiner, D. , & Reynolds, S. (1998). Understanding and interpreting systematic reviews and meta‐analyses. Part 1: Rationale, search strategy, and describing results. Evidence‐Based Mental Health, 1, 68–69. [Google Scholar]
- Glass, G. V. (1976). Primary, secondary, and meta‐analysis of research. Educational Researcher, 5, 3–8. [Google Scholar]
- Goodkind, M. , Eickhoff, S. B. , Oathes, D. J. , Jiang, Y. , Chang, A. , Jones‐Hagata, L. B. , … Etkin, A. (2015). Identification of a common neurobiological substrate for mental illness. JAMA Psychiatry, 72, 305–315. [DOI] [PMC free article] [PubMed] [Google Scholar]
- Gopalakrishnan, S. , & Ganeshkumar, P. (2013). Systematic reviews and meta‐analysis: Understanding the best evidence in primary healthcare. Journal of Family Medicine and Primary Care, 2, 9–14. [DOI] [PMC free article] [PubMed] [Google Scholar]
- Haidich, A. B. (2010). Meta‐analysis in medical research. Hippokratia, 14, 29–37. [PMC free article] [PubMed] [Google Scholar]
- Hammersley, M. (2001). On ‘systematic’ reviews of research literatures: A ‘narrative’ response to Evans & Benefield. British Educational Research Journal, 27, 543–554. [Google Scholar]
- Hammersley, M. (2004). Literature Review In Lewis‐Beck M. S., Bryman A., & Liao T. F. (Eds.), The SAGE encyclopedia of social science research methods. Thousand Oaks, CA: SAGE Publications, Inc. [Google Scholar]
- Hart, H. , Radua, J. , Mataix‐Cols, D. , & Rubia, K. (2012). Meta‐analysis of fMRI studies of timing in attention‐deficit hyperactivity disorder (ADHD). Neuroscience and Biobehavioral Reviews, 36, 2248–2256. [DOI] [PubMed] [Google Scholar]
- Hart, H. , Radua, J. , Nakao, T. , Mataix‐Cols, D. , & Rubia, K. (2013). Meta‐analysis of functional magnetic resonance imaging studies of inhibition and attention in attention‐deficit/hyperactivity disorder: Exploring task‐specific, stimulant medication, and age effects. JAMA Psychiatry, 70, 185–198. [DOI] [PubMed] [Google Scholar]
- Herz, D. M. , Eickhoff, S. B. , Lokkegaard, A. , & Siebner, H. R. (2014). Functional neuroimaging of motor control in Parkinson's disease: A meta‐analysis. Human Brain Mapping, 35, 3227–3237. [DOI] [PMC free article] [PubMed] [Google Scholar]
- Higgins, J. P. T. , Green, S. , Cochrane, C. , Wiley‐Blackwell Online B , & Wiley Online L . (2008). Cochrane handbook for systematic reviews of interventions. Hoboken, NJ: Wiley‐Blackwell. [Google Scholar]
- Ioannidis, J. P. (2016). The mass production of redundant, misleading, and conflicted systematic reviews and meta‐analyses. The Milbank Quarterly, 94, 485–514. [DOI] [PMC free article] [PubMed] [Google Scholar]
- Jardri, R. , Pouchet, A. , Pins, D. , & Thomas, P. (2011). Cortical activations during auditory verbal hallucinations in schizophrenia: A coordinate‐based meta‐analysis. The American Journal of Psychiatry, 168, 73–81. [DOI] [PubMed] [Google Scholar]
- Javaheipour, N. , Shahdipour, N. , Noori, K. , Zarei, M. , Camilleri, J. A. , Laird, A. R. , … Tahmasian, M. (2019). Functional brain alterations in acute sleep deprivation: An activation likelihood estimation meta‐analysis. Sleep Medicine Reviews, 46, 64–73. [DOI] [PMC free article] [PubMed] [Google Scholar]
- Kaiser, R. H. , Andrews‐Hanna, J. R. , Wager, T. D. , & Pizzagalli, D. A. (2015). Large‐scale network dysfunction in major depressive disorder: A meta‐analysis of resting‐state functional connectivity. JAMA Psychiatry, 72, 603–611. [DOI] [PMC free article] [PubMed] [Google Scholar]
- Kelley, K. , & Preacher, K. J. (2012). On effect size. Psychological Methods, 17, 137–152. [DOI] [PubMed] [Google Scholar]
- Kharabian Masouleh, S. , Eickhoff, S. B. , Hoffstaedter, F. , Genon, S. , & Alzheimer's Disease Neuroimaging Initiative . (2019). Empirical examination of the replicability of associations between brain structure and psychological variables. eLife, 8, e43464 10.7554/eLife.43464 [DOI] [PMC free article] [PubMed] [Google Scholar]
- Kuhn, S. , & Gallinat, J. (2013). Gray matter correlates of posttraumatic stress disorder: A quantitative meta‐analysis. Biological Psychiatry, 73, 70–74. [DOI] [PubMed] [Google Scholar]
- Lai, C. H. (2013). Gray matter volume in major depressive disorder: A meta‐analysis of voxel‐based morphometry studies. Psychiatry Research, 211, 37–46. [DOI] [PubMed] [Google Scholar]
- Lancaster, J. L. , Tordesillas‐Gutierrez, D. , Martinez, M. , Salinas, F. , Evans, A. , Zilles, K. , … Fox, P. T. (2007). Bias between MNI and Talairach coordinates analyzed using the ICBM‐152 brain template. Human Brain Mapping, 28, 1194–1205. [DOI] [PMC free article] [PubMed] [Google Scholar]
- Levitt, H. M. (2018). How to conduct a qualitative meta‐analysis: Tailoring methods to enhance methodological integrity. Psychotherapy Research, 28, 367–378. [DOI] [PubMed] [Google Scholar]
- Light, R. J. , & Pillemer, D. B. (1984). Summing up: The science of reviewing research. Cambridge, MA: Harvard University Press. [Google Scholar]
- Linden, D. E. (2012). The challenges and promise of neuroimaging in psychiatry. Neuron, 73, 8–22. [DOI] [PubMed] [Google Scholar]
- Major Depressive Disorder Working Group of the Psychiatric Genomics Consortium , Ripke, S. , Wray, N. R. , Lewis, C. M. , Hamilton, S. P. , Weissman, M. M. , … Sullivan, P. F. (2013). A mega‐analysis of genome‐wide association studies for major depressive disorder. Molecular Psychiatry, 18, 497–511. [DOI] [PMC free article] [PubMed] [Google Scholar]
- Moher, D. , Cook, D. J. , Eastwood, S. , Olkin, I. , Rennie, D. , & Stroup, D. F. (1999). Improving the quality of reports of meta‐analyses of randomised controlled trials: The QUOROM statement. Quality of reporting of meta‐analyses. Lancet, 354, 1896–1900. [DOI] [PubMed] [Google Scholar]
- Moher, D. , Liberati, A. , Tetzlaff, J. , Altman, D. G. , & PRISMA Group . (2009). Preferred reporting items for systematic reviews and meta‐analyses: The PRISMA statement. PLoS Medicine, 6, e1000097. [DOI] [PMC free article] [PubMed] [Google Scholar]
- Müller, V. I. , Cieslik, E. C. , Laird, A. R. , Fox, P. T. , Radua, J. , Mataix‐Cols, D. , … Eickhoff, S. B. (2018). Ten simple rules for neuroimaging meta‐analysis. Neuroscience and Biobehavioral Reviews, 84, 151–161. [DOI] [PMC free article] [PubMed] [Google Scholar]
- Muller, V. I. , Cieslik, E. C. , Serbanescu, I. , Laird, A. R. , Fox, P. T. , & Eickhoff, S. B. (2017). Altered brain activity in unipolar depression revisited: Meta‐analyses of neuroimaging studies. JAMA Psychiatry, 74, 47–55. [DOI] [PMC free article] [PubMed] [Google Scholar]
- Nichols, T. E. , Das, S. , Eickhoff, S. B. , Evans, A. C. , Glatard, T. , Hanke, M. , … Yeo, B. T. (2017). Best practices in data analysis and sharing in neuroimaging using MRI. Nature Neuroscience, 20, 299–303. [DOI] [PMC free article] [PubMed] [Google Scholar]
- Nickl‐Jockschat, T. , Habel, U. , Michel, T. M. , Manning, J. , Laird, A. R. , Fox, P. T. , … Eickhoff, S. B. (2012). Brain structure anomalies in autism spectrum disorder—A meta‐analysis of VBM studies using anatomic likelihood estimation. Human Brain Mapping, 33, 1470–1489. [DOI] [PMC free article] [PubMed] [Google Scholar]
- Nickl‐Jockschat, T. , Janouschek, H. , Eickhoff, S. B. , & Eickhoff, C. R. (2015). Lack of meta‐analytic evidence for an impact of COMT Val158Met genotype on brain activation during working memory tasks. Biological Psychiatry, 78, e43–e46. [DOI] [PubMed] [Google Scholar]
- Phillips, M. L. (2012). Neuroimaging in psychiatry: Bringing neuroscience into clinical practice. The British Journal of Psychiatry, 201, 1–3. [DOI] [PubMed] [Google Scholar]
- Radua, J. , & Mataix‐Cols, D. (2012). Meta‐analytic methods for neuroimaging data explained. Biology of Mood & Anxiety Disorders, 2, 6. [DOI] [PMC free article] [PubMed] [Google Scholar]
- Radua, J. , Mataix‐Cols, D. , Phillips, M. L. , El‐Hage, W. , Kronhaus, D. M. , Cardoner, N. , & Surguladze, S. (2012). A new meta‐analytic method for neuroimaging studies that combines reported peak coordinates and statistical parametric maps. European Psychiatry, 27, 605–611. [DOI] [PubMed] [Google Scholar]
- Ramage, A. E. , Laird, A. R. , Eickhoff, S. B. , Acheson, A. , Peterson, A. L. , Williamson, D. E. , … Fox, P. T. (2013). A coordinate‐based meta‐analytic model of trauma processing in posttraumatic stress disorder. Human Brain Mapping, 34, 3392–3399. [DOI] [PMC free article] [PubMed] [Google Scholar]
- Rosenthal, R. (1984). Meta‐analytic procedures for social research. Beverly Hills, CA: SAGE Publications. [Google Scholar]
- Sacher, J. , Neumann, J. , Funfstuck, T. , Soliman, A. , Villringer, A. , & Schroeter, M. L. (2012). Mapping the depressed brain: A meta‐analysis of structural and functional alterations in major depressive disorder. Journal of Affective Disorders, 140, 142–148. [DOI] [PubMed] [Google Scholar]
- Salimi‐Khorshidi, G. , Nichols, T. E. , Smith, S. M. , & Woolrich, M. W. (2011). Using Gaussian‐process regression for meta‐analytic neuroimaging inference based on sparse observations. IEEE Transactions on Medical Imaging, 30, 1401–1416. [DOI] [PubMed] [Google Scholar]
- Salimi‐Khorshidi, G. , Smith, S. M. , Keltner, J. R. , Wager, T. D. , & Nichols, T. E. (2009). Meta‐analysis of neuroimaging data: A comparison of image‐based and coordinate‐based pooling of studies. NeuroImage, 45, 810–823. [DOI] [PubMed] [Google Scholar]
- Samartsidis, P. , Eickhoff, C. R. , Eickhoff, C. B. , Wager, T. D. , Feldman Barrett, L. , Atzil, S. , … Nichols, T. E. (2018). Bayesian log‐Gaussian Cox process regression: Applications to meta‐analysis of neuroimaging working memory studies. Royal Statistical Society, 68(1), 217–234. 10.1111/rssc.12295 [DOI] [PMC free article] [PubMed] [Google Scholar]
- Samea, F. , Soluki, S. , Nejati, V. , Zarei, M. , Cortese, S. , Eickhoff, S. B. , … Eickhoff, C. R. (2019). Brain alterations in children/adolescents with ADHD revisited: A neuroimaging meta‐analysis of 96 structural and functional studies. Neuroscience and Biobehavioral Reviews, 100, 1–8. [DOI] [PMC free article] [PubMed] [Google Scholar]
- Sandelowski, M. (2004). Qualitative meta‐analysis In Lewis‐Beck M. S., bryman A., & Liao T. F. (Eds.), The SAGE encyclopedia of social science research methods. Thousand Oaks, CA: SAGE Publications, Inc. [Google Scholar]
- Schroeter, M. L. , Stein, T. , Maslowski, N. , & Neumann, J. (2009). Neural correlates of Alzheimer's disease and mild cognitive impairment: A systematic and quantitative meta‐analysis involving 1351 patients. NeuroImage, 47, 1196–1206. [DOI] [PMC free article] [PubMed] [Google Scholar]
- Sepehry, A. (2006). Examen de l'effet de potentialisation des médicaments antipsychotiques par les inhibiteurs de la recapture de la sérotonine pour traiter les symptômes négatifs de la schizophrénie: Approche méta‐analytique. (Master's Thesis). Canada: Université de Montréal, Montreal.
- Sepehry, A. A. , Lang, D. , Hsiung, G. Y. , & Rauscher, A. (2016). Prevalence of brain microbleeds in Alzheimer disease: A systematic review and meta‐analysis on the influence of neuroimaging techniques. AJNR. American Journal of Neuroradiology, 37, 215–222. [DOI] [PMC free article] [PubMed] [Google Scholar]
- Sheehan, M. C. , & Lam, J. (2015). Use of systematic review and meta‐analysis in environmental health epidemiology: A systematic review and comparison with guidelines. Current Environmental Health Reports, 2, 272–283. [DOI] [PMC free article] [PubMed] [Google Scholar]
- Shi, Y. , Chen, L. , Chen, T. , Li, L. , Dai, J. , Lui, S. , … Gong, Q. (2017). A meta‐analysis of voxel‐based brain morphometry studies in obstructive sleep Apnea. Scientific Reports, 7, 10095. [DOI] [PMC free article] [PubMed] [Google Scholar]
- Slavin, R. E. (1986). Best‐evidence synthesis: An alternative to meta‐analytic and traditional reviews. Educational Researcher, 15, 5–11. [Google Scholar]
- Sung, Y. J. , Schwander, K. , Arnett, D. K. , Kardia, S. L. , Rankinen, T. , Bouchard, C. , … Rao, D. C. (2014). An empirical comparison of meta‐analysis and mega‐analysis of individual participant data for identifying gene‐environment interactions. Genetic Epidemiology, 38, 369–378. [DOI] [PMC free article] [PubMed] [Google Scholar]
- Tahmasian, M. , Eickhoff, S. B. , Giehl, K. , Schwartz, F. , Herz, D. M. , Drzezga, A. , … Eickhoff, C. R. (2017). Resting‐state functional reorganization in Parkinson's disease: An activation likelihood estimation meta‐analysis. Cortex, 92, 119–138. [DOI] [PMC free article] [PubMed] [Google Scholar]
- Tahmasian, M. , Noori, K. , Samea, F. , Zarei, M. , Spiegelhalder, K. , Eickhoff, S. B. , … Eickhoff, C. R. (2018a). Reply to Hua Liu, HaiCun Shi and PingLei pan: Coordinate based meta‐analyses in a medium sized literature: Considerations, limitations and road ahead. Sleep Medicine Reviews, 42, 236–238. [DOI] [PMC free article] [PubMed] [Google Scholar]
- Tahmasian, M. , Noori, K. , Samea, F. , Zarei, M. , Spiegelhalder, K. , Eickhoff, S. B. , … Eickhoff, C. R. (2018b). A lack of consistent brain alterations in insomnia disorder: An activation likelihood estimation meta‐analysis. Sleep Medicine Reviews, 42, 111–118. [DOI] [PMC free article] [PubMed] [Google Scholar]
- Tahmasian, M. , Rosenzweig, I. , Eickhoff, S. B. , Sepehry, A. A. , Laird, A. R. , Fox, P. T. , … Eickhoff, C. R. (2016). Structural and functional neural adaptations in obstructive sleep apnea: An activation likelihood estimation meta‐analysis. Neuroscience and Biobehavioral Reviews, 65, 142–156. [DOI] [PMC free article] [PubMed] [Google Scholar]
- Talairach, J. , & Tournoux, P. (1988). Co‐planar stereotaxic atlas of the human brain: 3‐Dimensional proportional system: An approach to cerebral imaging (p. 122). Stuttgart, Germany: Georg Thieme. [Google Scholar]
- Thompson, P. , Jahanshad, N. , Ching, C. R. K. , Salminen, L. , Thomopoulos, S. I. , Bright, J. , … Zelman, V. (2019). ENIGMA and global neuroscience: A decade of large‐scale studies of the brain in health and disease across more than 40 countries. PsyArXiv. 10.31234/osf.io/qnsh7 [DOI] [PMC free article] [PubMed] [Google Scholar]
- Thompson, P. M. , Andreassen, O. A. , Arias‐Vasquez, A. , Bearden, C. E. , Boedhoe, P. S. , Brouwer, R. M. , … ENIGMA Consortium . (2017). ENIGMA and the individual: Predicting factors that affect the brain in 35 countries worldwide. NeuroImage, 145, 389–408. [DOI] [PMC free article] [PubMed] [Google Scholar]
- Timulak, L. (2009). Meta‐analysis of qualitative studies: A tool for reviewing qualitative research findings in psychotherapy. Psychotherapy Research, 19, 591–600. [DOI] [PubMed] [Google Scholar]
- Turkeltaub, P. E. , Eden, G. F. , Jones, K. M. , & Zeffiro, T. A. (2002). Meta‐analysis of the functional neuroanatomy of single‐word reading: Method and validation. NeuroImage, 16, 765–780. [DOI] [PubMed] [Google Scholar]
- Turkeltaub, P. E. , Eickhoff, S. B. , Laird, A. R. , Fox, M. , Wiener, M. , & Fox, P. (2012). Minimizing within‐experiment and within‐group effects in activation likelihood estimation meta‐analyses. Human Brain Mapping, 33, 1–13. [DOI] [PMC free article] [PubMed] [Google Scholar]
- Uman, L. S. (2011). Systematic reviews and meta‐analyses. Journal of Canadian Academy of Child and Adolescent Psychiatry, 20, 57–59. [PMC free article] [PubMed] [Google Scholar]
- Wager, T. D. , Lindquist, M. , & Kaplan, L. (2007). Meta‐analysis of functional neuroimaging data: Current and future directions. Social Cognitive and Affective Neuroscience, 2, 150–158. [DOI] [PMC free article] [PubMed] [Google Scholar]
- Wang, J. , Zhang, J. R. , Zang, Y. F. , & Wu, T. (2018). Consistent decreased activity in the putamen in Parkinson's disease: A meta‐analysis and an independent validation of resting‐state fMRI. GigaScience, 7(6), giy071 10.1093/gigascience/giy071 [DOI] [PMC free article] [PubMed] [Google Scholar]
- Wang, T. , Liu, J. , Zhang, J. , Zhan, W. , Li, L. , Wu, M. , … Gong, Q. (2016). Altered resting‐state functional activity in posttraumatic stress disorder: A quantitative meta‐analysis. Scientific Reports, 6, 27131. [DOI] [PMC free article] [PubMed] [Google Scholar]
- Wang, W. Y. , Yu, J. T. , Liu, Y. , Yin, R. H. , Wang, H. F. , Wang, J. , … Tan, L. (2015). Voxel‐based meta‐analysis of grey matter changes in Alzheimer's disease. Translational Neurodegeneration, 4, 6. [DOI] [PMC free article] [PubMed] [Google Scholar]
- Wang, X. , Luo, Q. , Tian, F. , Cheng, B. , Qiu, L. , Wang, S. , … Jia, Z. (2019). Brain grey‐matter volume alteration in adult patients with bipolar disorder under different conditions: A voxel‐based meta‐analysis. Journal of Psychiatry & Neuroscience, 44, 89–101. [DOI] [PMC free article] [PubMed] [Google Scholar]
- Wegbreit, E. , Cushman, G. K. , Puzia, M. E. , Weissman, A. B. , Kim, K. L. , Laird, A. R. , & Dickstein, D. P. (2014). Developmental meta‐analyses of the functional neural correlates of bipolar disorder. JAMA Psychiatry, 71, 926–935. [DOI] [PMC free article] [PubMed] [Google Scholar]
- Xiao, Y. , Zhang, W. , Lui, S. , Yao, L. , & Gong, Q. (2013). Similar and different gray matter deficits in schizophrenia patients and their unaffected biological relatives. Frontiers in Psychiatry, 4, 150. [DOI] [PMC free article] [PubMed] [Google Scholar]
- Yeung, A. W. K. (2017). Do neuroscience journals accept replications? A survey of literature. Frontiers in Human Neuroscience, 11, 468. [DOI] [PMC free article] [PubMed] [Google Scholar]
- Zimmer, L. (2006). Qualitative meta‐synthesis: A question of dialoguing with texts. Journal of Advanced Nursing, 53, 311–318. [DOI] [PubMed] [Google Scholar]
- Zu Eulenburg, P. , Caspers, S. , Roski, C. , & Eickhoff, S. B. (2012). Meta‐analytical definition and functional connectivity of the human vestibular cortex. NeuroImage, 60, 162–169. [DOI] [PubMed] [Google Scholar]
Associated Data
This section collects any data citations, data availability statements, or supplementary materials included in this article.
Data Availability Statement
Data sharing is not applicable to this article as no new data were created or analyzed in this study.