

Abstract
Brain circuits mediate but also constrain experience‐induced plasticity and corresponding behavioral changes. Here we tested whether interindividual behavioral differences in learning a challenging new motor skill correlate with variations in brain anatomy. Young, healthy participants were scanned using structural magnetic resonance imaging (T1‐weighted MPRAGE, n = 75 and/or diffusion‐weighted MRI, n = 59) and practiced a complex whole‐body balancing task on a seesaw‐like platform. Using conjunction tests based on the nonparametric combination (NPC) methodology, we found that gray matter volume (GMV) in the right orbitrofrontal cortex was positively related to the subjects' initial level of proficiency and their ability to improve performance during practice. Similarly, we obtained a strong trend toward a positive correlation between baseline fractional anisotropy (FA) in commissural prefrontal fiber pathways and later motor learning. FA results were influenced more strongly by radial than axial diffusivity. However, we did not find unique anatomical correlates of initial performance and learning to rate. Our findings reveal structural predispositions for successful motor skill performance and acquisition in frontal brain structures and underlying frontal white matter tracts. Together with previous results, these findings support the view that structural constraints imposed by the brain determine subsequent behavioral success and underline the importance of structural brain network constitution before learning starts.
Keywords: balance, learning, MRI, predispositions, skill acquisition
1. INTRODUCTION
Practice is a fundamental variable to improve skilled motor performance in numerous settings, such as neurologic and orthopedic rehabilitation, music, or sports. However, individuals vary considerably in their ability to learn new motor skills. For novel tasks, large interindividual differences were found with respect to initial performance levels as well as learning rates (Ackerman & Cianciolo, 2000; Adams, 1987; Henry, 1956). In addition, remarkable between‐subject variability in terms of accumulated practice was found in athletes with similar levels of attainment (Duffy, Baluch, & Ericsson, 2004; Starkes, Deakin, Allard, Hodges, & Hayes, 1996). Given these differences in people's abilities to acquire motor skills, the prediction of future learning success is of great scientific and practical interest.
Why do people vary in their ability to learn new motor skills? In theory, this variability may arise from genetic (Fox, Hershberger, & Bouchard, 1996; McHughen et al., 2010) and environmental influences, such as adaptations to prior experiences resulting in a transfer effect to the new task (Seidler, 2004). Brain structure is shaped by the constant interplay of genetic and environmental factors throughout life, and thus appears to be a valid measure to predict interindividual differences in motor learning (Kanai & Rees, 2011). With respect to skilled motor performance, it was shown that experts and novices differ in terms of anatomical features of their brains in domains like music (Bengtsson et al., 2005) or sports (Huang, Lu, Song, & Wang, 2015). Furthermore, longitudinal studies demonstrated practice‐induced structural reorganization of gray (Draganski et al., 2004) and white matter (Scholz, Klein, Behrens, & Johansen‐Berg, 2009). These studies substantiate the assumption that the potential for future motor learning success might be reflected in certain structural properties of the human brain.
T1‐weighted (T1w) and diffusion‐weighted (DW) magnetic resonance imaging (MRI) have been used to characterize structural properties of the brain's gray and white matter, respectively (Kanai & Rees, 2011). Segmentation of T1w images enables one to estimate the biological plausible features of gray matter, such as cortical thickness, shape, or volume (Ashburner & Friston, 2000; Fischl & Dale, 2000). Furthermore, DW MRI‐derived measures reveal important information about the anatomical properties of white matter on a regional level (Basser & Pierpaoli, 1996; Beaulieu, 2014). Here, we relate gray matter volume (GMV) and tensor‐based measures (e.g., fractional anisotropy [FA]) with the potential for future motor learning success.
Previous studies have found that motor task performance is correlated with the initial properties of gray and white matter. Such associations were demonstrated for tasks requiring bimanual coordination (Johansen‐Berg, Della‐Maggiore, Behrens, Smith, & Paus, 2007), visuomotor adaptation (Della‐Maggiore, Scholz, Johansen‐Berg, & Paus, 2009), as well as grip or pinch force differentiation (Gryga et al., 2012; Tomassini et al., 2011). While these studies indicate that baseline brain structural measures relate to the future performance of artificial tasks with few degrees‐of‐freedom, there is a paucity of research investigating whether this also applies to more complex motor tasks. In fact, results obtained from studies using simple, laboratory‐based motor tasks are often not generalizable to complex motor skill learning (Wulf & Shea, 2002). This problem seems to be particularly problematic in terms of predispositions of learning. While studies using simple tasks generally conclude that interindividual performance differences converge with practice (Adams, 1987), the opposite might be true for complex tasks (Ackerman, 2007; de Winter, 2013).
One possible reason for this observation is that the coordinative complexity of simple motor tasks is low in terms of joints and muscles involved, degrees‐of‐freedom of joint motion, levels of force generated, or the extent of extrapersonal space traversed (Cordo & Gurfinkel, 2004). Because the problem of coordination is conceptualized as mastering the redundant degrees of freedom involved in a particular movement (Bernstein, 1967), complex tasks likely pose higher demands on central nervous mechanisms of motor control. To date, only one study has investigated whether baseline brain structural measures also relate to subsequent performance in a complex motor task (Sampaio‐Baptista et al., 2014). After obtaining a baseline brain scan, the participants of this study practiced juggling for a period of 6 weeks. Using voxel‐based morphometry (VBM), the authors found that GMV in occipital‐parietal areas before learning was predictive for the later learning rate. However, no correlation was found between learning rate and baseline FA, a measure reflecting the general integrity of white matter (Sampaio‐Baptista et al., 2014). The absence of such a correlation is surprising, because several studies investigating simpler motor tasks reported associations between FA and later performance (Della‐Maggiore et al., 2009; Johansen‐Berg et al., 2007; Tomassini et al., 2011). In addition, longitudinal studies on complex motor skill learning observed neuroplastic changes in the gray matter of distributed cortical areas as well as in fiber tracts connecting these regions (Scholz et al., 2009; Taubert et al., 2010). Though speculative, the absence of a baseline FA‐performance correlation in the study by Sampaio‐Baptista et al. (2014) might be due to sample size and/or the selectivity of the behavioral measure used (qualitative performance rating). We expect that the use of a larger sample along with an interval‐scaled performance measure potentially increase the statistical power to detect a relationship between baseline white matter microstructure and future performance.
In this study, we used a dynamic whole‐body balancing task ([DBT] Wulf, Höß, & Prinz, 1998) to address whether (a) baseline variations of gray and white matter correlate with early complex motor learning and (b) whether these brain–behavior correlations can be further differentiated depending on different performance indices of early motor learning. With respect to the latter point, recent functional neuroimaging results revealed that distinct brain networks are recruited during initial and later stages of skill learning (Floyer‐Lea & Matthews, 2005). Interestingly, they also show that the earliest stage of learning itself is paralleled by considerable dynamics with regard to behavioral progression and shifts of functional brain activation (Gheysen et al., 2017; Karni et al., 1998; Lefebvre, Dricot, Gradkowski, Laloux, & Vandermeeren, 2012; Toni, Krams, Turner, & Passingham, 1998). These findings motivate whether specific behavioral features of the earliest phase of motor learning are associated with specific anatomical features of the brain. Particularly, since the level of performance reached after a certain period of practice is determined by (a) the initial level of proficiency and (b) the rate of performance improvement occurring during practice, we tested which cortical regions and fiber tracts are related to these indices. Furthermore, we also asked whether there are gray and/or white matter regions which are more generally related to within‐session performance, for example, by influencing both initial performance and learning to rate. Based on the results of previous studies (Sampaio‐Baptista et al., 2014), we suppose a predictive value of the structural properties of those cortical regions and fiber tracts, which were also shown to be plastic in response to long‐term practice of the DBT (Taubert et al., 2010).
2. MATERIALS AND METHODS
To test whether baseline variations in gray and white matter are related to subsequent motor skill acquisition, a retrospective cross‐sectional study was conducted. In brief, all subjects were first scanned using T1w MPRAGE and/or a diffusion‐weighted MRI. After baseline scanning, subjects engaged in one DBT practice session. Performance indices of motor skill acquisition were calculated and subsequently associated with gray and white matter properties at baseline using regression models. In the present study, retrospective refers to the behavioral and/or MRI data that were partly used in previous publications (Kaminski et al., 2013; Taubert et al., 2010; Taubert, Mehnert, Pleger, & Villringer, 2016). Our study aimed at exploiting these data by pooling them together to increase statistical power (Button et al., 2013).
2.1. Participants
Regarding the inclusion of subjects in our study, we used a 4‐level decision tree. First, the inclusion of subjects was dependent on the presence of a complete and comparable behavioral data set of one training session of the DBT (see section 2.2). Second, all subjects under 18 or over 35 years of age were excluded from the study. This age range was chosen because it is considered to reflect a homogenous phase of human ontogeny in terms of cognitive (Li et al., 2004) and motor functions (Winter & Hartmann, 2007). Furthermore, the potential effects of development or aging on brain structure should theoretically be limited in early adulthood, because the properties of gray and white matter were shown to be relatively stable during the third decade of life (Mills et al., 2016). Subjects had a self‐reported physical activity level of <2 hr/week and did not engage in any balance‐specific or coordinative‐demanding sports (e.g., slacklining, gymnastics, surfing, and inline‐skating). Third, the internal MRI database of the Max Planck Institute for Human Cognitive and Brain Sciences (Leipzig) was searched for T1w and/or DW‐MRI scans (see sections below) of the respective subjects that were conducted in an interval of ≤2 years before the actual balance training session took place. With respect to the T1‐weighted data, we only included measurements that were conducted on the same 3 T MRI scanner (MAGNETOM Trio, Siemens Healthcare, Erlangen, Germany). To correct for potential effects of age and time difference between MRI measurement and training session, these factors were included as covariates of no interest in all statistical models of the MRI data, accompanied by rigorous control of family‐wise error (FWE) rates.
As a result, 75 subjects with a T1w (34 ♀, 41 ♂) and 59 subjects with a DW‐MRI data set (27 ♀, 32 ♂) met all inclusion criteria (Table 1). The study was carried out in accordance with the Declaration of Helsinki and approved by the Ethics Committee of the University of Leipzig. Subjects gave their written informed consent and underwent neurological examination as assessed by a credentialed physician prior to their participation. Only right‐handers that were naïve to the DBT before engaging in the study were included.
Table 1.
Descriptive statistics of the participants in the T1w and DW MRI data sets
| T1w data set (n = 75) | DW data set (n = 59) | |
|---|---|---|
| Age (y) | 25.77 (3.32) | 25.61 (3.31) |
| Body height (m) | 1.74 (0.08) | 1.74 (0.09) |
| Body weight (kg) | 68.80 (11.50) | 68.89 (11.43) |
| BMI (kg/cm2) | 22.68 (2.68) | 22.81 (2.84) |
| Handedness (Oldfield, 1971) | 90.03 (13.21) | 91.47 (13.02) |
| Δ MRI scan‐training session (d) | 355.13 (221.06) (n = 27) | 184.63 (169.25) (n = 32) |
Note: “Δ MRI scan—training session” is used as an abbreviation for the time difference between the respective MRI scans and training session. Δ MRI scan—training session data only refer to the 36% (T1w data set) and 54% (DW data set) of the subjects, whose MRI measurement was not conducted on the same day as their balance training session. All data are presented as mean and SD (in brackets).
2.2. Behavioral assessment
After baseline scanning, subjects engaged in one training session of DBT on a seesaw‐like platform (stability platform, model 16,030, Lafayette Instrument, Lafayette, IN), therefore allowing us to investigate the early phase of motor learning. The platform is moveable in the medio‐lateral direction with a maximum deviation of ±26° on either side.
The training session consisted of a total of 15 trials of DBT with an inter‐trial break of 90–120 s to avoid fatigue. Standing with both feet on the platform, subjects were instructed to keep the board in a horizontal position for as long as possible during a trial length of 30 s (Taubert et al., 2010). The behavioral outcome measure was the time (in seconds) in which subjects kept the platform in a horizontal target interval of ±3° on either side (time in balance). After each trial, subjects received verbal feedback the length of time they spent in the target interval (knowledge of results), while no feedback regarding strategy or other aspects of the task (knowledge of performance) was provided. During task execution, participants' attention was directed to a fixation cross fixed to the wall before them.
2.3. Statistical analyses of the behavioral data
The earliest stage of motor learning is characterized by a high dynamic of behavioral progress and functional activation of the brain. This highlights the need to use more than one performance measure to provide as complete a picture as possible of brain structure–behavior relationships during early learning. In accordance with the literature, we calculated behavioral indices for the subjects' initial level of proficiency, rate of improvement, as well as their best trial and level of proficiency after a defined period of practice (Adams, 1987; Fox et al., 1996), since all these measures could, in theory, be differentially influenced by structural brain properties (Della‐Maggiore et al., 2009; Sampaio‐Baptista et al., 2014). More specifically, the average of the first five trials of the training session was defined as “initial performance,” the average of the last 5 trials as within‐session “level of performance,” and the difference between “level of performance” and “initial performance” as “learning rate.” Based on the fact that that “level of performance” is the linear combination of “initial performance” and “learning rate” (see Figure 2), we only used the latter two indices to conduct voxel‐wise brain–behavior correlations (see sections 2.4 and 2.5). To operationalize relationships between baseline GMV/FA and general within‐session DBT performance, contrast vectors for “initial performance” and “learning rate” were combined nonparametrically (Pesarin & Salmaso, 2010; Winkler et al., 2016).
Figure 2.

Nonparametric combination voxel‐wise regression analysis with DBT performance as predictor of GMV. (a), Clusters depict regions, in which “initial performance” and “learning rate,” on aggregate, correlated positively with GMV. All clusters are displayed at pFWE <.05. Colorbar indicates FWE‐corrected p‐values. (b), Partial regression scatterplot with line of best fit shows the relation between standardized values of averaged within‐cluster GMV (y‐axis) and an aggregate score of DBT performance (x‐axis), corrected for the influence of age, sex, body height, Δ MRI scan–training session and head coil. The DBT aggregate measure was calculated as the mean of the standardized values of “initial performance” and “learning rate,” respectively. Note that the effect size (standardized β) and p‐value shown in the scatterplot were estimated post hoc and should therefore be interpreted with caution (Kriegeskorte, Lindquist, Nichols, Poldrack, & Vul, 2010) [Color figure can be viewed at http://wileyonlinelibrary.com]
Because we focused exclusively on the earliest phase of motor skill acquisition, where no plateau in performance was expected, we abstained from deriving a measure of “learning rate” based on fitting the behavioral data with a power or logarithmic function, as was done by others (Della‐Maggiore et al., 2009; Sampaio‐Baptista et al., 2014).
Before using these measures as predictors of local brain structure in general linear models (see below), we obtained information regarding potential interindividual differences on the behavioral level. We were especially interested in the correlations between initial and “level of performance” as well as between “initial performance” and “learning rate” (Adams, 1987). These analyses provide information about the maintenance of the relative standing of individuals within the sample (first correlation) and about the convergence (or divergence) of performance between subjects with practice (second correlation). Significant correlations between the behavioral indices, for example between “initial performance” and “learning rate,” can be expected based on the literature (Adams, 1987).
To ensure that learning has taken place during the practice period, one‐way repeated measures ANOVAs with the factor trial (15 factor levels) were calculated. IBM SPSS statistics version 22 (Armonk, NY) was used for these analyses.
2.4. Acquisition, processing, and analyses of T1w‐images
All anatomical images were acquired using a T1w three‐dimensional magnetization‐prepared rapid gradient echo sequence ([MP‐RAGE] Mugler & Brookeman, 1990) with 176 slices in sagittal orientation, a 1.0 × 1.0 × 1.0 mm3 isotropic spatial resolution, and a field of view of 256 × 240 mm2. Data were obtained either with a 12‐channel matrix coil (n = 19) or a 32‐channel array (n = 56). Due to the potential influence of the radiofrequency head coil on VBM results (Streitbürger et al., 2014), we corrected for this factor in the statistical models. In addition, echo times, repetition times, flip angles, and inversion times were allowed to vary between MRI measurements (for details see Table S1).
We ran two additional analyses to demonstrate that the aforementioned study‐specific modifications, especially regarding radiofrequency head coil, are acceptable with respect to the comparability of the data. First, we tested in the inferior orbitofrontal cortex, which was chosen based on the functional relevance of this region for the DBT (see results of the present study and Taubert et al., 2010), whether study protocol might influence the brain–behavior correlations. No substantial differences between statistical models containing “coil only” versus “protocol” as co‐regressors of no interest were observed (see Table S2). Furthermore, in the same region‐of‐interest, we tested whether the associations between averaged local GMV and behavioral measures of learning are consistent between the 32‐ch and 12‐ch data subsets. To do so, we used Chow's test (Chow, 1960) as implemented in the Genetic Analysis Package ([gap] Zhao, 2007) running in an R v. 3.5.1 environment (R Development Core Team, 2018), which tests the null hypothesis that two regression lines are equal (i.e., can be represented by one single regression line) and takes into account the slopes and the intercepts of the data sets. Note that, although the 12‐ch subset contains only 19 subjects, results from a recent simulation study suggest that two subjects per predictor variable are sufficient for an adequate estimation of regression coefficients and associated standard errors (Austin & Steyerberg, 2015). The absence of significant results of Chow's test (see Table S3) suggests that (a) the brain structure‐behavior regression lines from the 32‐ch and 12‐ch data subsets can be represented by one single regression line, and that (b) data pooling is therefore justified.
After a visual check for artifacts, data preprocessing was performed using the VBM8 toolbox (http://dbm.neuro.uni-jena.de/vbm/) incorporated in the SPM8 software package (Wellcome Trust Centre for Neuroimaging, UCL, London, UK; http://www.fil.ion.ucl.ac.uk/spm/) running in a Matlab 7 (Mathworks, Sherborn, MA) environment. We applied the default VBM8 preprocessing pipeline consisting of semi‐quantitative tissue segmentation (Ashburner & Friston, 2005), bias correction, and high dimensional normalization to MNI152 space using DARTEL (Ashburner, 2007). To compensate for the effect of spatial normalization, we multiplied the normalized gray matter segments with the Jacobian determinant of the deformation field (nonlinear only modulation), which corresponds to an adjustment for total intracranial volume (TIV). Nevertheless, we found no significant relationship between TIV and any DBT performance measure (Table S4). Finally, the resulting volumes were smoothed using a Gaussian kernel of 8 mm full width at half maximum.
Whole‐brain voxel‐wise statistical analyses on GM partial volumes were carried out using the Permutation Analysis of Linear Models v. alpha115 toolbox ([PALM] Winkler, Ridgway, Webster, Smith, & Nichols, 2014; Winkler et al., 2016) running in a Matlab R2017B environment. By using permutations that are performed synchronously across data sets, PALM allows correcting for multiplicity of tests with excellent control of false positives (Winkler et al., 2016). Furthermore, based on a modified nonparametric combination methodology ([NPC] Pesarin & Salmaso, 2010), PALM can collate the information from multiple independent partial statistical tests to produce a single measurement that summarizes evidence over multiple distinct modalities and/or contrasts (Winkler et al., 2016). Of note, PALM implicitly accounts for the dependencies between partial tests in scenarios, multiplicity control and combination of multiple statistical tests (Winkler et al., 2016).
Specifically, we used multiple regression models to identify clusters of voxels in which GMV was predicted by the DBT indices (“initial performance” and “learning rate,” respectively) independent of age (Mills et al., 2016), sex (Ruigrok et al., 2014), body height (Boisgontier et al., 2017), radiofrequency head coil (Streitbürger et al., 2014), and the difference between the MRI scan and balance training session (in days). To avoid partial volume effects near the border between gray and white matter, all voxels with a gray matter value below 0.2 were excluded. Based on previous cross‐sectional studies correlating GMV with motor learning (Gryga et al., 2012; Sampaio‐Baptista et al., 2014), we modeled positive relationships between GMV and DBT performance as hypothesis‐driven contrasts of interest. The resulting design matrices (one for initial performance and learning rate, respectively) and contrast vectors were then jointly fed into PALM along with the GM partial volume estimates. On the one hand, this statistical setup allows for the identification of specific structural correlates of initial performance and learning rate, respectively, with FWE‐correction of p‐values over multiple contrasts as enabled with the “‐corrcon” flag. On the other hand, it allows assessing shared structural correlates between “initial performance” and “learning rate” by aggregating the results of the partial tests using Fisher's (1932) combining function, as enabled with the “‐npccon” flag. For both univariate tests and their combination via NPC, Threshold‐free cluster enhancement ([TFCE] Smith & Nichols, 2009) was used to enhance cluster‐like structures in the images without the need to define clusters in a binary way. For each partial test, a total of 5,000 permutations of the data were generated to build up the empirical null distribution to test against. Note that this number is in the range of the recommended 1,000–10,000 permutations (Eklund, Nichols, & Knutsson, 2016; Nichols & Holmes, 2002). Cluster‐based FWE correction was applied to the statistical maps that emerged from the partial tests and their combination by using the distribution of the maximum statistic (Smith & Nichols, 2009; Winkler et al., 2014). Voxels were considered significant at p‐values of <.05, FWE‐corrected. Potentially meaningful statistical trends were assessed with a more liberal FWE‐threshold of p < .1.
Note that we used an additional PALM analysis to test for negative relationships between GMV and DBT performance. The settings were identical to those described above, except for using negative instead of positive contrast vectors. This analysis was exploratory and no significant negative correlations were expected based on the existing literature (Gryga et al., 2012; Sampaio‐Baptista et al., 2014). Altogether, we executed two PALM calls on the GMV data containing two t‐contrasts each.
2.5. Acquisition, processing, and analyses of diffusion‐weighted images
Whole‐brain diffusion‐weighted images were acquired using a twice‐refocused spin echo echo‐planar‐imaging sequence (Reese, Heid, Weisskoff, & Wedeen, 2003) on three different 3 T MRI scanners, each equipped with a 32‐channel phased‐array head coil. Among these were a MAGNETOM Trio scanner (Siemens Healthcare, Erlangen, Germany; n = 52) and two MAGNETOM Verio scanners (Siemens Healthcare, Erlangen, Germany; n = 4 and n = 3, respectively). Due to the high interscanner reliability of diffusion MRI (Grech‐Sollars et al., 2015; Pfefferbaum, Adalsteinsson, & Sullivan, 2003; Vollmar et al., 2010), we considered it appropriate to pool the data from three different MRI scanners.
Except for repetition time, all image acquisition parameters were identical between scans. This applies to echo time (100 ms), field of view (220 × 220 mm2), diffusion weighting (isotropically distributed along 60 diffusion‐encoding gradient directions with b = 1,000 s/mm2), number of axial slices (n = 88), and spatial resolution (1.72 × 1.72 × 1.7 mm3). In addition, seven data sets with no diffusion weighting (b = 0 s/mm2) were acquired initially and interleaved after each block of 10 diffusion‐weighted images as anatomical reference for off‐line motion correction.
After inspecting the data for artifacts, preprocessing was conducted using a pipeline based on the FMRIB Software Library ([FSL] Smith et al., 2004; https://fsl.fmrib.ox.ac.uk/fsl/fslwiki/FSL). The T1w structural images were used for skull‐stripping, and the brain images were then co‐registered to Talairach space (Talairach & Tournoux, 1988). The seven images without diffusion weighting distributed in the whole sequence were used to estimate motion correction parameters using rigid‐body transformations (Jenkinson, Bannister, Brady, & Smith, 2002). Motion correction parameters were interpolated for all 67 volumes and combined with a global registration to the T1 anatomy computed using the same method. The gradient direction for each volume was corrected using the rotation parameters. The registered images were interpolated to the new reference frame with an isotropic voxel resolution of 1.72 mm/1 mm, and the three corresponding acquisitions and gradient directions were averaged. Finally, for each voxel a diffusion tensor (Basser & Pierpaoli, 1996) was fitted to the data to calculate the diffusion parameters fractional anisotropy (FA), mean diffusivity (MD), as well as axial (λ∥) and radial diffusivity (λ⊥).
For subsequent voxel‐wise statistical analyses, Tract‐Based Spatial Statistics ([TBSS] Smith et al., 2006) was used. First, each subject's FA map was aligned to every other one to identify the most representative subject of the sample (target). All FA images were then normalized into a common brain space and a group‐average FA image was computed. The group‐average FA image was then thinned and binarized with an FA‐value of >0.25 (Burzynska et al., 2010; Melzer et al., 2013). This results in a skeleton only representing each subject's major fiber tracts while avoiding partial volume effects or the inclusion of varying fiber tracts between subjects. Subsequently, the FA values of each subject were back‐projected onto this skeleton. Next, the same warps were applied to the other diffusion parameters (MD, λ∥, λ⊥).
We used PALM v. alpha115 (Winkler et al., 2014; Winkler et al., 2016) running in a Matlab R2017B environment to conduct voxel‐wise statistical analyses on skeletonized FA maps. PALM settings were mostly the same as described above (see section 2.4). Regression models were used containing DBT performance measures (“initial performance” and “learning rate,” respectively) as predictors of FA, corrected for the influence of age, sex, body height, and the difference between the MRI scan and balance training session. In addition, we accounted for the potential effect of the scanner's software version (syngo B15: n = 36; syngo B17: n = 23) by modeling it as a dichotomous covariate. Positive relationships between FA and performance (Della‐Maggiore et al., 2009; Johansen‐Berg et al., 2007; Tomassini et al., 2011) were modeled as hypothesis‐driven contrasts of interest. Again, we analyzed specific white matter correlates of “initial performance” and “learning rate” (corrected for multiple comparisons) via the “‐corrcon” flag. Furthermore, the results from these partial tests were combined via Fisher's (1932) function to identify shared structural correlates between “initial performance” and “learning rate” (“‐npccon” flag). We used optimized TFCE‐parameters for TBSS data (Smith & Nichols, 2009) and conducted 5,000 random permutations to build up the empirical null distribution to test against (Winkler et al., 2014). Voxels were considered significant at p‐values of <.05, FWE‐corrected. Potentially meaningful statistical trends were assessed with a more liberal FWE‐threshold of p < .1.
As with VBM analysis (section 2.4), we also ran an exploratory PALM model containing negative relationships between FA and the DBT performance indices. Again, no significant negative correlations were expected based on the existing literature (Della‐Maggiore et al., 2009; Johansen‐Berg et al., 2007; Tomassini et al., 2011). Altogether, we executed two PALM calls on the FA data containing two t‐contrasts each.
While FA reflects white matter microstructure, inference of specific tissue properties like axonal integrity, myelination, axonal diameter, fiber orientation, or density is challenging (Beaulieu, 2014). In this respect, animal research suggests that λ∥ and λ⊥ might provide a more neurobiologically grounded insight. Specifically, it was proposed that λ⊥ might be a sensitive parameter for myelination, whereas λ∥ is considered to be a more specific measure for axonal properties (Song et al., 2002; Song et al., 2005). Because different tensor eigenvalue combinations can lead to the same values of FA (Alexander, Lee, Lazar, & Field, 2007), λ∥ and λ⊥ can be used to aid the understanding of biophysical properties underlying FA. Please note that this procedure is not circular inference, since we were only interested in exploring potential driving forces behind FA in clusters of significant FA‐performance correlations.
In the event of significant FA clusters resulting from the voxel‐wise analyses, we extracted and averaged within‐cluster values of FA, λ∥ and λ⊥ within a binary mask (Steele, Scholz, Douaud, Johansen‐Berg, & Penhune, 2012). Averaged λ∥ and λ⊥ values were then used as independent variables (IV) to predict the respective averaged FA values by means of multiple regression to obtain unstandardized and standardized regression coefficients. Besides this “classical” approach using the forced‐entry method, we used a technique based on all possible subsets regression (“regression commonality analysis”; Kerlinger & Pedhazur, 1973; Nimon & Oswald, 2013) to partition the regression effect into commonality coefficients representing unique and shared variance of λ∥ and λ⊥ with regard to FA. Note that the commonality coefficients of unique and common effects sum up to the multiple R 2 of the model (Nimon & Oswald, 2013). Regression analyses were conducted using the yhat package (Nimon & Oswald, 2013) running in an R v. 3.5.1 environment (R Development Core Team, 2018). Empirical sampling distributions of the regression and commonality test statistics are based on drawing 1,000 bootstrap samples. For interpretation, 95% bias‐corrected and accelerated confidence intervals (95% BCa CI) were used.
2.6. Probabilistic diffusion tractography
To aid the anatomical localization of results from the TBSS analyses, probabilistic diffusion tractography (PDT) was used to characterize the directions of fiber tracts running through a cluster and thereby to identify the parts of the brain to which a cluster likely projects to. Furthermore, PDT served for illustrative purposes, showing how significant TBSS results relate to major fiber tracts. To conduct PDT, we used the BEDPOSTx and PROBTRACKx tools as implemented in FSL (Behrens et al., 2003; Behrens, Berg, Jbabdi, Rushworth, & Woolrich, 2007).
First, a probability distribution function on fiber direction at each voxel was estimated with BEDPOSTx. After this, a 2‐fiber model was fitted to the diffusion data at each voxel (Behrens et al., 2003). Significant clusters of the DTI analyses were binarized, transformed into each subject's native diffusion space, and used as seed masks for the fiber tracking. Twenty‐five thousand streamlines were randomly seeded from all voxels within the respective masks (Boorman, O'Shea, Sebastian, Rushworth, & Johansen‐Berg, 2007; Song, Sharma, Buch, & Cohen, 2012). The output of this step is an image of each subject in MNI152 space in which all brain voxels have a value representing the connectivity between that voxel and the seed mask (i.e., the number of streamlines passing through that particular voxel). To avoid spurious connections, individual images were thresholded at 1/25 of the total seeded streamlines (Song et al., 2012). In the last step, the individual images were binarized, summed across subjects (Boorman et al., 2007), and thresholded to display only paths that were present in a minimum of one‐third of the subjects (Song et al., 2012). In the resulting group probability maps, each voxel value represents the number of subjects for whom the pathway passes through that voxel (Boorman et al., 2007).
3. RESULTS
3.1. Behavioral results
Table 2 shows descriptive statistics of the performance parameters, which were calculated from one DBT training session.
Table 2.
Descriptive statistics of the behavioral performance indices for the subjects in the T1‐weighted and DW data sets
| T1w data set (n = 75) | DW data set (n = 59) | |
|---|---|---|
| Initial performance (s) | 5.96 (2.36) | 6.02 (2.12) |
| Level of performance (s) | 10.54 (4.38) | 10.56 (4.15) |
| Learning rate (s) | 4.58 (3.04) | 4.54 (2.95) |
Note: Data presented as mean and SD (in brackets).
One‐way repeated measures ANOVAs revealed significant effects of trial in the T1w data set, F(5.85, 432.89) = 59.12, p < .001, η 2 p = 0.444 as well as in the DW data set, F(5.76, 334.32) = 46.53, p < .001, η 2 p = 0.445, thus confirming that performance improved improvements during the practice period.
As expected, “initial performance” was highly correlated with “level of performance” in the T1w data set, r = 0.75, p < .001 (Figure 1a), and in the DW‐data set, r = 0.74, p < .001 (Figure 1c). Surprisingly, “initial performance” showed a positive relationship also with “learning rate” in both the T1w data set, r = 0.31, p = .007 (Figure 1b) and in the DW data set, r = 0.33, p = .01 (Figure 1d). Not least, a significant positive relationship was also found between “learning rate” and “level of performance” (T1w data set: r = 0.86, p < .001, DW data set: r = 0.88, p < .001).
Figure 1.

Relationship between selected behavioral performance indices (Pearson correlation plots with 95% CI of the mean in dashed lines). (a–d) A positive correlation between “initial performance” and “level of performance” as well as between “initial performance” and “learning rate” was found in both the T1w (a and b) and DW data sets (c and d)
3.2. VBM results
With respect to the NPC of the univariate tests modeling positive relationships between baseline GMV and “initial performance”/“learning rate,” we found a significant cluster in the right inferior frontal gyrus (cluster extent [k] = 493, FWE‐corrected p‐value [pFWE] = .025, peak‐voxel MNI coordinates [MNI]: x = 42, y = 42, z = −14; Figure 2). Regarding specific structural correlates of “initial performance” and “learning rate,” however, the PALM VBM analysis yielded no significant correlations (all FWE‐corrected p's > .1, corrected for multiplicity across space and contrasts).
As expected, there were also no negative relationships between GMV and the DBT performance variables as assessed with the exploratory PALM analysis (all FWE‐corrected p's > .1).
3.3. TBSS results
Regarding the white matter correlates of early motor learning, all results failed to reach the nominal alpha level of .05. However, we obtained potentially meaningful statistical trends.
In this effect, the NPC yielded three clusters significant at an FWE‐corrected trend level of p < .06 (cluster 1: k = 95, pFWE = .052, MNI: x = 18, y = 35, z = 27; cluster 2: k = 34, pFWE = .058, MNI: x = 21, y = 47, z = 4; cluster 3: k = 4, pFWE = .059, MNI: x = 18, y = 34, z = 19; Figure 3a,b). As revealed by probabilistic tractography, the streamlines of these clusters radiate forward from the genu to the frontal lobe (Figure 3c), and the clusters are thus likely to be situated in the forceps minor. In order to explore the potential driving forces behind FA in clusters of FA–performance correlations, the respective within‐cluster values of λ∥, λ⊥, and FA were further analyzed with multiple regression models. Our analyses showed that λ⊥ contributes significantly more variance to FA in these clusters than λ∥ (Table 3).
Figure 3.
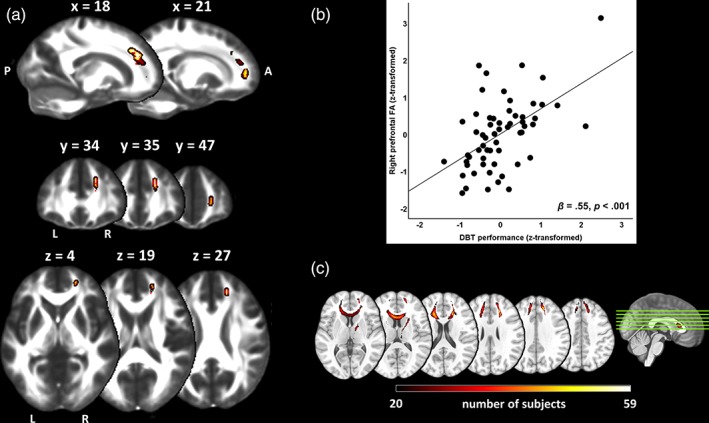
Nonparametric combination voxel‐wise regression analysis with DBT performance as predictor of FA. (a), Clusters depict regions, in which “initial performance” and “learning rate,” on aggregate, correlated positively with FA. All clusters are displayed at an FWE‐corrected trend level of p < .06 and fattened with the “tbss_fill” script for improved visibility. (b), Partial regression scatterplot with line of best fit shows the relation between standardized values of averaged within‐cluster FA (y‐axis) and an aggregate score of DBT performance (x‐axis), corrected for the influence of age, sex, body height, Δ MRI scan–training session and software version of the MR scanner. The DBT aggregate measure was calculated as the mean of the standardized values of “initial performance” and “learning rate,” respectively. Note that the effect size (standardized β) and p‐value shown in the scatterplot were estimated post hoc and should therefore be interpreted with caution (Kriegeskorte et al., 2010). (c), Tendentially significant clusters (pFWE <.06) obtained from TBSS statistical analyses used as seed masks for PDT. Red‐yellow voxel intensities represent the number of subjects in whom the streamline passed through a given voxel. For visualization, group probability maps were thresholded to display only the paths that were present in a range of at least one third (n = 20, reddish coloring) to a maximum of 100% (n = 59, bright yellow) of the subjects [Color figure can be viewed at http://wileyonlinelibrary.com]
Table 3.
Multiple regression models with λ∥ and λ⊥ as predictors of within‐cluster FA (adjusted multiple R 2 = 0.97, p < .001)
| b (95% BCa CI) | SE B | β (95% BCa CI) | p | Common (95% BCa CI) | Unique (95% BCa CI) | Unique_diff (95% BCa CI) | |
|---|---|---|---|---|---|---|---|
| λ ∥ |
281.15 (253.14,307.70) |
14.70 |
.47 (0.40, 0.56) |
p < .001 |
0.51 (0.28, 0.68) |
0.16 (0.09, 0.27) |
−0.14 (−0.25, −0.04)* |
| λ ⊥ |
−829.15 (−885.11,‐783.25) |
31.46 |
−.65 (−0.72, −0.59) |
p < .001 |
0.30 (0.20, 0.44) |
Note: Ninety‐five percent bias‐corrected and accelerated bootstrap confidence intervals (95% BCa CI) were based on 1,000 bootstrap samples. The columns of “common” and “unique” effects represent commonality coefficients, which sum up to the multiple R 2 of the model.
Abbreviations: b, unstandardized regression coefficient; SE B, SE of the unstandardized regression coefficient; β, standardized regression coefficient, which refers to the change (in SD units) in the dependent variable (FA) attributable to a 1 SD change in the respective predictor (λ⊥ or λ∥); Common, shared effect of λ⊥ and λ∥ on explained FA variance; Unique, unique effects of λ⊥ and λ∥ on explained FA variance; Unique_diff, between‐predictor comparison of unique effects.
As for the TBSS‐NPC results, the univariate analyses showed no significant correlations between baseline FA and DBT performance indices at the pFWE < .05 level. However, we obtained a statistical trend for an FA‐“learning rate” correlation at the p < .1 level in the forceps minor (k = 95, pFWE = 0.093, MNI: x = 18, y = 35, z = 28, corrected for multiplicity across space and contrasts).
As expected, we found no negative relationships between FA and DBT performance variables as assessed with the exploratory PALM analysis (all FWE‐corrected p's > .1).
4. DISCUSSION
MRI parameters of brain anatomy relate to interindividual behavioral differences in a multitude of domains (Gabrieli, Ghosh, & Whitfield‐Gabrieli, 2015; Kanai & Rees, 2011; Zatorre, 2013). However, we lack evidence of brain structure–behavior relationships in complex and challenging behavioral settings, especially in white matter. Our study provides evidence that interindividual differences in learning a new complex motor task (dynamic balancing task, DBT) are linked to anatomical features of the brain. The most remarkable result to emerge from the data is that orbitofrontal gray matter, which is known to undergo structural plasticity in response to learning the DBT (Taubert et al., 2010), is also an important predictor of DBT performance. Similarly, we found that the white matter beneath the right prefrontal cortex also tends to predict subsequent DBT performance (0.05 < pFWE < .06). Unexpectedly, we found no evidence that initial performance and the rate of performance improvement were affected by distinct brain structural properties. Based on these data, we propose that higher initial GMV and FA in task‐relevant brain areas equip the learner with an improved capacity for reactive change to adapt to new environmental stimuli, such as complex motor skill acquisition.
4.1. Behavioral data highlight the impact of predispositions in the earliest stage of learning
If predispositions only played a marginal role in motor learning, one would expect a limited predictive value of “initial performance” with respect to “level of performance.” In addition, one would assume that existing interindividual behavioral differences in the earliest stage of training would tend to converge with practice. The finding that “initial performance” and “level of performance” are highly correlated suggests that individual predispositions dominated the earliest stage of motor learning in our balancing task. This is in line with previous research showing that subjects tend to maintain their relative standing with practice (Adams, 1987). Contradictory to most of the literature on motor skills (Adams, 1987; Henry, 1956; Kincaid, 1925), we also found a significant positive correlation between “initial performance” and “learning rate.” This implies that, at least in the earliest stage of learning the DBT, individual performance differences diverge with practice. A possible explanation for this finding is that studies reporting a negative relationship between “initial performance” and “learning rate” often used simple skills acquired over dozens or even hundreds of trials, thus typically resulting in a performance plateau (Adams, 1987; Kincaid, 1925). Here, we focused exclusively on the earliest stage of motor skill acquisition, such that a negative correlation could eventually have appeared after the occurrence of further performance improvements. Alternatively, it is reasonable to assume that for complex tasks individual differences actually diverge with task experience, as was shown for example for vocabulary test performance (Ackerman, 2007; de Winter, 2013).
Nevertheless, our results support the notion that predisposition plays an important role in early motor skill acquisition. Consequently, the question arose whether the observed variability in behavior is also be paralleled by interindividual differences in brain structure.
4.2. Gray and white matter properties of right prefrontal areas correlate with skill acquisition
The results of the present study are consistent with previous evidence indicating an important role of prefrontal brain areas in the early phase of complex motor skill acquisition (Lohse, Wadden, Boyd, & Hodges, 2014; Seidler, 2010). Special functions attributed to the prefrontal cortex (PFC) include, but are not limited to, multimodal information processing, error detection and correction, attention, and strategic aspects of motor learning (Fuster & Bressler, 2015; Seidler, 2010; Tsujimoto, Genovesio, & Wise, 2011). Here we found that right orbitofrontal GMV exerts a global influence on learning success of the DBT by jointly affecting both initial performance and rate of performance improvement. Furthermore, a similar trend was found for FA in commissural fibers connecting the hemispheres of the prefrontal cortex, failing by a small margin to reach significance. Taken together, these results suggest that right prefrontal brain areas constitute an important node in the structural network of the brain which influences DBT performance from the very first trials on, and retains this role at least during the entire training session.
These results lend support to earlier studies suggesting a substantial role of the PFC with respect to learning the DBT. Using transcranial direct current stimulation (tDCS), Kaminski et al. (2013) observed that concomitant anodal stimulation of the supplementary motor area (SMA) and cathodal stimulation of the PFC impaired DBT learning. The authors discussed this finding in light of an inhibition of higher cognitive processes relevant for the early stage of skill acquisition (Kaminski et al., 2013). Importantly, the cathode in Kaminski et al.'s (2013) study was placed over the right PFC and thus covered the frontal cortical part, which showed a brain–behavior relationship in the present study.
Likewise, there is evidence of functional relevant plasticity in prefrontal gray and white matter areas when practicing the DBT. Specifically, it was found that performance improvements in the DBT over a period of 6 weeks were linked to gray matter expansion in the left orbitofrontal cortex (Taubert et al., 2010). Therefore, one might well speculate that the correlation between prefrontal GMV and DBT performance during one training session as observed in the present study could eventually have persisted in the future. Interestingly, the orbitofrontal cluster in the Taubert et al. (2010) study was located in an approximately mirror‐inverted fashion compared to the findings of the present investigation. This suggests that the role of the PFC with respect to DBT performance is not limited to one hemisphere. Taken together, it might be advantageous to have a higher initial GMV in cortical regions showing practice‐induced neuroplastic changes. This assumption is well in line with earlier studies on juggling, where it was shown that GMV in occipital‐parietal areas increases after several weeks of practice (Scholz et al., 2009), and that a higher initial GMV in the same regions predicted a higher subsequent learning rate of juggling (Sampaio‐Baptista et al., 2014).
The important role of prefrontal areas in early motor learning is further substantiated by the close‐to‐significant (pFWE < .06) correlation between FA in the right forceps minor and subsequent motor skill performance. In previous studies investigating white matter properties as a predictor of future learning success, structure–performance associations were exclusively found for simple, but not for complex, motor tasks (Della‐Maggiore et al., 2009; Johansen‐Berg et al., 2007; Tomassini et al., 2011). Because FA has shown to be associated with functional brain connectivity (van den Heuvel, Mandl, Kahn, & Hulshoff Pol, 2009), one could speculate that the functional meaning of high prefrontal FA values is to support the well‐known shifts of functional brain activation occurring during the earliest stage of motor learning (Gheysen et al., 2017; Karni et al., 1998; Lefebvre et al., 2012; Toni et al., 1998).
Given the complexity of the diffusion index FA (Alexander et al., 2007), we were interested in which biophysical tissue features might underlie FA in clusters where significant FA–performance relationships were obtained. As done by others, we analyzed the diffusion indices λ∥ and λ⊥ to inform the interpretation of the FA findings (Steele et al., 2012). We found that the unique variance attributable to λ⊥ contributed to a higher degree to FA than the unique variance attributable to λ∥. This suggests that the observed relationship between FA and performance indices was driven more strongly by general tissue integrity and myelination than axonal properties (Harsan et al., 2006; Klawiter et al., 2011; Song et al., 2002; Song et al., 2005). Accepting the notion that λ⊥ provides at least some information regarding myelination, one could speculate that the functional relevance of a lower λ⊥ is to contribute to a higher speed and/or better timing of information processing in task‐relevant brain areas (Fields, 2015). This interpretation seems also plausible against the background of recent animal studies, which showed that myelin plasticity (McKenzie et al., 2014; Sampaio‐Baptista et al., 2013) as well as oligodendrogenesis (Xiao et al., 2016) are linked to skilled motor practice.
4.3. Limitations
A number of potential limitations need to be considered. First, there are some limitations due to the research methodology. The T1w images were obtained with different head coils, echo times, repetition times, flip angles, and inversion times. However, we found no evidence whatsoever that these study‐specific modifications had any influence on the results (see section 2.4 and Tables S2 and S3). Furthermore, it should be kept in mind that 36% (T1w data set) and 54% (DW data set) of MRI measurements were not conducted on the same day as the DBT practice session. Therefore, the time interval between MRI measurement and DBT practice session was included as covariate in all statistical models of the present article. Note, however, that evidence from the field of developmental neuroscience suggests that gray and white matter properties are relatively stable during the third decade of life (Mills et al., 2016). With respect to the FA‐results emerging from the whole‐brain analysis with PALM, it has to be considered that the correlation approximated but did not reach the nominal alpha significance criterion (pFWE < .06) such that the results need to be interpreted with caution. Nevertheless, since the effect size of the correlation is medium (see scatterplot in Figure 3b), the relationship between prefrontal FA and DBT performance is likely nontrivial and practically meaningful. Therefore, it may be assumed that our study was slightly underpowered to find the sample correlation to be significant (Cohen, 1990). It should be noted, however, that the sample size of the present study (n = 59) was larger compared with other cross‐sectional studies examining relationships between white matter microstructure and motor learning, which recruited between 10 and 44 participants (Della‐Maggiore et al., 2009; Johansen‐Berg et al., 2007; Sampaio‐Baptista et al., 2014; Tomassini et al., 2011).
Second, a correlative study design such as ours does not allow for conclusions about causal relationships between brain structural properties and skill acquisition performance. However, in combination with the results obtained in earlier studies, there are hints that corroborate the notion of a functional relevant structure–performance relationship, at least in the prefrontal cortex (Kaminski et al., 2013; Taubert et al., 2010).
Third, regarding our analyses of the relative contributions of λ⊥ and λ∥ to FA, we are well aware that utmost caution must be exercised when interpreting these eigenvalue‐based measures in the human brain (Wheeler‐Kingshott & Cercignani, 2009). Note, however, that the corpus callosum is a dense and compact white matter structure with directional coherent fiber organization, resulting in relatively anisotropic water diffusion as compared to other brain regions (Hasan, Gupta, Santos, Wolinsky, & Narayana, 2005). Combining this fact with the histological evidence showing convincing relationships between λ⊥ and myelin plasticity as well as between myelin plasticity and skilled motor performance (see section 4.2), we think that our interpretation of mechanisms behind the FA–performance correlations is sound.
Fourth, our findings might not be transferable to other motor tasks. The fact that more than one single area was consistently found to predict the success of future motor skill acquisition in the existing literature (Della‐Maggiore et al., 2009; Gryga et al., 2012; Johansen‐Berg et al., 2007; Sampaio‐Baptista et al., 2014; Tomassini et al., 2011) substantiates the assumption that structural predispositions are highly task‐specific. Prior research in the field of juggling points in the same direction (Sampaio‐Baptista et al., 2014; Scholz et al., 2009). Nonetheless, recent reviews and meta‐analyses of task‐based fMRI studies indicate that prefrontal, parietal, and premotor areas are involved in motor skill acquisition in a task‐independent fashion (Halsband & Lange, 2006; Hardwick et al., 2013; Lohse et al., 2014). At present, the transfer of brain imaging findings from our study to other complex motor tasks remains unclear.
Fifth, we show brain–behavior relationships for properties of both gray and white matter. This inevitably leads to whether motor learning ability is an innate or acquired feature and whether it can be influenced. Of course, these questions are beyond the scope of the present work. However, given the interaction and correlation between genes and environment (Plomin, DeFries, & Loehlin, 1977), it is almost impossible to unravel how genetic and environmental factors contribute to differences in brain structure and performance (Gu & Kanai, 2014; Toga & Thompson, 2005). Despite the fact that brain structure is considered to be heritable to a large extent (Jansen, Mous, White, Posthuma, & Polderman, 2015), the human brain is far more plastic than that of other primates (Gómez‐Robles, Hopkins, Schapiro, & Sherwood, 2015). Not only does this imply that the remarkable neuroplastic properties allow everyone to improve with practice (Draganski et al., 2004; Scholz et al., 2009), but also that brain structure is a predisposition of future motor skill acquisition and can be influenced by appropriate interventions. For example, a recent review estimated that 82% of the brain's gray matter is modifiable by physical activities such as motor learning, endurance exercise, and other means (Batouli & Saba, 2017). Therefore, it seems unlikely that initial brain structure imposes general limits to the attainment potential of individuals to learn certain skills. Nonetheless, the predictive value of initial brain structure for future performance might also apply to learning processes of considerably longer time scales than just one training session (Sampaio‐Baptista et al., 2014).
4.4. Conclusions
This paper has investigated the role of gray and white matter properties of the brain for subsequent learning of a complex motor skill. The evidence from our study suggests that structural constraints imposed by the brain determine subsequent success when learning a new complex motor skill and underline the importance of structural brain network constitution before learning starts. Strikingly, prefrontal gray matter, which is known to undergo structural plasticity in response to complex balance learning (Taubert et al., 2010), is also an important predictor of future DBT performance. Furthermore, as far as we are aware, this is the first study to provide suggestive evidence that prefrontal white matter variations are also related to subsequent complex motor skill learning, potentially driven by myelin properties. Our results do not appear to support the idea that specific behavioral features of the earliest phase of motor learning are related to specific anatomical features of the brain. Rather, they suggest that gray and white matter properties exert a complex influence on subsequent motor learning by affecting both initial performance and the rate of performance improvement.
CONFLICT OF INTEREST
The authors declare that this research was conducted in the absence of any commercial or financial relationships that could be construed as a potential conflict of interest.
Supporting information
Appendix S1: Supporting Information.
ACKNOWLEDGMENTS
This work was supported by the Federal Institute of Sport Science (IIA1‐070613/12‐13 and ZMVI1‐070610/14‐16). Funders had no role in study design, data collection and analysis, decision to publish, or preparation of the article.
Lehmann N, Tolentino‐Castro JW, Kaminski E, Ragert P, Villringer A, Taubert M. Interindividual differences in gray and white matter properties are associated with early complex motor skill acquisition. Hum Brain Mapp. 2019;40:4316–4330. 10.1002/hbm.24704
Funding information Federal Institute of Sport Science, Grant/Award Numbers: IIA1‐070613/12‐13, ZMVI1‐070610/14‐16
REFERENCES
- Ackerman, P. L. (2007). New developments in understanding skilled performance. Current Directions in Psychological Science, 16, 235–239. 10.1111/j.1467-8721.2007.00511.x [DOI] [PMC free article] [PubMed] [Google Scholar]
- Ackerman, P. L. , & Cianciolo, A. T. (2000). Cognitive, perceptual‐speed, and psychomotor determinants of individual differences during skill acquisition. Journal of Experimental Psychology: Applied, 6, 259–290. 10.1037/1076-898X.6.4.259 [DOI] [PubMed] [Google Scholar]
- Adams, J. A. (1987). Historical review and appraisal of research on the learning, retention, and transfer of human motor skills. Psychological Bulletin, 101, 41–74. 10.1037/0033-2909.101.1.41 [DOI] [Google Scholar]
- Alexander, A. L. , Lee, J. E. , Lazar, M. , & Field, A. S. (2007). Diffusion tensor imaging of the brain. Neurotherapeutics, 4, 316–329. 10.1016/j.nurt.2007.05.011 [DOI] [PMC free article] [PubMed] [Google Scholar]
- Ashburner, J. (2007). A fast diffeomorphic image registration algorithm. NeuroImage, 38, 95–113. 10.1016/j.neuroimage.2007.07.007 [DOI] [PubMed] [Google Scholar]
- Ashburner, J. , & Friston, K. J. (2000). Voxel‐based morphometry—The methods. NeuroImage, 11(6 Pt 1), 805–821. 10.1006/nimg.2000.0582 [DOI] [PubMed] [Google Scholar]
- Ashburner, J. , & Friston, K. J. (2005). Unified segmentation. NeuroImage, 26, 839–851. 10.1016/j.neuroimage.2005.02.018 [DOI] [PubMed] [Google Scholar]
- Austin, P. C. , & Steyerberg, E. W. (2015). The number of subjects per variable required in linear regression analyses. Journal of Clinical Epidemiology, 68, 627–636. 10.1016/j.jclinepi.2014.12.014 [DOI] [PubMed] [Google Scholar]
- Basser, P. J. , & Pierpaoli, C. (1996). Microstructural and physiological features of tissues elucidated by quantitative‐diffusion‐tensor MRI. Journal of Magnetic Resonance, Series B, 111, 209–219. 10.1006/jmrb.1996.0086 [DOI] [PubMed] [Google Scholar]
- Batouli, S. A. H. , & Saba, V. (2017). At least eighty percent of brain grey matter is modifiable by physical activity: A review study. Behavioural Brain Research, 332, 204–217. 10.1016/j.bbr.2017.06.002 [DOI] [PubMed] [Google Scholar]
- Beaulieu, C. (2014). The biological basis of diffusion anisotropy In Johansen‐Berg H. & Behrens T. E. J. (Eds.), Diffusion MRI: From quantitative measurement to in‐vivo neuroanatomy (2nd ed., pp. 155–183). Amsterdam: Elsevier: Academic Press. [Google Scholar]
- Behrens, T. E. J. , Berg, H. J. , Jbabdi, S. , Rushworth, M. F. S. , & Woolrich, M. W. (2007). Probabilistic diffusion tractography with multiple fibre orientations: What can we gain? NeuroImage, 34, 144–155. 10.1016/j.neuroimage.2006.09.018 [DOI] [PMC free article] [PubMed] [Google Scholar]
- Behrens, T. E. J. , Woolrich, M. W. , Jenkinson, M. , Johansen‐Berg, H. , Nunes, R. G. , Clare, S. , … Smith, S. M. (2003). Characterization and propagation of uncertainty in diffusion‐weighted MR imaging. Magnetic Resonance in Medicine, 50, 1077–1088. 10.1002/mrm.10609 [DOI] [PubMed] [Google Scholar]
- Bengtsson, S. L. , Nagy, Z. , Skare, S. , Forsman, L. , Forssberg, H. , & Ullén, F. (2005). Extensive piano practicing has regionally specific effects on white matter development. Nature Neuroscience, 8, 1148–1150. 10.1038/nn1516 [DOI] [PubMed] [Google Scholar]
- Bernstein, N. A. (1967). The co‐ordination and regulation of movements. Oxford: Pergamon Press. [Google Scholar]
- Boisgontier, M. P. , Cheval, B. , Chalavi, S. , van Ruitenbeek, P. , Leunissen, I. , Levin, O. , … Swinnen, S. P. (2017). Individual differences in brainstem and basal ganglia structure predict postural control and balance loss in young and older adults. Neurobiology of Aging, 50, 47–59. 10.1016/j.neurobiolaging.2016.10.024 [DOI] [PubMed] [Google Scholar]
- Boorman, E. D. , O'Shea, J. , Sebastian, C. , Rushworth, M. F. S. , & Johansen‐Berg, H. (2007). Individual differences in white‐matter microstructure reflect variation in functional connectivity during choice. Current Biology, 17, 1426–1431. 10.1016/j.cub.2007.07.040 [DOI] [PubMed] [Google Scholar]
- Burzynska, A. Z. , Preuschhof, C. , Bäckman, L. , Nyberg, L. , Li, S.‐C. , Lindenberger, U. , & Heekeren, H. R. (2010). Age‐related differences in white matter microstructure: Region‐specific patterns of diffusivity. NeuroImage, 49, 2104–2112. 10.1016/j.neuroimage.2009.09.041 [DOI] [PubMed] [Google Scholar]
- Button, K. S. , Ioannidis, J. P. A. , Mokrysz, C. , Nosek, B. A. , Flint, J. , Robinson, E. S. J. , & Munafò, M. R. (2013). Power failure: Why small sample size undermines the reliability of neuroscience. Nature Reviews Neuroscience, 14, 365–376. 10.1038/nrn3475 [DOI] [PubMed] [Google Scholar]
- Chow, G. C. (1960). Tests of equality between sets of coefficients in two linear regressions. Econometrica, 28, 591–605. 10.2307/1910133 [DOI] [Google Scholar]
- Cohen, J. (1990). Things I have learned (so far). American Psychologist, 45, 1304–1312. 10.1037/0003-066X.45.12.1304 [DOI] [Google Scholar]
- Cordo, P. J. , & Gurfinkel, V. S. (2004). Motor coordination can be fully understood only by studying complex movements In Mori S. & Pierce P. A. (Eds.), Progress in brain research: Vol. 143. Brain mechanisms for the integration of posture and movement (Vol. 143, pp. 29–38). Amsterdam: Elsevier; 10.1016/S0079-6123(03)43003-3 [DOI] [PubMed] [Google Scholar]
- De Winter, J. C. F. (2013). Why person models are important for human factors science. Theoretical Issues in Ergonomics Science, 15(6), 595–614. 10.1080/1463922X.2013.856494 [DOI] [Google Scholar]
- Della‐Maggiore, V. , Scholz, J. , Johansen‐Berg, H. , & Paus, T. (2009). The rate of visuomotor adaptation correlates with cerebellar white‐matter microstructure. Human Brain Mapping, 30, 4048–4053. 10.1002/hbm.20828 [DOI] [PMC free article] [PubMed] [Google Scholar]
- Draganski, B. , Gaser, C. , Busch, V. , Schuierer, G. , Bogdahn, U. , & May, A. (2004). Neuroplasticity: Changes in grey matter induced by training. Nature, 427, 311–312. 10.1038/427311a [DOI] [PubMed] [Google Scholar]
- Duffy, L. J. , Baluch, B. , & Ericsson, K. A. (2004). Dart performance as a function of facets of practice amongst professional and amateur men and women players. International Journal of Sport Psychology, 35, 232–245. [Google Scholar]
- Eklund, A. , Nichols, T. E. , & Knutsson, H. (2016). Cluster failure: Why fMRI inferences for spatial extent have inflated false‐positive rates. Proceedings of the National Academy of Sciences of the United States of America, 113, 7900–7905. 10.1073/pnas.1602413113 [DOI] [PMC free article] [PubMed] [Google Scholar]
- Fields, R. D. (2015). A new mechanism of nervous system plasticity: Activity‐dependent myelination. Nature Reviews Neuroscience, 16, 756–767. 10.1038/nrn4023 [DOI] [PMC free article] [PubMed] [Google Scholar]
- Fischl, B. , & Dale, A. M. (2000). Measuring the thickness of the human cerebral cortex from magnetic resonance images. Proceedings of the National Academy of Sciences, 97, 11050–11055. 10.1073/pnas.200033797 [DOI] [PMC free article] [PubMed] [Google Scholar]
- Fisher, R. A. (1932). Statistical methods for research workers (4th ed.). Edinburgh: Oliver & Boyd. [Google Scholar]
- Floyer‐Lea, A. , & Matthews, P. M. (2005). Distinguishable brain activation networks for short‐ and long‐term motor skill learning. Journal of Neurophysiology, 94, 512–518. 10.1152/jn.00717.2004 [DOI] [PubMed] [Google Scholar]
- Fox, P. W. , Hershberger, S. L. , & Bouchard, T. J. (1996). Genetic and environmental contributions to the acquisition of a motor skill. Nature, 384, 356–358. 10.1038/384356a0 [DOI] [PubMed] [Google Scholar]
- Fuster, J. M. , & Bressler, S. L. (2015). Past makes future: Role of pFC in prediction. Journal of Cognitive Neuroscience, 27, 639–654. 10.1162/jocn_a_00746 [DOI] [PubMed] [Google Scholar]
- Gabrieli, J. D. E. , Ghosh, S. S. , & Whitfield‐Gabrieli, S. (2015). Prediction as a humanitarian and pragmatic contribution from human cognitive neuroscience. Neuron, 85, 11–26. 10.1016/j.neuron.2014.10.047 [DOI] [PMC free article] [PubMed] [Google Scholar]
- Gheysen, F. , Lasne, G. , Pélégrini‐Issac, M. , Albouy, G. , Meunier, S. , Benali, H. , … Popa, T. (2017). Taking the brakes off the learning curve. Human Brain Mapping, 38, 1676–1691. 10.1002/hbm.23489 [DOI] [PMC free article] [PubMed] [Google Scholar]
- Gómez‐Robles, A. , Hopkins, W. D. , Schapiro, S. J. , & Sherwood, C. C. (2015). Relaxed genetic control of cortical organization in human brains compared with chimpanzees. Proceedings of the National Academy of Sciences, 112, 14799–14804. 10.1073/pnas.1512646112 [DOI] [PMC free article] [PubMed] [Google Scholar]
- Grech‐Sollars, M. , Hales, P. W. , Miyazaki, K. , Raschke, F. , Rodriguez, D. , Wilson, M. , … Clark, C. A. (2015). Multi‐centre reproducibility of diffusion MRI parameters for clinical sequences in the brain. NMR in Biomedicine, 28, 468–485. 10.1002/nbm.3269 [DOI] [PMC free article] [PubMed] [Google Scholar]
- Gryga, M. , Taubert, M. , Dukart, J. , Vollmann, H. , Conde, V. , Sehm, B. , … Ragert, P. (2012). Bidirectional gray matter changes after complex motor skill learning. Frontiers in Systems Neuroscience, 6, 37 10.3389/fnsys.2012.00037 [DOI] [PMC free article] [PubMed] [Google Scholar]
- Gu, J. , & Kanai, R. (2014). What contributes to individual differences in brain structure? Frontiers in Human Neuroscience, 8, 262 10.3389/fnhum.2014.00262 [DOI] [PMC free article] [PubMed] [Google Scholar]
- Halsband, U. , & Lange, R. K. (2006). Motor learning in man: a review of functional and clinical studies. Journal of Physiology, Paris, 99, 414–424. 10.1016/j.jphysparis.2006.03.007 [DOI] [PubMed] [Google Scholar]
- Hardwick, R. M. , Rottschy, C. , Miall, R. C. , & Eickhoff, S. B. (2013). A quantitative meta‐analysis and review of motor learning in the human brain. NeuroImage, 67, 283–297. 10.1016/j.neuroimage.2012.11.020 [DOI] [PMC free article] [PubMed] [Google Scholar]
- Harsan, L. A. , Poulet, P. , Guignard, B. , Steibel, J. , Parizel, N. , de Sousa, P. L. , … Ghandour, M. S. (2006). Brain dysmyelination and recovery assessment by noninvasive in vivo diffusion tensor magnetic resonance imaging. Journal of Neuroscience Research, 83, 392–402. 10.1002/jnr.20742 [DOI] [PubMed] [Google Scholar]
- Hasan, K. M. , Gupta, R. K. , Santos, R. M. , Wolinsky, J. S. , & Narayana, P. A. (2005). Diffusion tensor fractional anisotropy of the normal‐appearing seven segments of the corpus callosum in healthy adults and relapsing‐remitting multiple sclerosis patients. Journal of Magnetic Resonance Imaging, 21, 735–743. 10.1002/jmri.20296 [DOI] [PubMed] [Google Scholar]
- Henry, F. M. (1956). Evaluation of motor learning when performance levels are heterogeneous. Research Quarterly. American Association for Health, Physical Education and Recreation, 27, 176–181. 10.1080/10671188.1956.10612868 [DOI] [Google Scholar]
- Huang, R. , Lu, M. , Song, Z. , & Wang, J. (2015). Long‐term intensive training induced brain structural changes in world class gymnasts. Brain Structure & Function, 220, 625–644. 10.1007/s00429-013-0677-5 [DOI] [PubMed] [Google Scholar]
- Jansen, A. G. , Mous, S. E. , White, T. , Posthuma, D. , & Polderman, T. J. C. (2015). What twin studies tell us about the heritability of brain development, morphology, and function: A review. Neuropsychology Review, 25, 27–46. 10.1007/s11065-015-9278-9 [DOI] [PMC free article] [PubMed] [Google Scholar]
- Jenkinson, M. , Bannister, P. , Brady, M. , & Smith, S. (2002). Improved optimization for the robust and accurate linear registration and motion correction of brain images. NeuroImage, 17, 825–841. 10.1006/nimg.2002.1132 [DOI] [PubMed] [Google Scholar]
- Johansen‐Berg, H. , Della‐Maggiore, V. , Behrens, T. E. J. , Smith, S. M. , & Paus, T. (2007). Integrity of white matter in the corpus callosum correlates with bimanual co‐ordination skills. NeuroImage, 36(Suppl 2), T16–T21. 10.1016/j.neuroimage.2007.03.041 [DOI] [PMC free article] [PubMed] [Google Scholar]
- Kaminski, E. , Hoff, M. , Sehm, B. , Taubert, M. , Conde, V. , Steele, C. J. , … Ragert, P. (2013). Effect of transcranial direct current stimulation (tDCS) during complex whole body motor skill learning. Neuroscience Letters, 552, 76–80. 10.1016/j.neulet.2013.07.034 [DOI] [PubMed] [Google Scholar]
- Kanai, R. , & Rees, G. (2011). The structural basis of inter‐individual differences in human behaviour and cognition. Nature Reviews Neuroscience, 12, 231–242. 10.1038/nrn3000 [DOI] [PubMed] [Google Scholar]
- Karni, A. , Meyer, G. , Rey‐Hipolito, C. , Jezzard, P. , Adams, M. M. , Turner, R. , & Ungerleider, L. G. (1998). The acquisition of skilled motor performance: Fast and slow experience‐driven changes in primary motor cortex. Proceedings of the National Academy of Sciences, 95, 861–868. 10.1073/pnas.95.3.861 [DOI] [PMC free article] [PubMed] [Google Scholar]
- Kerlinger, F. N. , & Pedhazur, E. J. (1973). Multiple regression in behavioral research. New York, NY: Holt Rinehart and Winston. [Google Scholar]
- Kincaid, M. (1925). A study of individual differences in learning. Psychological Bulletin, 32, 34–53. 10.1037/h0073540 [DOI] [Google Scholar]
- Klawiter, E. C. , Schmidt, R. E. , Trinkaus, K. , Liang, H.‐F. , Budde, M. D. , Naismith, R. T. , … Benzinger, T. L. (2011). Radial diffusivity predicts demyelination in ex vivo multiple sclerosis spinal cords. NeuroImage, 55, 1454–1460. 10.1016/j.neuroimage.2011.01.007 [DOI] [PMC free article] [PubMed] [Google Scholar]
- Kriegeskorte, N. , Lindquist, M. A. , Nichols, T. E. , Poldrack, R. A. , & Vul, E. (2010). Everything you never wanted to know about circular analysis, but were afraid to ask. Journal of Cerebral Blood Flow and Metabolism, 30, 1551–1557. 10.1038/jcbfm.2010.86 [DOI] [PMC free article] [PubMed] [Google Scholar]
- Lefebvre, S. , Dricot, L. , Gradkowski, W. , Laloux, P. , & Vandermeeren, Y. (2012). Brain activations underlying different patterns of performance improvement during early motor skill learning. NeuroImage, 62, 290–299. 10.1016/j.neuroimage.2012.04.052 [DOI] [PubMed] [Google Scholar]
- Li, S.‐C. , Lindenberger, U. , Hommel, B. , Aschersleben, G. , Prinz, W. , & Baltes, P. B. (2004). Transformations in the couplings among intellectual abilities and constituent cognitive processes across the life span. Psychological Science, 15, 155–163. 10.1111/j.0956-7976.2004.01503003.x [DOI] [PubMed] [Google Scholar]
- Lohse, K. R. , Wadden, K. , Boyd, L. A. , & Hodges, N. J. (2014). Motor skill acquisition across short and long time scales: A meta‐analysis of neuroimaging data. Neuropsychologia, 59, 130–141. 10.1016/j.neuropsychologia.2014.05.001 [DOI] [PubMed] [Google Scholar]
- McHughen, S. A. , Rodriguez, P. F. , Kleim, J. A. , Kleim, E. D. , Marchal Crespo, L. , Procaccio, V. , & Cramer, S. C. (2010). Bdnf val66met polymorphism influences motor system function in the human brain. Cerebral Cortex, 20, 1254–1262. 10.1093/cercor/bhp189 [DOI] [PMC free article] [PubMed] [Google Scholar]
- McKenzie, I. A. , Ohayon, D. , Li, H. , de Faria, J. P. , Emery, B. , Tohyama, K. , & Richardson, W. D. (2014). Motor skill learning requires active central myelination. Science, 346, 318–322. 10.1126/science.1254960 [DOI] [PMC free article] [PubMed] [Google Scholar]
- Melzer, T. R. , Watts, R. , MacAskill, M. R. , Pitcher, T. L. , Livingston, L. , Keenan, R. J. , … Anderson, T. J. (2013). White matter microstructure deteriorates across cognitive stages in Parkinson disease. Neurology, 80, 1841–1849. 10.1212/WNL.0b013e3182929f62 [DOI] [PubMed] [Google Scholar]
- Mills, K. L. , Goddings, A.‐L. , Herting, M. M. , Meuwese, R. , Blakemore, S.‐J. , Crone, E. A. , … Tamnes, C. K. (2016). Structural brain development between childhood and adulthood: Convergence across four longitudinal samples. NeuroImage, 141, 273–281. 10.1016/j.neuroimage.2016.07.044 [DOI] [PMC free article] [PubMed] [Google Scholar]
- Mugler, J. P. , & Brookeman, J. R. (1990). Three‐dimensional magnetization‐prepared rapid gradient‐echo imaging (3D MP RAGE). Magnetic Resonance in Medicine, 15, 152–157. 10.1002/mrm.1910150117 [DOI] [PubMed] [Google Scholar]
- Nichols, T. E. , & Holmes, A. P. (2002). Nonparametric permutation tests for functional neuroimaging: A primer with examples. Human Brain Mapping, 15, 1–25. 10.1002/hbm.1058 [DOI] [PMC free article] [PubMed] [Google Scholar]
- Nimon, K. F. , & Oswald, F. L. (2013). Understanding the results of multiple linear regression. Organizational Research Methods, 16, 650–674. 10.1177/1094428113493929 [DOI] [Google Scholar]
- Oldfield, R. C. (1971). The assessment and analysis of handedness: The Edinburgh inventory. Neuropsychologia, 9, 97–113. 10.1016/0028-3932(71)90067-4 [DOI] [PubMed] [Google Scholar]
- Pesarin, F. , & Salmaso, L. (2010). Permutation tests for complex data. Theory, applications and software (2nd ed.). Hoboken, NJ: Wiley. [Google Scholar]
- Pfefferbaum, A. , Adalsteinsson, E. , & Sullivan, E. V. (2003). Replicability of diffusion tensor imaging measurements of fractional anisotropy and trace in brain. Journal of Magnetic Resonance Imaging, 18, 427–433. 10.1002/jmri.10377 [DOI] [PubMed] [Google Scholar]
- Plomin, R. , DeFries, J. C. , & Loehlin, J. C. (1977). Genotype‐environment interaction and correlation in the analysis of human behavior. Psychological Bulletin, 84, 309–322. 10.1037/0033-2909.84.2.309 [DOI] [PubMed] [Google Scholar]
- R Development Core Team . (2018). R: A language and environment for statistical computing [computer software]. Vienna, Austria: R Foundation for Statistical Computing. URL; http://www.r-project.org/ [Google Scholar]
- Reese, T. G. , Heid, O. , Weisskoff, R. M. , & Wedeen, V. J. (2003). Reduction of eddy‐current‐induced distortion in diffusion MRI using a twice‐refocused spin echo. Magnetic Resonance in Medicine, 49, 177–182. 10.1002/mrm.10308 [DOI] [PubMed] [Google Scholar]
- Ruigrok, A. N. V. , Salimi‐Khorshidi, G. , Lai, M.‐C. , Baron‐Cohen, S. , Lombardo, M. V. , Tait, R. J. , & Suckling, J. (2014). A meta‐analysis of sex differences in human brain structure. Neuroscience and Biobehavioral Reviews, 39, 34–50. 10.1016/j.neubiorev.2013.12.004 [DOI] [PMC free article] [PubMed] [Google Scholar]
- Sampaio‐Baptista, C. , Khrapitchev, A. A. , Foxley, S. , Schlagheck, T. , Scholz, J. , Jbabdi, S. , … Johansen‐Berg, H. (2013). Motor skill learning induces changes in white matter microstructure and myelination. The Journal of Neuroscience, 33, 19499–19503. 10.1523/JNEUROSCI.3048-13.2013 [DOI] [PMC free article] [PubMed] [Google Scholar]
- Sampaio‐Baptista, C. , Scholz, J. , Jenkinson, M. , Thomas, A. G. , Filippini, N. , Smit, G. , … Johansen‐Berg, H. (2014). Gray matter volume is associated with rate of subsequent skill learning after a long term training intervention. NeuroImage, 96, 158–166. 10.1016/j.neuroimage.2014.03.056 [DOI] [PMC free article] [PubMed] [Google Scholar]
- Scholz, J. , Klein, M. C. , Behrens, T. E. J. , & Johansen‐Berg, H. (2009). Training induces changes in white‐matter architecture. Nature Neuroscience, 12, 1370–1371. 10.1038/nn.2412 [DOI] [PMC free article] [PubMed] [Google Scholar]
- Seidler, R. D. (2004). Multiple motor learning experiences enhance motor adaptability. Journal of Cognitive Neuroscience, 16, 65–73. 10.1162/089892904322755566 [DOI] [PubMed] [Google Scholar]
- Seidler, R. D. (2010). Neural correlates of motor learning, transfer of learning, and learning to learn. Exercise and Sport Sciences Reviews, 38, 3–9. 10.1097/JES.0b013e3181c5cce7 [DOI] [PMC free article] [PubMed] [Google Scholar]
- Smith, S. M. , Jenkinson, M. , Johansen‐Berg, H. , Rueckert, D. , Nichols, T. E. , Mackay, C. E. , … Behrens, T. E. J. (2006). Tract‐based spatial statistics: Voxelwise analysis of multi‐subject diffusion data. NeuroImage, 31, 1487–1505. 10.1016/j.neuroimage.2006.02.024 [DOI] [PubMed] [Google Scholar]
- Smith, S. M. , Jenkinson, M. , Woolrich, M. W. , Beckmann, C. F. , Behrens, T. E. J. , Johansen‐Berg, H. , … Matthews, P. M. (2004). Advances in functional and structural MR image analysis and implementation as FSL. NeuroImage, 23(Suppl 1), S208–S219. 10.1016/j.neuroimage.2004.07.051 [DOI] [PubMed] [Google Scholar]
- Smith, S. M. , & Nichols, T. E. (2009). Threshold‐free cluster enhancement: Addressing problems of smoothing, threshold dependence and localisation in cluster inference. NeuroImage, 44, 83–98. 10.1016/j.neuroimage.2008.03.061 [DOI] [PubMed] [Google Scholar]
- Song, S. , Sharma, N. , Buch, E. R. , & Cohen, L. G. (2012). White matter microstructural correlates of superior long‐term skill gained implicitly under randomized practice. Cerebral Cortex, 22, 1671–1677. 10.1093/cercor/bhr247 [DOI] [PMC free article] [PubMed] [Google Scholar]
- Song, S.‐K. , Sun, S.‐W. , Ramsbottom, M. J. , Chang, C. , Russell, J. , & Cross, A. H. (2002). Dysmyelination revealed through MRI as increased radial (but unchanged axial) diffusion of water. NeuroImage, 17, 1429–1436. 10.1006/nimg.2002.1267 [DOI] [PubMed] [Google Scholar]
- Song, S.‐K. , Yoshino, J. , Le, T. Q. , Lin, S.‐J. , Sun, S.‐W. , Cross, A. H. , & Armstrong, R. C. (2005). Demyelination increases radial diffusivity in corpus callosum of mouse brain. NeuroImage, 26, 132–140. 10.1016/j.neuroimage.2005.01.028 [DOI] [PubMed] [Google Scholar]
- Starkes, J. L. , Deakin, J. M. , Allard, F. , Hodges, N. J. , & Hayes, A. (1996). Deliberate practice in sports: What is it anyway? In Ericsson K. A. (Ed.), The road to excellence: The acquisition of expert performance in the arts and sciences, sports, and games. New York: Psychology Press. [Google Scholar]
- Steele, C. J. , Scholz, J. , Douaud, G. , Johansen‐Berg, H. , & Penhune, V. B. (2012). Structural correlates of skilled performance on a motor sequence task. Frontiers in Human Neuroscience, 6, 289 10.3389/fnhum.2012.00289 [DOI] [PMC free article] [PubMed] [Google Scholar]
- Streitbürger, D.‐P. , Pampel, A. , Krueger, G. , Lepsien, J. , Schroeter, M. L. , Mueller, K. , & Möller, H. E. (2014). Impact of image acquisition on voxel‐based‐morphometry investigations of age‐related structural brain changes. NeuroImage, 87, 170–182. 10.1016/j.neuroimage.2013.10.051 [DOI] [PubMed] [Google Scholar]
- Talairach, J. , & Tournoux, P. (1988). Co‐planar stereotaxic atlas of the human brain: 3‐dimensional proportional system. An approach to cerebral imaging. Stuttgart, New York, NY: G. Thieme. [Google Scholar]
- Taubert, M. , Draganski, B. , Anwander, A. , Müller, K. , Horstmann, A. , Villringer, A. , & Ragert, P. (2010). Dynamic properties of human brain structure: Learning‐related changes in cortical areas and associated fiber connections. The Journal of Neuroscience, 30, 11670–11677. 10.1523/JNEUROSCI.2567-10.2010 [DOI] [PMC free article] [PubMed] [Google Scholar]
- Taubert, M. , Mehnert, J. , Pleger, B. , & Villringer, A. (2016). Rapid and specific gray matter changes in M1 induced by balance training. NeuroImage, 133, 399–407. 10.1016/j.neuroimage.2016.03.017 [DOI] [PubMed] [Google Scholar]
- Toga, A. W. , & Thompson, P. M. (2005). Genetics of brain structure and intelligence. Annual Review of Neuroscience, 28, 1–23. 10.1146/annurev.neuro.28.061604.135655 [DOI] [PubMed] [Google Scholar]
- Tomassini, V. , Jbabdi, S. , Kincses, Z. T. , Bosnell, R. , Douaud, G. , Pozzilli, C. , … Johansen‐Berg, H. (2011). Structural and functional bases for individual differences in motor learning. Human Brain Mapping, 32, 494–508. 10.1002/hbm.21037 [DOI] [PMC free article] [PubMed] [Google Scholar]
- Toni, I. , Krams, M. , Turner, R. , & Passingham, R. E. (1998). The time course of changes during motor sequence learning: A whole‐brain fMRI study. NeuroImage, 8, 50–61. 10.1006/nimg.1998.0349 [DOI] [PubMed] [Google Scholar]
- Tsujimoto, S. , Genovesio, A. , & Wise, S. P. (2011). Frontal pole cortex: Encoding ends at the end of the endbrain. Trends in Cognitive Sciences, 15, 169–176. 10.1016/j.tics.2011.02.001 [DOI] [PubMed] [Google Scholar]
- Van den Heuvel, M. P. , Mandl, R. C. W. , Kahn, R. S. , & Hulshoff Pol, H. E. (2009). Functionally linked resting‐state networks reflect the underlying structural connectivity architecture of the human brain. Human Brain Mapping, 30, 3127–3141. 10.1002/hbm.20737 [DOI] [PMC free article] [PubMed] [Google Scholar]
- Vollmar, C. , O'Muircheartaigh, J. , Barker, G. J. , Symms, M. R. , Thompson, P. , Kumari, V. , … Koepp, M. J. (2010). Identical, but not the same: Intra‐site and inter‐site reproducibility of fractional anisotropy measures on two 3.0T scanners. NeuroImage, 51, 1384–1394. 10.1016/j.neuroimage.2010.03.046 [DOI] [PMC free article] [PubMed] [Google Scholar]
- Wheeler‐Kingshott, C. A. M. , & Cercignani, M. (2009). About “axial” and “radial” diffusivities. Magnetic Resonance in Medicine, 61, 1255–1260. 10.1002/mrm.21965 [DOI] [PubMed] [Google Scholar]
- Winkler, A. M. , Ridgway, G. R. , Webster, M. A. , Smith, S. M. , & Nichols, T. E. (2014). Permutation inference for the general linear model. NeuroImage, 92, 381–397. 10.1016/j.neuroimage.2014.01.060 [DOI] [PMC free article] [PubMed] [Google Scholar]
- Winkler, A. M. , Webster, M. A. , Brooks, J. C. , Tracey, I. , Smith, S. M. , & Nichols, T. E. (2016). Non‐parametric combination and related permutation tests for neuroimaging. Human Brain Mapping, 37, 1486–1511. 10.1002/hbm.23115 [DOI] [PMC free article] [PubMed] [Google Scholar]
- Winter, R. , & Hartmann, C. (2007). Die motorische Entwicklung (Ontogenese) des Menschen In Meinel K. & Schnabel G. (Eds.), Bewegungslehre ‐ Sportmotorik: Abriss einer Theorie der sportlichen Motorik unter pädagogischem Aspekt (11th ed., pp. 243–373). Aachen: Meyer & Meyer. [Google Scholar]
- Wulf, G. , Höß, M. , & Prinz, W. (1998). Instructions for motor learning: Differential effects of internal versus external focus of attention. Journal of Motor Behavior, 30, 169–179. 10.1080/00222899809601334 [DOI] [PubMed] [Google Scholar]
- Wulf, G. , & Shea, C. H. (2002). Principles derived from the study of simple skills do not generalize to complex skill learning. Psychonomic Bulletin & Review, 9, 185–211. 10.3758/BF03196276 [DOI] [PubMed] [Google Scholar]
- Xiao, L. , Ohayon, D. , McKenzie, I. A. , Sinclair‐Wilson, A. , Wright, J. L. , Fudge, A. D. , … Richardson, W. D. (2016). Rapid production of new oligodendrocytes is required in the earliest stages of motor‐skill learning. Nature Neuroscience, 19, 1210–1217. 10.1038/nn.4351 [DOI] [PMC free article] [PubMed] [Google Scholar]
- Zatorre, R. J. (2013). Predispositions and plasticity in music and speech learning: Neural correlates and implications. Science, 342, 585–589. 10.1126/science.1238414 [DOI] [PubMed] [Google Scholar]
- Zhao, J. H. (2007). Gap: Genetic analysis package. Journal of Statistical Software, 23(8). 10.18637/jss.v023.i08 [DOI] [Google Scholar]
Associated Data
This section collects any data citations, data availability statements, or supplementary materials included in this article.
Supplementary Materials
Appendix S1: Supporting Information.