

Abstract
Auditory contextual processing has been assumed to be based on a hierarchical structure consisting of the primary auditory cortex, superior temporal gyrus (STG), and frontal lobe. Recent invasive studies on mismatch negativity (MMN) have revealed functional segregation for auditory contextual processing such as neural adaptation in the primary auditory cortex and prediction in the frontal lobe. However, the role of the STG remains unclear. We obtained induced activity in the high gamma band as mismatch response (MMR), an electrocorticographic (ECoG) counterpart to scalp MMN, and the components of MMR by analyzing ECoG data from patients with refractory epilepsy in an auditory oddball task paradigm. We found that MMR localized mainly in the bilateral posterior STGs, and that deviance detection largely accounted for MMR. Furthermore, adaptation was identified in a limited number of electrodes on the superior temporal plane. Our findings reveal a mixed contribution of deviance detection and adaptation depending on location in the STG. Such spatial considerations could lead to further understanding of the pathophysiology of relevant psychiatric disorders.
Keywords: adaptation, auditory processing, deviance detection, high gamma activity, mismatch negativity, schizophrenia
1. INTRODUCTION
An enormous amount of auditory information constantly floods into our auditory system. To avoid inefficient energy consumption in dealing with all the input sounds, our brains show strong response to important auditory information but weak response to unimportant auditory information based on the context of auditory stimuli even when we do not attend to the auditory stimuli. This “auditory contextual processing” is one of the neurocognitive bases of language‐based social communication (Hickok & Poeppel, 2007), deficits in which play a key role in the pathophysiology of psychiatric disorders relevant to the impairment of such social functions (Thomas et al., 2017). Mismatch negativity (MMN) has been intensively studied, as this is a feasible and reliable index of auditory contextual processing. In addition to the historical contribution to the understanding of auditory contextual processing (Näätänen, Gaillard, & Mantysalo, 1978), MMN has also been revealed to be reduced in patients with psychiatric disorders such as schizophrenia, reflecting impairment in pre‐attentive cognitive processing (Thomas et al., 2017) and mechanisms of illness onset (Bodatsch et al., 2011; Nagai et al., 2013; Perez et al., 2014). Reduced MMN is the most robust finding regarding brain changes in schizophrenia (Erickson, Ruffle, & Gold, 2016; Shelley et al., 1991; Umbricht & Krljes, 2005), and therefore could represent an important electrophysiological clue to elucidating the pathophysiology of schizophrenia.
MMN was first reported by Näätänen et al in 1978, as a brain response evoked by a rare deviant stimulus after repetitive standard stimuli (Näätänen et al., 1978). They proposed that underlying process of MMN generation is “deviance detection”, which is a higher‐level comparison process based on sensory memory. Although a number of studies support their assumption (Garrido, Kilner, Stephan, & Friston, 2009; Wacongne, Changeux, & Dehaene, 2012), it remains unclear which part of the human brain plays a key role in deviance detection. Contrary to this “deviance detection model,” several studies advocated that MMN can be accounted for solely by “neural adaptation” of N1 response (Horvath et al., 2008; Jaaskelainen et al., 2004; May & Tiitinen, 2010). Interestingly, there are other studies which remained in neutral, demonstrating that both deviance detection and adaptation are involved in generating MMN. Strauss et al. elaborated an oddball task which was assumed to elicit deviance detection specifically during wakefulness and compared MMN during wakefulness and sleeping. They concluded that deviance detection disappeared during sleep but that a measurable MMN‐like response remained and may be due to adaptation effects (Strauss et al., 2015).
MMN is assumed to be generated through reciprocal processing among the primary auditory cortex, superior temporal gyrus (STG), and frontal lobe, which together constitute a hierarchical structure (Garrido et al., 2008; Phillips, Blenkmann, Hughes, Bekinschtein, & Rowe, 2015). However, it is still an open question to which part and stage in this hierarchy deviance detection and adaptation are attributable. Unfortunately, spatiotemporal resolution and signal‐to‐noise ratio (S/N) of EEG and MEG do not seem to be high enough to answer this question. One of the most suitable tools to address this issue is intracranial recording. Indeed, recent studies using intracranial recordings from macaques and humans have revealed correspondence between relevant functions and cortical regions (Durschmid et al., 2016; Fishman & Steinschneider, 2012). Fishman et al. recorded cortical responses using depth electrodes inserted into the primary auditory cortex of macaques under a mismatch task paradigm (Fishman & Steinschneider, 2012). They detected mismatch responses in the primary auditory cortex and demonstrated that only adaptation contributed to the responses. On the other hand, Durschmid et al. performed human electrocorticography (ECoG) with predictable and unpredictable oddball stimuli and observed mismatch responses widely in the frontotemporal cortex (Durschmid et al., 2016). They showed strong involvement of the frontal lobe in the prediction process that could affect mismatch responses.
Despite these elaborated studies, the role of STG in generating mismatch responses remains unclear. Given that Fishman et al. and Durschmid et al. demonstrated the respective importance of adaptation in the primary auditory cortex and prediction in the frontal lobe, it seems reasonable to assume that STG could be responsible for deviance detection, a principal component of MMN along with adaptation (Näätänen, 1995; Näätänen, Jacobsen, & Winkler, 2005; Näätänen, Paavilainen, Rinne, & Alho, 2007). The lateral aspect of STG is a candidate region for deviance detection, potentially serving as a hub structure in the network of auditory contextual processing by connecting the primary auditory cortex and frontal lobe. Actually, there have been a considerable number of studies which showed the contribution of deviance detection to mismatch responses in the STG (Maess, Jacobsen, Schroger, & Friederici, 2007; Näätänen et al., 2005; Näätänen et al., 2007; Opitz, Schroger, & von Cramon, 2005; Recasens, Grimm, Capilla, Nowak, & Escera, 2014). On the other hand, some studies have advocated the contribution of adaptation not only in the primary auditory cortex but also in the STG (May & Tiitinen, 2010). Given the plausibility of all the previous studies, it seems reasonable to assume that two components of the mismatch response, deviance detection and adaptation, could be distributed in a mixed manner with different weights depending on the relative locations in the STG. However, most of the previous studies on the mechanism of mismatch responses in the STG have been based on the analyses of EEG and MEG data, which have a limitation in spatial resolution within a gyrus. For further understanding of the whole picture of auditory contextual processing, we need to validate the hypothesis by using invasive recordings, which can achieve higher S/N and higher spatial resolution.
To address this issue, we recorded ECoG from the lateral cortices using high‐density subdural electrodes placed in patients with refractory epilepsy. To maximize the advantage of ECoG, we analyzed induced activity in the high‐gamma band, which reflects cortical activity just below an electrode, and achieved higher S/N and spatial resolution than event‐related potential (Crone, Boatman, Gordon, & Hao, 2001; Edwards, Soltani, Deouell, Berger, & Knight, 2005), enabling a quantitative analysis for each electrode. By comparing induced activity between the auditory standard oddball (OD) task and the many standards (MS) task appropriately (Farley, Quirk, Doherty, & Christian, 2010; Fishman & Steinschneider, 2012; Grimm, Escera, Slabu, & Costa‐Faidella, 2011; Maess et al., 2007), we obtained mismatch response (MMR), an ECoG‐counterpart of MMN, and divided MMR into deviance detection and adaptation components, which were then visualized on a template brain. As a result, we successfully demonstrated deviance detection as a dominant component of MMR/MMN in the lateral STG and revealed a mixed contribution of deviance detection and adaptation depending on locations in the STG. This novel finding is expected to contribute to further understanding of auditory contextual processing and the pathophysiology of various psychiatric disorders.
2. MATERIALS AND METHODS
2.1. Subjects
Ten subjects (four females) who suffered from refractory epilepsy participated in this study. Subdural electrodes placement was performed to identify the epileptic foci and to localize functional brain areas. Electrode configuration and the identified epileptic foci for each patient are listed in Table 1. The language dominant side was left in all subjects.
Table 1.
Demographic characteristics of subjects
| No. | Age (y)/sex | Duration of epilepsy (y) | Electrode coverage | Epileptic foci | Etiology and MRI findings | AED |
|---|---|---|---|---|---|---|
| 1 | 43/M | 23 | Bil FT | Lt lat & med T | No lesion | LTG, GBP, CBZ |
| 2 | 44/F | 27 | Lt FTP | Lt lat & med T | No lesion | LEV, TPM, CBZ, PHT |
| 3 | 22/M | 8 | Rt FT | Rt F, lat & med T | Polyarteritis nodosa postresection of Lt F | LEV, LTG, TPM, ZNS, PHT, CLB |
| 4 | 20/M | 2 | Bil FTP | Bil T | No lesion | LEV, CLB |
| 5 | 33/F | 20 | Bil FTP | Rt lat & med T | Heterotopia in Lt lateral ventricle | LTG, CBZ, PHT, CNZ |
| 6 | 58/F | 49 | Lt FTP | Lt lat & med T | Old cerebral infarction of Lt basal ganglia | LEV, LTG, ZNS |
| 7 | 20/F | 12 | Lt FTP | Lt lat & med T | No lesion | LEV, LTG, VPA, ZNS |
| 8 | 36/M | 18 | Bil FTP | Lt lat T | No lesion | TPM, VPA, CLB |
| 9 | 18/M | 10 | Bil FTP | Rt O | Rt O ganglioglioma | LEV, LTG, CBZ |
| 10 | 30/M | 14 | Bil FTP | Rt lat T | No lesion | LEV, TPM, GBP |
Abbreviations: AED = anti‐epileptic drug; Bil = bilateral; CBZ = carbamazepine; CLB = clobazam; CZP = clonazepam; F = frontal lobe; GBP = gabapentin; lat = lateral; LEV = levetiracetam; Lt = left; LTG = lamotrigine; med = medial; O = occipital lobe; P = parietal lobe; PHT = phenytoin; Rt = right; T = temporal lobe; TPM = topiramate; VPA = valproate; ZNS = zonisamide.
Subjects were screened using the Mini‐International Neuropsychiatric Interview (Sheehan et al., 1998) to rule out psychiatric disorders. We confirmed that all subjects could detect 1,000‐Hz tones at 30‐dB sound pressure level using audiometric testing.
This study was approved by the ethics review board of the University of Tokyo Hospital. Written informed consent was obtained from all subjects and their family before participation in this study.
2.2. Mismatch task paradigm
For this study, two auditory mismatch tasks were performed while subjects were seated in an electrically shielded room. All stimuli used in the recording were sinusoidal tones with an 80‐dB sound pressure level with a duration of 50 ms with 1‐ms rise/fall time (Multi Trigger System; Medical Try System, Tokyo, Japan). Inter‐stimulus intervals (onset‐to‐onset) (ISIs) were 500 ms. Tones were presented binaurally through inserted earphones while subjects watched a silent video presented on a desktop monitor. We assessed sleepiness of all the subjects by Stanford sleepiness scale (Hoddes, Zarcone, Smythe, Phillips, & Dement, 1973) before/after ECoG recordings, and confirmed that all of them scored one or two points.
The mismatch task paradigm in this study consisted of OD and MS tasks. During each task, the subject was instructed to watch a silent cartoon video while ignoring the auditory stimuli. In the OD task, two different pitches of sound, 1,000 Hz (=F1) and 1,200 Hz (=F2), were delivered to the subject (Nagai et al., 2013). The sounds of F1 were presented as standard stimuli with a high probability of 90%, and the sounds of F2 were presented as deviant stimuli with a low probability of 10% (Figure 1a). In the MS task, 10 different pitches of stimuli (every 100 Hz from 700 to 1,600 Hz) were used, including F1 and F2. Each stimulus was presented at the same probability of 10% (Figure 1b) (Fishman & Steinschneider, 2012). The order of stimuli was completely random in both tasks.
Figure 1.
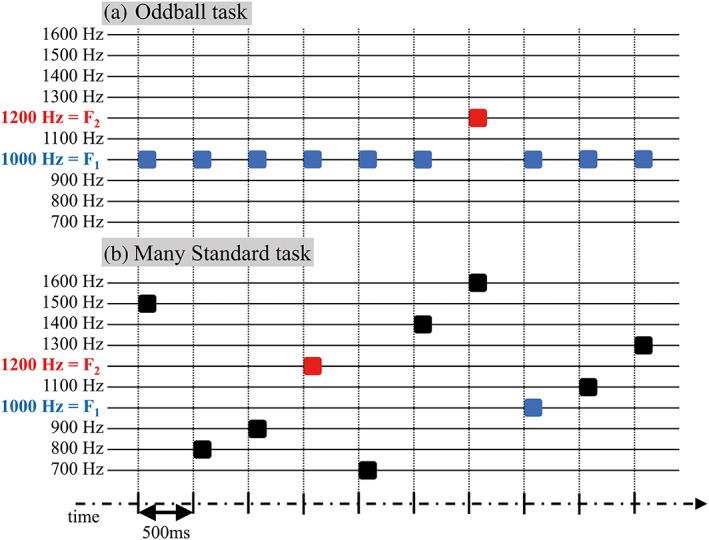
Schema of auditory mismatch task paradigm. Mismatch paradigm in this study consisted of an “Oddball (OD) task” and a “Many standards (MS) task.” A schema of the paradigm is shown. All stimuli used in the recording were sinusoidal tones with 80‐dB sound pressure level with a duration of 50 ms with 1‐ms rise/fall time. The inter‐stimulus interval (onset‐to‐onset) was 500 ms. In this schema, blue squares represent sounds of 1,000 Hz (=F1), red squares represent sounds of 1,200 Hz (=F2), and black squares represent sounds of other pitches. For visibility, the width of each square was elongated than actual duration of 50 ms. (a) In the OD task, two different pitches of sound, 1,000 Hz (=F1) and 1,200 Hz (=F2), were delivered to subjects. Sounds of F1 were presented as standard stimuli with a high probability of 90%, and sounds of F2 were presented as deviant stimuli with a low probability of 10%. (b) In the MS task, 10 degrees of stimuli were used (every 100 Hz, from 700 to 1,600 Hz), including F1 and F2. Each stimulus was presented with the same probability (10%). The order of stimuli was completely random in both tasks
2.3. Data acquisition
Grid‐type subdural electrodes, consisting of silastic sheets with platinum electrodes (Unique Medical, Tokyo, Japan), were placed over the lateral surface of the frontal, temporal, and parietal lobes depending on the clinical purpose of each subject. Two types of grid electrode were used in this study: conventional and higher‐density electrodes with electrode diameters of 3 and 1.5 mm and inter‐electrode (center‐to‐center) distances of 10 and 5 mm, respectively. Electrodes were placed for 2–4 weeks, during which ECoG recording for this study was performed after obtaining sufficient seizure information for clinical purposes. No epileptic seizure events were identified in the 24 hrs before and after ECoG recording for this study.
Data from ECoG were sampled at 2000 Hz using a multichannel EEG system (EEG 1200; Nihon Kohden, Tokyo, Japan). The band‐pass filter for data acquisition was set to 0.09–600 Hz. A reference electrode was placed on the inner surface of the dura mater over the parietal lobe.
2.4. Electrode localization
Electrode locations were identified by postimplantation computed tomography registered to preimplantation MRI based on the mutual information method using Dr. View/Linux (Infocom, Tokyo, Japan). The three‐dimensional (3D) brain surface with fused subdural electrodes was reconstructed using Real INTAGE (Cybernet Systems, Tokyo, Japan) for individual analysis. For group‐level analysis, each electrode location was transformed to Montreal Neurological Institute (MNI) coordinates using the same parameters generated in the normalization of 3D‐MRI data with SPM8 (Wellcome Department of Imaging Neuroscience, London, UK).
2.5. Data analysis
All data from ECoG were analyzed using a custom script written in Matlab R2015b (MathWorks, Natick, MA).
On the basis of visual inspection of signals from ECoG, epochs involving singular noises and epileptic spikes were excluded, leaving more than 80% of all the epochs in every recording. Further analyses were performed for those epochs.
To visually confirm the proper latency and frequency range before quantitative analyses, we obtained the event‐related spectral perturbation (ERSP) (Makeig, Debener, Onton, & Delorme, 2004) map. First, short time fast Fourier transformation was applied to whole time series data using 100 ms Hamming‐window with 99% overlap. With zero padding, the width of frequency bin was set to 2 Hz, yielding 75 bins (0–150 Hz). Then, we epoched the signals and obtained spectrograms from 100 ms prestimulus to 300 ms poststimulus. Finally, for each frequency bin, the power value for each time point was Z‐normalized to the baseline period (−100 to 0 ms), generating a single epoch ERSP map. Resulting ERSP maps were then averaged for every epoch. To obtain statistical map for each comparison, we performed paired t‐test for each time‐frequency bin and took the log of p values (p value <.01 was visualized) (Figure 2).
Figure 2.
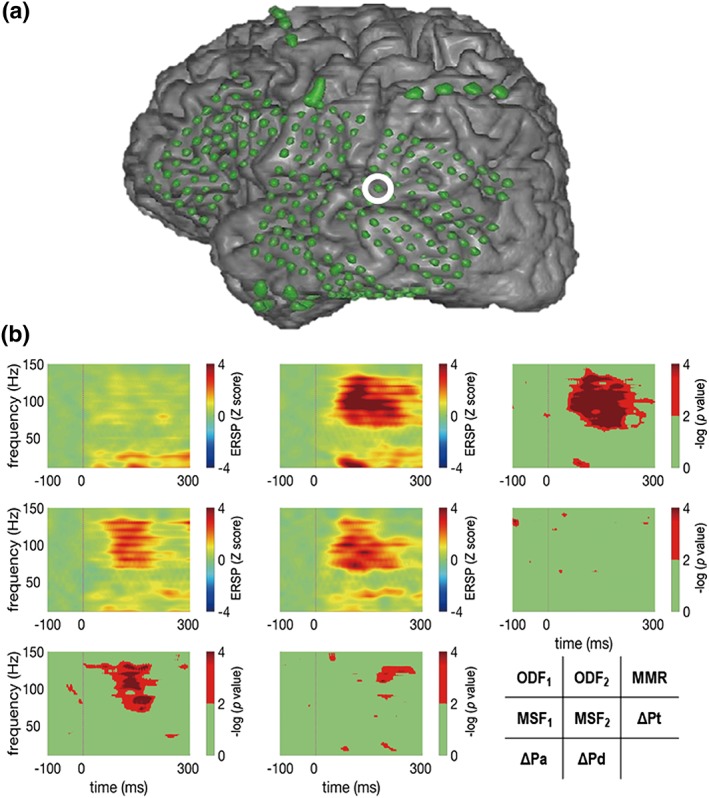
The result of time‐frequency analysis on a representative electrode in an illustrative case (Pt7). As left temporal lobe epilepsy was suspected in Pt7, the left fronto‐temporo‐parietal lobes were widely covered by high‐density electrodes (electrode diameter: 1.5 mm; inter‐electrode distance: 5 mm). Event‐related spectral perturbation (ERSP) maps for four different conditions and the resultant statistical maps at the electrode surrounded by a white circle. The four conditions for the ERSP maps are F1 and F2 in OD task (ODF1 and ODF2), and F1 and F2 in MS task (MSF1 and MSF2). Each map is arranged so that the comparable two ERSP maps and the resulting statistical map are in the same row or column. For instance, the statistical map for MMR was obtained by comparison between ERSP maps for ODF1 and ODF2 (the first row). Significant differences were observed in the high‐gamma (70–150 Hz) band in the statistical maps for MMR, ΔPd, and ΔPa
Based on the ERSP results, a finite impulse response filter was applied to the ECoG data recorded during OD and MS tasks to extract the signals containing high‐gamma band activity ranging from 70 to 150 Hz. High‐gamma power was then obtained for each time point of filtered ECoG signals by Hilbert transforming. The high‐gamma power for each time point from 0 to 500 ms poststimulus was Z‐normalized to the baseline period from −100 to 0 ms prestimulus.
In addition to deviance detection and adaptation, we included tone difference as a third component of MMR, as oscillatory activity attributable to tonotopy could contribute to MMR differently depending on location. MMR and the three components, deviance detection (ΔPd), adaptation (ΔPa), and tone difference (ΔPt), were obtained as follows. MMR was calculated by subtracting the Z‐scored high‐gamma power induced by F1 from that by F2 in the OD task, according to the calculation of MMN. We calculated ΔPd by subtracting the Z‐scored high‐gamma power induced by F2 in the MS task from the power induced by F2 in the OD task. We calculated ΔPa by subtracting the power induced by F1 in the OD task from that by F1 in the MS task. We calculated ΔPt as a difference between the powers induced by F1 and F2 in the MS task. Using the data between 100 and 200 ms according to visual inspection of our ERSP results and previous studies (Alho, 1995; Giard et al., 1995; Näätänen et al., 1978; Näätänen et al., 2005; Näätänen et al., 2007), we performed t test on each comparison to select those electrodes with significant differences and used only data from those electrodes in further analyses.
2.6. Statistical analysis
All statistical analyses were performed using custom software written in Matlab R2015b. The t test used to obtain statistical ERSP maps was Bonferroni‐corrected for the number of time‐frequency bins at each electrode. The t test used to choose significant electrodes for each component including MMR was Bonferroni‐corrected for the number of corresponding grid electrodes. In calculating MMR and ΔPa, as the number of F1 trials in OD task was nine times larger than that of F2 trials in OD task and F1 trials in MS task, we randomly picked up F1 trials in OD task and balanced the number of trials to guarantee the same level of statistical power in detecting significant MMR and its components. In quantitative group‐level comparisons among ΔPd, ΔPa, and ΔPt, we performed analysis of variance (anova) followed by post hoc analysis using paired t‐test with Bonferroni correction for the number of components. The significance level was set at p < .01 for all statistical analyses.
3. RESULTS
We placed 1,360 subdural electrodes in nine left hemispheres and 440 electrodes in seven right hemispheres of 10 subjects (Table 1). In all cases except Pt10, higher‐density electrodes in combination with conventional electrodes were used to widely cover the left fronto‐temporo‐parietal lobes. In the case of Pt10, only conventional electrodes were implanted bilaterally. The right hemispheres of all cases were covered with conventional electrodes only.
Using these electrodes, we recorded ECoG while the subject performed the OD task and the MS task. Figure 2 features an example of time‐frequency analysis, in which spectrograms and the resulting statistical comparisons were shown. MMR and its components were observed between 100 and 200 ms poststimulus in the high‐gamma band (70–150 Hz), which was typical of those observed among all subjects except Pt6. The following analyses were performed focusing on these latency and frequency band. By comparing the high‐gamma power induced by each stimulus in OD and MS task properly, we isolated MMR and three components, ΔPd, ΔPa, and ΔPt.
To illustrate an individual analysis, results for Pt7 are shown in Figure 3. Ten electrodes with significant MMR were distributed around the STG. For illustrating purpose, we exemplified details of three representative electrodes (a, b, and c in Figure 3a) along the distal Sylvian fissure.
Figure 3.

Spatial distributions of significant MMR and a detailed profile of its components. As with Figure 2, the data of Pt7 are shown in this figure as an illustrative case. Based on the observation of ERSP maps, we focused on the activity in the high‐gamma range and quantified MMR and its three components by appropriate comparisons (see Section 2 for details). (a) 10 electrodes with significant MMR (t test, Bonferroni‐corrected, significance level set at p < .01) are shown as red filled circles. The radius of the circle is proportional to the strength of MMR. Electrodes with significant MMR are distributed around the STG. (b) Time courses (left) and integral values (100–200 ms) (right) of MMR and its three components at the three representative electrodes (specified as a, b, and c in Figure 3a) along the distal Sylvian fissure are shown. At electrode b, ΔPd was the main component of MMR. At electrode a, located next to electrode b, ΔPd and ΔPa contributed to MMR generation to a similar extent at electrode a. At electrode c, no significant MMR was observed. Lines and bars of red, pink, blue, and green represent MMR, ΔPd, ΔPa, and ΔPt, respectively. The horizontal bars at the bottom of each graph consist of the time points at which there were significant differences in the calculation of each component (the colors are matched)
At electrode b, integral values of MMR, ΔPd, ΔPa, and ΔPt between 100 and 200 ms were 0.71, 0.96, −0.027, and − 0.18, respectively, revealing ΔPd as the main component of MMR (Figure 3bb). On the other hand, at electrode a, which was located next to electrode b, integral values of MMR, ΔPd, ΔPa, and ΔPt were 1.09, 0.53, 0.59, and − 0.029, respectively. These results showed that ΔPd and ΔPa contributed to MMR generation to a similar extent at electrode a (Figure 3ba). Interestingly, electrode c, which was next to electrode b on the other side of electrode a, exhibited no significant MMR (Figure 3bc). As this case shows, the representations of MMR and its components change dramatically depending on the locations even at a distance of 5 mm, suggesting that the high spatial resolution in this study was important to reveal spatial profiles of MMR and its components. Note that the above illustrated three electrodes were selected only for the purpose of illustration. Actually, we calculated the three components for all the electrodes with significant MMR.
The same analytic procedures were repeated for all patients. In 9 of 10 patients, electrodes with significant MMR were consistently observed, yielding total of 59 electrodes with significant MMR across all patients. The following group‐level analyses were performed on these statistically extracted 59 electrodes.
To investigate the gross contribution degree of each component regardless of the cortical locations, we calculated the mean for each component regarding the 59 electrodes with significant MMR (Figure 4a). The peak latency of ΔPa (102 ms) was significantly earlier than ΔPd (159 ms) (p = 2.58 × 10⁻¹⁵). Mean integral values between 100 and 200 ms (±SE) of MMR, ΔPd, ΔPa, and ΔPt were 0.75 ± 0.062, 0.66 ± 0.068, 0.096 ± 0.034, and −0.0084 ± 0.024, respectively (Figure 4b). ANOVA showed a significant difference among these values (F(2, 174) = 3.05). Post hoc analyses revealed ΔPd as significantly larger than ΔPa (p = 2.77 × 10⁻¹¹) and ΔPt (p = 2.15 × 10⁻¹⁴).
Figure 4.
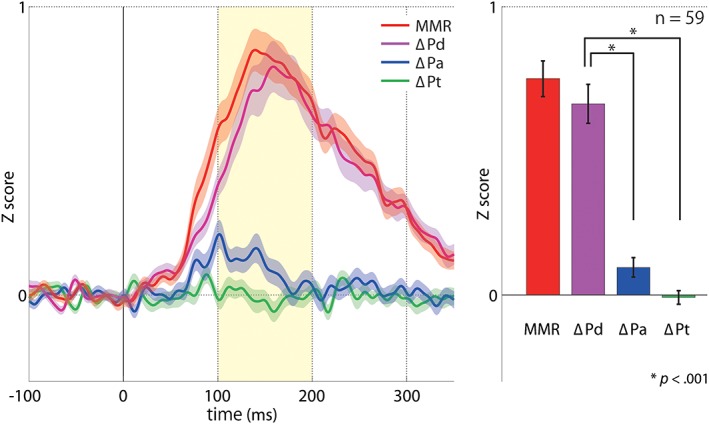
Comparison of contribution degree of ΔPd, ΔPa, and ΔPt in MMR generation. To investigate the gross contribution degree of each component regardless of the cortical locations, we calculated the mean time course (a) and integral value (100–200 ms) (b) for each component regarding the 59 electrodes with significant MMR. (a) The mean time course (±SE) of the 59 electrodes regarding each component is shown. The peak latency of MMR, ΔPd, and ΔPa were 140, 159, and 102 ms, respectively. (b) Mean integral values between 100 and 200 ms poststimulus (±SE) of MMR (red), ΔPd (pink), ΔPa (blue), and ΔPt (green) are 0.75 ± 0.062, 0.66 ± 0.068, 0.096 ± 0.034, and −0.0084 ± 0.024, respectively. anova shows a significant difference among ΔPd, ΔPa, and ΔPt. Post hoc analyses reveal ΔPd as significantly larger than ΔPa and ΔPt
We then investigated the spatial profiles of MMR and its components at the group level. First, we identified a gyrus‐level location for each electrode in each individual brain. Results are summarized in Table 2. The number of electrodes showing significant MMR was 59 (left/right: 39/20), with 45 (31/14; 75%) located in the STG. We found significant MMR at 3 (1/2) and 2 (2/0) electrodes in the inferior frontal gyrus (IFG) and the MFG, respectively. Of note, 34 (21/13) electrodes with significant ΔPd were detected, with 25 (18/7; 74%) located in the STG. On the other hand, significant ΔPa was observed at only 4 (2/2) electrodes (7%), with all located in the STG. No significant responses of ΔPt were detected at any electrode.
Table 2.
Numbers of electrodes with significant MMR and its components regarding electrode locations
| Temporal lobe | Parietal lobe | Frontal lobe | |||||
|---|---|---|---|---|---|---|---|
| STG | MTG | PoCG | SMG | MFG | IFG | Total | |
| MMR | 45 (31/14) | 3 (1/2) | 5 (3/2) | 1 (1/0) | 2 (2/0) | 3 (1/2) | 59 (39/20) |
| ΔPd | 25 (18/7) | 3 (1/2) | 2 (0/2) | 0 (0/0) | 2 (2/0) | 2 (0/2) | 34 (21/13) |
| ΔPa | 4 (2/2) | 0 | 0 | 0 | 0 | 0 | 4 (2/2) |
| ΔPt | No significant responses detected at any electrodes. | ||||||
Left/Right; Abbreviations: IFG = inferior frontal gyrus; MFG = middle frontal gyrus; MTG = middle temporal gyrus; PoCG = postcentral gyrus; SMG = supramarginal gyrus; STG = superior temporal gyrus.
Numbers of electrodes were extracted based on individual brain fused with postoperative computed tomography. No significant responses of ΔPt were detected at any electrodes.
To visualize the above summarized spatial profiles of MMR and its components with finer resolution, we obtained MNI coordinates of all electrodes through spatial normalization of individual brains and co‐registered electrodes. We then showed the spatial distribution of electrodes with significant MMR, ΔPd, and ΔPa on the template brain (Figure 5). The electrode coverage ranged over a wide area of the lateral surface of the template brain. Impressively, most MMRs clustered around the posterior part of the STG, with the exception of a few electrodes located in the prefrontal cortex and the most posterior part of the temporal lobe. Few studies have reported obvious clustering of MMR in the lateral STG (Edwards et al., 2005). Moreover, this analysis is the first to reveal the distribution of MMR regarding the anteroposterior axis. The most striking finding was that the distribution of ΔPd was almost identical to that of MMR. With this spatial and quantitative finding, we showed that the main component of MMR was deviance detection. On the other hand, ΔPa localized to a limited area on the superior temporal plane, close to the primary auditory cortex. The distribution patterns of MMR, ΔPd, and ΔPa were broadly comparable between right and left. No electrodes showed significant ΔPt.
Figure 5.
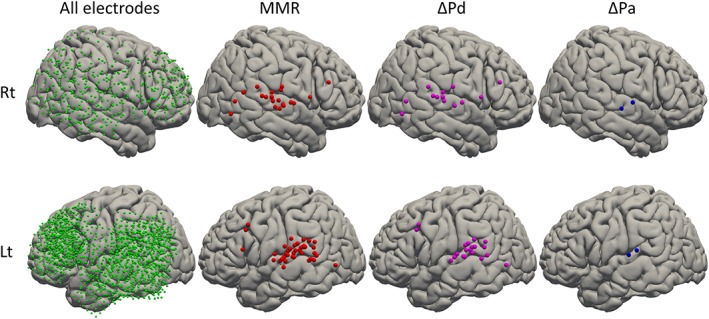
Distribution of MMR, ΔPd, and ΔPa on the template brain. To visualize spatial profiles of MMR and its components with finer resolution, we obtained MNI coordinates of all electrodes through spatial normalization of individual brains and co‐registered electrodes. We then showed spatial distributions of electrodes with significant MMR (red), ΔPd (pink), and ΔPa (blue) on the template brain. Upper and lower rows of hemispheres represent the right and left hemispheres, respectively. Electrode coverage ranges over a wide area of the lateral surface of the template brain (left). Impressively, most MMR are clustered around the posterior part of the STG, with the exception of a few electrodes. The most striking finding was that the distribution of ΔPd was almost identical to that of MMR, showing that the main component of MMR is deviance detection spatially. On the other hand, ΔPa is localized in the limited area on the superior temporal plane. Distribution patterns of MMR, ΔPd, and ΔPa are almost comparable between right and left. No electrodes show significant ΔPt
4. DISCUSSION
Our results demonstrate that “deviance detection,” which is higher‐level neural processing than “adaptation,” plays an important role in auditory contextual processing at the level of STG. We isolated and quantified deviance detection and adaptation as essential components of MMR and demonstrated their impact and distribution on the human brain using ECoG recorded during an auditory mismatch task paradigm. MMR distributed around the bilateral posterior STG, and the main component was deviance detection. At the same time, the adaptation component was detected at a limited number of electrodes on the superior temporal plane. Tone difference showed no contribution to MMR generation at any electrode in the lateral cortices.
4.1. Significance of deviance detection in the lateral STG
The most prominent result achieved by this detailed analysis on MMR in the lateral cortices was the demonstration of superiority and clustering of deviance detection in the lateral STG. In addition, adaptation was also detected in a limited area of STG, where both deviance detection and adaptation contributed to the MMR. We found that contribution degree of both components differed depending on locations in the STG, suggesting a gradation of both components in STG. In other words, lower‐level neural adaptation may transition to higher‐level deviance detection in STG. These findings may prove helpful in understanding the auditory contextual processing in a functional–anatomical perspective, as it is surprising that such higher‐level perceptive function is already implemented in the temporal lobe. The STG, therefore, seems to play a role as a hub in the hierarchical structure of the primary auditory cortex, STG, and frontal lobe. Recent invasive studies have started to reveal functional segregation of this complicated system, as discussed below. The result of this study seems to be a missing link connecting the important findings obtained from previous studies, such as adaptation in the primary auditory cortex (Fishman & Steinschneider, 2012) and higher predictive processes in the frontal lobe (Durschmid et al., 2016).
In addition, the results of our study could provide an important perspective for interpretation of MMN. In the past studies, EEG and MEG have been mainly used to analyze MMN. Equivalent current dipoles generated in the primary auditory cortex and lateral STG are mutually perpendicular. EEG electrodes on the top of the head are sensitive to the activity of the primary auditory cortex. On the other hand, MEG is sensitive to dipoles which are tangential to its sensors, meaning that MEG is insensitive to the activity of the lateral STG. Therefore, the impact of deviance detection in the lateral STG might have been underestimated in the past MMN studies.
The results of this study were only achieved by the incorporation of many standards task into a human ECoG study for the first time. The importance of appropriate control tasks to isolate the component of deviance detection in MMN studies has been pointed out through recent literature (Featherstone, Melnychenko, & Siegel, 2018; Fishman & Steinschneider, 2012; Grimm et al., 2011; Maess et al., 2007). In this study, the excellent S/N and spatial resolution realized by using high‐density electrodes and analysis of high‐frequency oscillation successfully addressed the issue of isolation and detailed profiling of MMN/MMR components. As shown in the illustrative case, a 5‐mm difference on the cortical surface resulted in dramatically different representations of MMR and its components (Figure 3). Without this 5‐mm spatial resolution, detecting the adaptation component in the lateral cortex would be more difficult and the picture obtained in this study might have changed.
4.2. What does localized distribution of adaptation suggest?
The adaptation component was detected in a limited area along the Sylvian fissure. This may be due to lateral extension of the primary auditory cortex, although our study provides no direct evidence for this speculation as direct recording from the primary auditory cortex was not conducted in any of the patients in our study. Several studies based on invasive recordings have shown the primary auditory cortex is concerned primarily with adaptation (Farley et al., 2010; Fishman & Steinschneider, 2012; Ulanovsky, Las, & Nelken, 2003). Fishman et al. recorded evoked potentials, current source density, and multiunit activity evoked by mismatch tasks with depth electrodes inserted to the primary auditory cortex of macaques, and investigated the mechanisms of MMN generation by comparing results between OD and MS tasks under a paradigm similar to that in our study (Fishman & Steinschneider, 2012). Although the deviant sound of the OD task evoked larger response than the standard sound in every analysis, no significant difference was seen between responses evoked by the deviant sound of the OD task and the same‐pitch sound of the MS task, corresponding to ΔPd in our study. They suggested that the primary auditory cortex in the macaque is involved in only adaptation, and not deviance detection. However, the relationship between lateral cortex and the component of deviance detection remained unclear, because they did not conduct recordings of the lateral cortices. Our results for the lateral STG and the findings of Fishman et al. regarding the primary auditory cortex thus suggest in combination that auditory contextual processing develops along the medial–lateral axis within the STG. The notion of medial–lateral processing in STG means that adaptation would take place earlier than deviance detection. In line with this assumption, Maess et al., in their MEG study, demonstrated that early and late components of MMN reflected adaptation and deviance detection, respectively (Maess et al., 2007). The grand average of time course of MMR components in our study (Figure 4a) showed shorter latency of adaptation than that of deviance detection, also supporting the auditory contextual processing in the medial–lateral axis within STG.
4.3. Involvement of other cortical areas in MMR/MMN generation
As shown in Figure 5, we found that MMR was localized in the STG. On the other hand, significant MMR was not detected in the adjacent areas, such as the IFG, middle temporal gyrus (MTG), or supramarginal gyrus (SMG), where have been considered to be responsible for auditory processing. There could be several reasons.
First, the passive task paradigm adopted in this study could have affected the results of this study. Some studies have shown the possibility that the frontal lobe is relevant to MMN generation (Bekinschtein et al., 2009; Durschmid et al., 2016; El Karoui et al., 2014; Strauss et al., 2015; Wacongne et al., 2011). Durschmid et al. recorded ECoG using “unpredictable” and “predictable” stimuli in which deviant stimuli were presented at random and regularly, respectively. Although little difference was seen between the mismatch response of the frontal lobe and that of STG for “predictable” stimuli, significantly stronger response of the frontal lobe was detected for “unpredictable” stimuli. That result showed that the frontal lobe was responsible for detecting “prediction errors” (Durschmid et al., 2016). In our study, although frontal MMR was observed in four of the 10 subjects, neither a consistent localization pattern nor association with MMR was evident in the frontal lobe. Our task paradigm was not designed to induce the factor of prediction.
Second, the difference in statistical procedures might have affected the results. We used a conservative statistical threshold with correction for multiple comparisons, as the total number of electrodes in this study seemed to be large enough. There is a trade‐off between a small number of electrodes with true responses and a large number of electrodes with minor effects (Durschmid et al., 2016). We believe our result is robust, but we could have overlooked minor and important responses in the IFG, MTG, or SMG.
The third point is the issue of the length of ISIs. Various ISIs have been used from 250 ms to 12 s in the past MMN studies (Bartha‐Doering, Deuster, Giordano, am Zehnhoff‐Dinnesen, & Dobel, 2015). In this study, a relatively short ISI (500 ms) was used, as several studies have reported that longer ISIs reduced the strength of MMR (Mantysalo & Naatanen, 1987; Sams, Hari, Rif, & Knuutila, 1993) and longer recording time seemed to make it difficult for patients with epilepsy to keep their concentration. In fact, a considerable number of MMN studies used ISIs between 500 and 600 ms (Durschmid et al., 2016; Maess et al., 2007). However, it should be noted that using short ISIs, the next sound stimuli can be delivered before the cortical activities induced by one sound stimuli have returned to a base line (Nourski et al., 2014). In that cases, MMR could be underestimated.
Thus, in the interpretation of the results of this study, we need to consider only the most robust activities induced by predictable mismatch task were detected in this study. To reveal involvement of other cortical areas in MMR/MMN generation, further studies using various task and recording condition are necessary.
4.4. Limitations
First, subjects in this study were patients with refractory epilepsy, which might have affected the impact, distribution, and contribution degree of each component of MMR at least at the individual level. To overcome this issue, we performed across‐subject analysis in the template brain and tried to minimize the effect of epileptic foci on the overall result.
Second, the activity of the primary auditory cortex was not recorded in our study using subdural electrodes only. Accumulation of data derived from depth electrodes may directly show the contribution of deviance detection, adaptation, and tone difference in the primary auditory cortex.
Third, quantitative comparison on the laterality of MMR was not performed in our study, as differences in electrode density were seen between the left and right sides (Figure 5). Although MMR was detected bilaterally in all six subjects with bilateral electrode implantation and spatial profiles of the three components were quite similar on both sides, further discussion on the laterality of MMR was beyond the scope of our study. Future studies are needed to address this issue.
Finally, standard and deviant stimuli of our mismatch task were delivered in random order. Most prior studies adopted pseudorandom order so that deviant stimuli were not delivered twice in a row (Durschmid et al., 2016; Fishman & Steinschneider, 2012; Recasens et al., 2014). Compared with these studies, deviance detection and adaptation might have been under‐ and over‐estimated in our study, respectively.
In conclusion, we demonstrated deviance detection as the dominant component of MMR in the bilateral posterior STG, whereas adaptation contributed to MMR in a limited area on the superior temporal plane. The STG has been assumed to connect the primary auditory cortex and frontal lobe in auditory contextual processing. This is the first human ECoG study to show that deviance detection, as a kind of high‐level neural perceptive function in the posterior lateral STG, plays a key role in generating MMR/MMN. These findings may have importance in unveiling the neurocognitive and circuit bases of auditory contextual processing in humans.
ACKNOWLEDGMENTS
This research was supported by the program for Brain Mapping by Integrated Neurotechnologies for Disease Studies (Brain/MINDS) from the Japan Agency for Medical Research and development (AMED) under grant number JP15km0908001. This research was also supported in part by UTokyo Center for Integrative Science of Human Behavior (CiSHuB) and by International Research Center for NeuroIntelligence (IRCN). The authors declare no competing financial interests.
Ishishita Y, Kunii N, Shimada S, et al. Deviance detection is the dominant component of auditory contextual processing in the lateral superior temporal gyrus: A human ECoG study. Hum Brain Mapp. 2019;40:1184–1194. 10.1002/hbm.24438
Funding information: International Research Center for NeuroIntelligence (IRCN); UTokyo Center for Integrative Science of Human Behavior (CiSHuB); Japan Agency for Medical Research and development, Grant/Award Number: JP15km0908001
REFERENCES
- Alho, K. (1995). Cerebral generators of mismatch negativity (MMN) and its magnetic counterpart (MMNm) elicited by sound changes. Ear and Hearing, 16(1), 38–51. [DOI] [PubMed] [Google Scholar]
- Bartha‐Doering, L. , Deuster, D. , Giordano, V. , am Zehnhoff‐Dinnesen, A. , & Dobel, C. (2015). A systematic review of the mismatch negativity as an index for auditory sensory memory: From basic research to clinical and developmental perspectives. Psychophysiology, 52(9), 1115–1130. 10.1111/psyp.12459 [DOI] [PubMed] [Google Scholar]
- Bekinschtein, T. A. , Dehaene, S. , Rohaut, B. , Tadel, F. , Cohen, L. , & Naccache, L. (2009). Neural signature of the conscious processing of auditory regularities. Proceedings of the National Academy of Sciences of the United States of America, 106(5), 1672–1677. 10.1073/pnas.0809667106 [DOI] [PMC free article] [PubMed] [Google Scholar]
- Bodatsch, M. , Ruhrmann, S. , Wagner, M. , Muller, R. , Schultze‐Lutter, F. , Frommann, I. , … Brockhaus‐Dumke, A. (2011). Prediction of psychosis by mismatch negativity. Biological Psychiatry, 69(10), 959–966. 10.1016/j.biopsych.2010.09.057 [DOI] [PubMed] [Google Scholar]
- Crone, N. E. , Boatman, D. , Gordon, B. , & Hao, L. (2001). Induced electrocorticographic gamma activity during auditory perception. Brazier award‐winning article, 2001. Clinical Neurophysiology, 112(4), 565–582. [DOI] [PubMed] [Google Scholar]
- Durschmid, S. , Edwards, E. , Reichert, C. , Dewar, C. , Hinrichs, H. , Heinze, H. J. , … Knight, R. T. (2016). Hierarchy of prediction errors for auditory events in human temporal and frontal cortex. Proceedings of the National Academy of Sciences of the United States of America, 113(24), 6755–6760. 10.1073/pnas.1525030113 [DOI] [PMC free article] [PubMed] [Google Scholar]
- Edwards, E. , Soltani, M. , Deouell, L. Y. , Berger, M. S. , & Knight, R. T. (2005). High gamma activity in response to deviant auditory stimuli recorded directly from human cortex. Journal of Neurophysiology, 94(6), 4269–4280. 10.1152/jn.00324.2005 [DOI] [PubMed] [Google Scholar]
- El Karoui, I. , King, J. R. , Sitt, J. , Meyniel, F. , Van Gaal, S. , Hasboun, D. , … Naccache, L. (2014). Event‐related potential, time‐frequency, and functional connectivity facets of local and global auditory novelty processing: An intracranial study in humans. Cerebral Cortex, 25, 4203–4212. 10.1093/cercor/bhu143 [DOI] [PMC free article] [PubMed] [Google Scholar]
- Erickson, M. A. , Ruffle, A. , & Gold, J. M. (2016). A meta‐analysis of mismatch negativity in schizophrenia: From clinical risk to disease specificity and progression. Biological Psychiatry, 79(12), 980–987. 10.1016/j.biopsych.2015.08.025 [DOI] [PMC free article] [PubMed] [Google Scholar]
- Farley, B. J. , Quirk, M. C. , Doherty, J. J. , & Christian, E. P. (2010). Stimulus‐specific adaptation in auditory cortex is an NMDA‐independent process distinct from the sensory novelty encoded by the mismatch negativity. The Journal of Neuroscience, 30(49), 16475–16484. 10.1523/JNEUROSCI.2793-10.2010 [DOI] [PMC free article] [PubMed] [Google Scholar]
- Featherstone, R. E. , Melnychenko, O. , & Siegel, S. J. (2018). Mismatch negativity in preclinical models of schizophrenia. Schizophrenia Research, 191, 35–42. 10.1016/j.schres.2017.07.039 [DOI] [PubMed] [Google Scholar]
- Fishman, Y. I. , & Steinschneider, M. (2012, Nov 7). Searching for the mismatch negativity in primary auditory cortex of the awake monkey: Deviance detection or stimulus specific adaptation? The Journal of Neuroscience Retrieved from, 32, 15747–15758. http://www.ncbi.nlm.nih.gov/pubmed/23136414 [DOI] [PMC free article] [PubMed] [Google Scholar]
- Garrido, M. I. , Friston, K. J. , Kiebel, S. J. , Stephan, K. E. , Baldeweg, T. , & Kilner, J. M. (2008). The functional anatomy of the MMN: A DCM study of the roving paradigm. NeuroImage, 42(2), 936–944. 10.1016/j.neuroimage.2008.05.018 [DOI] [PMC free article] [PubMed] [Google Scholar]
- Garrido, M. I. , Kilner, J. M. , Stephan, K. E. , & Friston, K. J. (2009). The mismatch negativity: A review of underlying mechanisms. Clinical Neurophysiology, 120(3), 453–463. 10.1016/j.clinph.2008.11.029 [DOI] [PMC free article] [PubMed] [Google Scholar]
- Giard, M. H. , J, L. , Reinikainen, K. , Perrin, F. , Bertrand, O. , Pernier, J. , & Naatanen, R. (1995). Separate representation of stimulus frequency, intensity, and duration in auditory sensory memory. Journal of Cognitive Neuroscience, 7(2), 133–143. [DOI] [PubMed] [Google Scholar]
- Grimm, S. , Escera, C. , Slabu, L. , & Costa‐Faidella, J. (2011). Electrophysiological evidence for the hierarchical organization of auditory change detection in the human brain. Psychophysiology, 48(3), 377–384. 10.1111/j.1469-8986.2010.01073.x [DOI] [PubMed] [Google Scholar]
- Hickok, G. , & Poeppel, D. (2007). The cortical organization of speech processing. Nature Reviews. Neuroscience, 8(5), 393–402. 10.1038/nrn2113 [DOI] [PubMed] [Google Scholar]
- Hoddes, E. , Zarcone, V. , Smythe, H. , Phillips, R. , & Dement, W. C. (1973). Quantification of sleepiness: A new approach. Psychophysiology, 10(4), 431–436. [DOI] [PubMed] [Google Scholar]
- Horvath, J. , Czigler, I. , Jacobsen, T. , Maess, B. , Schroger, E. , & Winkler, I. (2008). MMN or no MMN: No magnitude of deviance effect on the MMN amplitude. Psychophysiology, 45(1), 60–69. 10.1111/j.1469-8986.2007.00599.x [DOI] [PubMed] [Google Scholar]
- Jaaskelainen, I. P. , Ahveninen, J. , Bonmassar, G. , Dale, A. M. , Ilmoniemi, R. J. , Levanen, S. , … Belliveau, J. W. (2004). Human posterior auditory cortex gates novel sounds to consciousness. Proceedings of the National Academy of Sciences of the United States of America, 101(17), 6809–6814. 10.1073/pnas.0303760101 [DOI] [PMC free article] [PubMed] [Google Scholar]
- Maess, B. , Jacobsen, T. , Schroger, E. , & Friederici, A. D. (2007). Localizing pre‐attentive auditory memory‐based comparison: Magnetic mismatch negativity to pitch change. NeuroImage, 37(2), 561–571. 10.1016/j.neuroimage.2007.05.040 [DOI] [PubMed] [Google Scholar]
- Makeig, S. , Debener, S. , Onton, J. , & Delorme, A. (2004). Mining event‐related brain dynamics. Trends in Cognitive Sciences, 8(5), 204–210. 10.1016/j.tics.2004.03.008 [DOI] [PubMed] [Google Scholar]
- Mantysalo, S. , & Naatanen, R. (1987). The duration of a neuronal trace of an auditory stimulus as indicated by event‐related potentials. Biological Psychology, 24(3), 183–195. [DOI] [PubMed] [Google Scholar]
- May, P. J. , & Tiitinen, H. (2010). Mismatch negativity (MMN), the deviance‐elicited auditory deflection, explained. Psychophysiology, 47(1), 66–122. 10.1111/j.1469-8986.2009.00856.x [DOI] [PubMed] [Google Scholar]
- Näätänen, R. (1995). The mismatch negativity: A powerful tool for cognitive neuroscience. Ear and Hearing, 16(1), 6–18. [PubMed] [Google Scholar]
- Näätänen, R. , Gaillard, A. W. , & Mantysalo, S. (1978). Early selective‐attention effect on evoked potential reinterpreted. Acta Psychologica, 42(4), 313–329. [DOI] [PubMed] [Google Scholar]
- Näätänen, R. , Jacobsen, T. , & Winkler, I. (2005). Memory‐based or afferent processes in mismatch negativity (MMN): A review of the evidence. Psychophysiology, 42(1), 25–32. 10.1111/j.1469-8986.2005.00256.x [DOI] [PubMed] [Google Scholar]
- Näätänen, R. , Paavilainen, P. , Rinne, T. , & Alho, K. (2007). The mismatch negativity (MMN) in basic research of central auditory processing: A review. Clinical Neurophysiology, 118(12), 2544–2590. 10.1016/j.clinph.2007.04.026 [DOI] [PubMed] [Google Scholar]
- Nagai, T. , Tada, M. , Kirihara, K. , Yahata, N. , Hashimoto, R. , Araki, T. , & Kasai, K. (2013). Auditory mismatch negativity and P3a in response to duration and frequency changes in the early stages of psychosis. Schizophrenia Research, 150(2–3), 547–554. 10.1016/j.schres.2013.08.005 [DOI] [PubMed] [Google Scholar]
- Nourski, K. V. , Steinschneider, M. , Oya, H. , Kawasaki, H. , Jones, R. D. , & Howard, M. A. (2014). Spectral organization of the human lateral superior temporal gyrus revealed by intracranial recordings. Cerebral Cortex, 24(2), 340–352. 10.1093/cercor/bhs314 [DOI] [PMC free article] [PubMed] [Google Scholar]
- Opitz, B. , Schroger, E. , & von Cramon, D. Y. (2005). Sensory and cognitive mechanisms for preattentive change detection in auditory cortex. The European Journal of Neuroscience, 21(2), 531–535. 10.1111/j.1460-9568.2005.03839.x [DOI] [PubMed] [Google Scholar]
- Perez, V. B. , Woods, S. W. , Roach, B. J. , Ford, J. M. , McGlashan, T. H. , Srihari, V. H. , & Mathalon, D. H. (2014). Automatic auditory processing deficits in schizophrenia and clinical high‐risk patients: Forecasting psychosis risk with mismatch negativity. Biological Psychiatry, 75(6), 459–469. 10.1016/j.biopsych.2013.07.038 [DOI] [PMC free article] [PubMed] [Google Scholar]
- Phillips, H. N. , Blenkmann, A. , Hughes, L. E. , Bekinschtein, T. A. , & Rowe, J. B. (2015). Hierarchical Organization of Frontotemporal Networks for the prediction of stimuli across multiple dimensions. The Journal of Neuroscience, 35(25), 9255–9264. 10.1523/jneurosci.5095-14.2015 [DOI] [PMC free article] [PubMed] [Google Scholar]
- Recasens, M. , Grimm, S. , Capilla, A. , Nowak, R. , & Escera, C. (2014). Two sequential processes of change detection in hierarchically ordered areas of the human auditory cortex. Cerebral Cortex, 24(1), 143–153. 10.1093/cercor/bhs295 [DOI] [PubMed] [Google Scholar]
- Sams, M. , Hari, R. , Rif, J. , & Knuutila, J. (1993). The human auditory sensory memory trace persists about 10 sec: Neuromagnetic evidence. Journal of Cognitive Neuroscience, 5(3), 363–370. 10.1162/jocn.1993.5.3.363 [DOI] [PubMed] [Google Scholar]
- Sheehan, D. V. , Lecrubier, Y. , Sheehan, K. H. , Amorim, P. , Janavs, J. , Weiller, E. , … Dunbar, G. C. (1998). The mini‐international neuropsychiatric interview (M.I.N.I.): The development and validation of a structured diagnostic psychiatric interview for DSM‐IV and ICD‐10. The Journal of Clinical Psychiatry, 59(Suppl 20), 22–33 quiz 34–57. [PubMed] [Google Scholar]
- Shelley, A. M. , Ward, P. B. , Catts, S. V. , Michie, P. T. , Andrews, S. , & McConaghy, N. (1991). Mismatch negativity: An index of a preattentive processing deficit in schizophrenia. Biological Psychiatry, 30(10), 1059–1062. [DOI] [PubMed] [Google Scholar]
- Strauss, M. , Sitt, J. D. , King, J. R. , Elbaz, M. , Azizi, L. , Buiatti, M. , … Dehaene, S. (2015). Disruption of hierarchical predictive coding during sleep. Proceedings of the National Academy of Sciences of the United States of America, 112(11), E1353–E1362. 10.1073/pnas.1501026112 [DOI] [PMC free article] [PubMed] [Google Scholar]
- Thomas, M. L. , Green, M. F. , Hellemann, G. , Sugar, C. A. , Tarasenko, M. , Calkins, M. E. , … Light, G. A. (2017). Modeling deficits from early auditory information processing to psychosocial functioning in schizophrenia. JAMA Psychiatry, 74(1), 37–46. 10.1001/jamapsychiatry.2016.2980 [DOI] [PMC free article] [PubMed] [Google Scholar]
- Ulanovsky, N. , Las, L. , & Nelken, I. (2003). Processing of low‐probability sounds by cortical neurons. Nature Neuroscience, 6(4), 391–398. 10.1038/nn1032 [DOI] [PubMed] [Google Scholar]
- Umbricht, D. , & Krljes, S. (2005). Mismatch negativity in schizophrenia: A meta‐analysis. Schizophrenia Research, 76(1), 1–23. 10.1016/j.schres.2004.12.002 [DOI] [PubMed] [Google Scholar]
- Wacongne, C. , Changeux, J. P. , & Dehaene, S. (2012). A neuronal model of predictive coding accounting for the mismatch negativity. The Journal of Neuroscience, 32(11), 3665–3678. 10.1523/JNEUROSCI.5003-11.2012 [DOI] [PMC free article] [PubMed] [Google Scholar]
- Wacongne, C. , Labyt, E. , van Wassenhove, V. , Bekinschtein, T. , Naccache, L. , & Dehaene, S. (2011). Evidence for a hierarchy of predictions and prediction errors in human cortex. Proceedings of the National Academy of Sciences of the United States of America, 108(51), 20754–20759. 10.1073/pnas.1117807108 [DOI] [PMC free article] [PubMed] [Google Scholar]